
Identify and interpret atmospheric phenomena
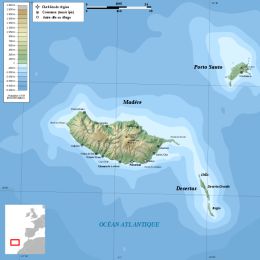
During early morning and morning on 20th February 2010 an extreme and rare flash flood event has occurred in the Portuguese island of Madeira.
In the coastal city of Funchal an amount of 111.5 mm (05:10-11:10 UTC) occurred in a 6-hour period (with a 24h amount of 144.3 mm). Higher amounts were recorded in the mountainous weather station Pico do Areeiro, at 1510 meters, with a 6-hour peak of 272.1 mm (08:50-14:50UTC). This mountain area is right upstream of Funchal, therefore, the precipitation in the mountain simply flowed downslope along rivers that are usually small, summing up to an already high amount of water in lower altitudes. A precipitation time-lag between Funchal and Areeiro is clearly depicted in the temporal evolution of 10-minute precipitation. Note values in excess of 10 mm/10 minutes in Funchal and 15mm/10 minutes in Areeiro during the most intense time periods. The Portuguese met. service followed this extreme event issuing gradually higher levels of precipitation warnings since the day before: yellow warning at 19:27 UTC on 19th, orange warning at 08:53 UTC on the 20th and red warning one hour later, at 10:03 UTC.
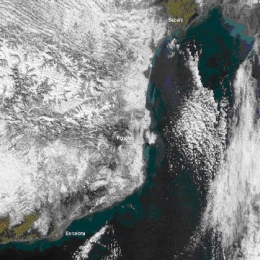
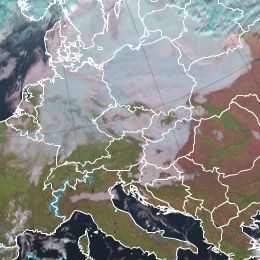
An upper level low causing heavy snowfall in the Mediterranean and Eastern Europe.
An upper level cold core low depresses due to heavy cold air advection backside of the trough over the Iberian Peninsula. Heavy Snowfall in the Mediterranean area and in the following days in Austria and East Europe was the result of an intense cyclogenesis over the relatively warm Mediterranean Sea.
In addition to the heavy snowfall a very strong Bora established in the east Adriatic coast due to the great temperature and pressure gradient over the Dinaric coastal mountain. As a result of the very strong wind even some infrastructure was damaged in this area.
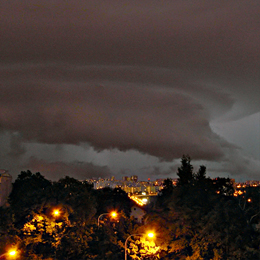
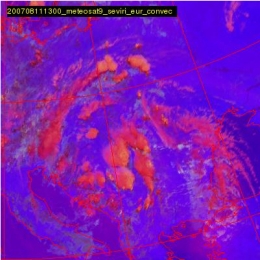
The storms, which occurred on August 15th 2010 in parts of central and eastern Europe, were interesting from many aspects, some of which are described briefly in this case study.
The storms, which occurred on August 15th 2010 in parts of central and eastern Europe, were interesting from many aspects, some of which are described in this case study. Given the highly variable appearance and characteristics of these storms the need existed to further examine in detail and to use the case for testing of various convection-related algorithms.
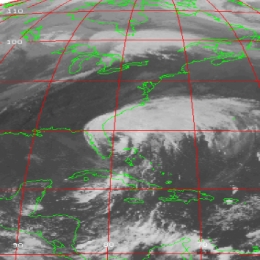
This case initially attracted our attention because of the severe hailstorm in Prague in the early evening, which caused an estimated 180 million EUR damage to property in less than one hour. This alone would not be a reason for focusing on this case; the main reason was the appearance of this storm\'s cloud top. From the MSG satellite perspective the storm could have easily been overlooked due to its relatively warm cloud top and small size, as seen in the Meteosat 8 IR10.8 BT image below.
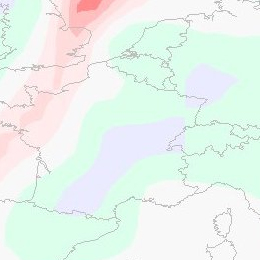
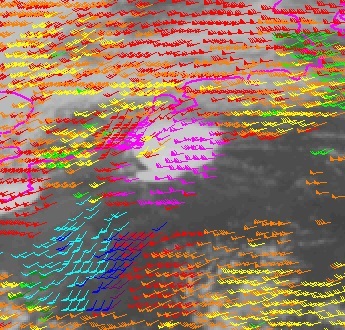
On September 12th 2010 a major PV anomaly, in the rear of a cold front, moved over France and hit Germany and Switzerland in the late evening and also Austria during the night. On the front side of this anomaly convective cells developed and brought some rain showers and thunderstorms.
On September 12th 2010 a major PV anomaly, in the rear of a cold front, moved over France and hit Germany and Switzerland in the late evening and also Austria during the night. On the front side of this anomaly convective cells developed and brought some rain showers and thunderstorms. At first the ECMWF-model, especially the 00 UTC run from September 12th, was lacking performance shifted the PV maximum more westward. In this case study we analyse not only the synoptic situation, but also the model error. In the following we take a look at the MPEF (Meteosat Product Extraction Facility) Divergence product, how it works and whether it would have been helpful in this case as a nowcasting tool.
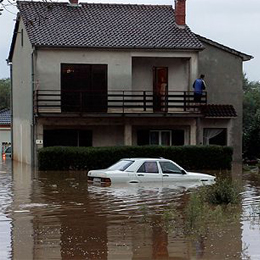
During the night from 24 to 25 September 2010 heavy rain caused flash-flooding of the town of Pula and the surrounding area.
The case study shows that the flash floods in Pula were the result of a convective system which developed in the convergence zone caused by a specific placing of two Mediterranean cyclones. Generally, the Mediterranean region is recognized as one of the most cyclogenetic regions in the world. Mediterranean cyclones are classified in 3 major types: Genoa cyclones, Adriatic cyclones and non-Genoa cyclones. Although it is rather rare, the major-type cyclones can exist simultaneously belonging to the theoretical category of twin or eyeglass cyclones. The most common twins are the simultaneous Genoa and Adriatic cyclones (Brzovic, 1999), therefore classified as the 4th type of Mediterranean cyclones. Depending of the season and general synoptic conditions, the paths of the cyclones in the Mediterranean basin are diverse. On their way through this complex geography, they can produce a range of extreme weather phenomena such as heavy orographic precipitation, thunderstorms, supercells and mesoscale convective systems.
At 18 August 2011 a severe thunderstorm system developed over Belgium. This case study investigates the synoptic situation in which the windstorm developed using satellite, radar, NWP fields and lightning data.
On 18 August 2011 a severe thunderstorm system developed over Belgium. It initiated over France and then passed over Belgium, the Netherlands and Germany. The studied thunderstorm grew fast and was long-lived. It was extremely severe; particularly the downdraft was extremely strong. The most intense part of the windstorm hit the Pukkelpop festival organized close to the city of Hasselt. There were 60 thousand people at the festival, staying mainly at the camping site. The strong wind flattened tents, uprooted trees, brought down festival light towers and TV screens, and caused a stage to collapse. Five people were killed and 140 people injured in the storm, ten of them seriously. The aim of this case study is to describe the synoptic situation in which the windstorm was initiated and developed, and to describe its characteristics by means of satellite, radar and lightning data and numerical simulation.
This case study presents an analysis of radiation fog event over the Pannonian Basin that took place from 18th to 20th November, 2011.
This case study presents an analysis of radiation in a fog event over the Pannonian Basin that took place from 18th to 20th November, 2011. It is an example of the conceptual model of fog and stratus cloudiness. Special attention is dedicated to the analysis of vertical atmospheric profiles (temperature, humidity and wind) combined with satellite observation.
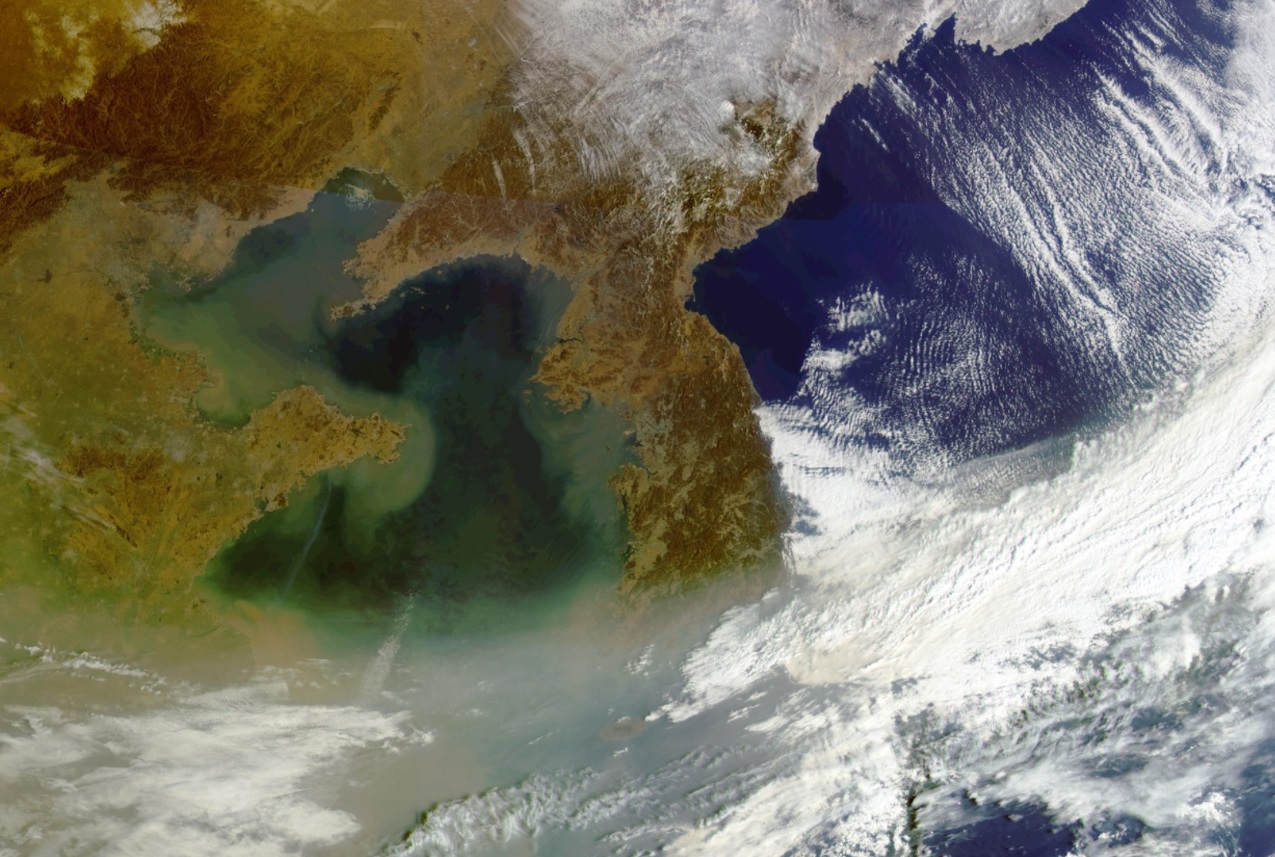
Ok Hee Kim holds the weather briefing for the South Korean region. Her topics are: Asian Dust, Typhoons and typical weather phenomena in East Asia.
Length: 50 min
Author: Ok Hee Kim
Ok Hee received her BSc in Astronomy at the Chungbuk National University at Chungchungbukdo the province of South Korea (1992), and MSc in Meteorology from the Seoul National University in Seoul South Korea (2004). She is preparing for the PhD. Her areas of interest include severe weather, lake-effect snow, Asian dust, fog and applications of satellite imagery to weather forecasting, particularly on the mesoscale. She worked at weather forecasting division as assistant for weather forecaster for 3 years from 1992 and satellite image analyst 3 years from 1996. She has been a research associate at NMSC (National Meteorological Satellite Center) KMA (Korea Meteorological Administration) since 2006. She is currently working as a meteorological satellite image trainer and analyzer of COMS (Communication Ocean Meteorological Satellite) image for KMA's weather forecaster in NMSC. Presently, she is trying to develop Conceptual Models which are applicated in East Asia after training SATREP in ZAMG.
Vesa Nietosvaara and Larisa Nikitina give a weather briefing for the European region, Larisa focusses on the preparations for the 2014 Olympic Games in Sochi.
Length: 55 min
Author: Vesa Nietosvaara, Larisa Nikitina
Vesa Nietosvaara has worked as an operational weather forecaster for twenty years in 1988-2008. Since 1998 Vesa has been working within several training projects and created learning resources for operational meteorologists. Particularly, he is interested in satellite image interpretation and conceptual models for weather diagnosis. Most of his career Vesa has done at the Finnish Meteorological Institute, but since 2012 he works as a Training Officer at EUMETSAT. He assists the EUMeTrain monthly weather briefing team and regularly participates or lead the European online weather briefings (ePort weather briefings).
Larisa (Lara) Nikitina has been working as aviation weather forecaster in Rostov aviation center (Rostov-on-Don, south Russia) since 1985 after training as a weather forecaster in Russian State Hydrometeorological University (RSHU). And since 2010 she became the weather forecaster for Sochi 2014 Winter Olympics. Her special interests are the satellite meteorology applications for nowcasting and distance learning.
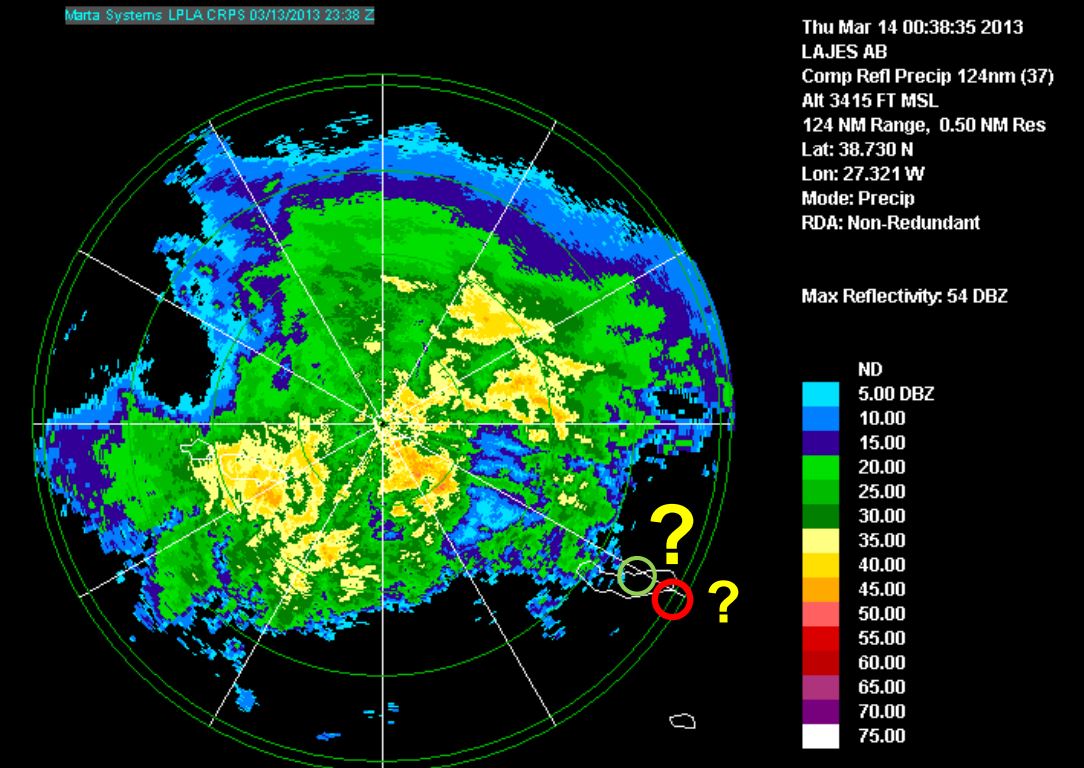
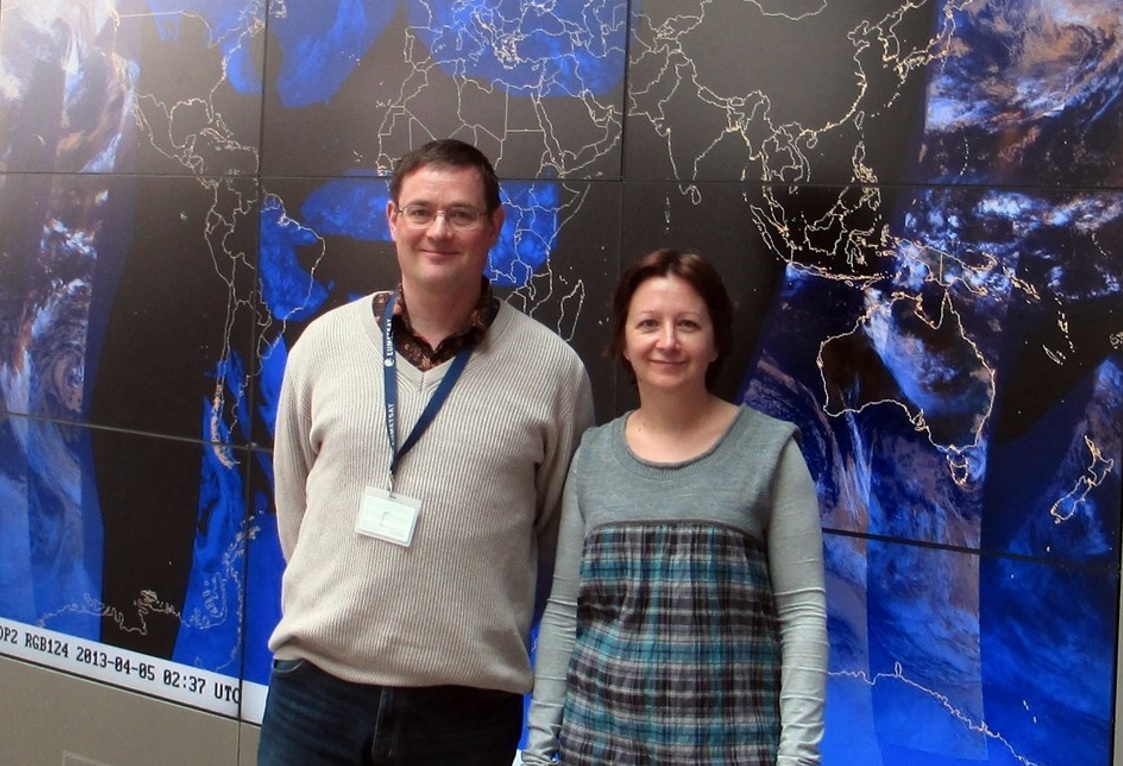
Diamantino Henriques gives a weather briefing for the Azores and looks back to the heavy rain event on 13th and 14th March 2013.
Length: 30 min
Author: Diamantino Henriques
Diamantino Henriques, received his degree in Atmospheric Physics at the University of Aveiro (1986) and his MS in Meteorology from the University of Lisboa (1996). From 1987 to 2003 he worked in Lisbon as meteorologist on atmospheric ozone and UV radiation issues. He has represented Portugal on several international meetings related with atmospheric composition and has participated in several projects and programs related with atmospheric ozone (GAW), atmospheric pollutants transport (EMEP) and UV radiation (EDUCE). In 2003 he moves to the Azores and worked at Ponta Delgada Airport as a senior meteorologist and forecaster. Later in 2008 he was nominated Head of the Regional Delegation of the Portuguese Institute of Meteorology (IM) in the Azores. Currently, he is the Head of the Azores Regional Delegation of the Portuguese Sea and Atmosphere Institute (IPMA, former IM) that includes the weather forecast service for the Azores.
The extra tropical transition (ETT) of Hurricanes over the Atlantic is something that happens about 5 times a year and can severely disrupt the weather forecast.
The extra tropical transition (ETT) of Hurricanes over the Atlantic is something that happens about 5 times a year and can severely disrupt the weather forecast. In this CAL the important features of ETT are addressed and physical theories are presented. After each chapter several exercises allow you to test the theory.
This module will demonstrate the usefulness of the water vapour channels in forecasting.
Water vapour images have traditionally been used as additional information which tells about the air streams and water vapour content in the upper and middle levels of the troposphere.
Water vapour is a trace gas, that tells about the origin and kinematics of an airmass. In this respect water vapour images can reveal features that Infrared or Visible channel images are not capable of showing.
Since the introduction of RGB techniques in satellite products, water vapour information is been used more and more in these RGB combination images. Water vapour information is particularly important in Airmass and Severe Storms RGB products.