
Identify and interpret atmospheric phenomena
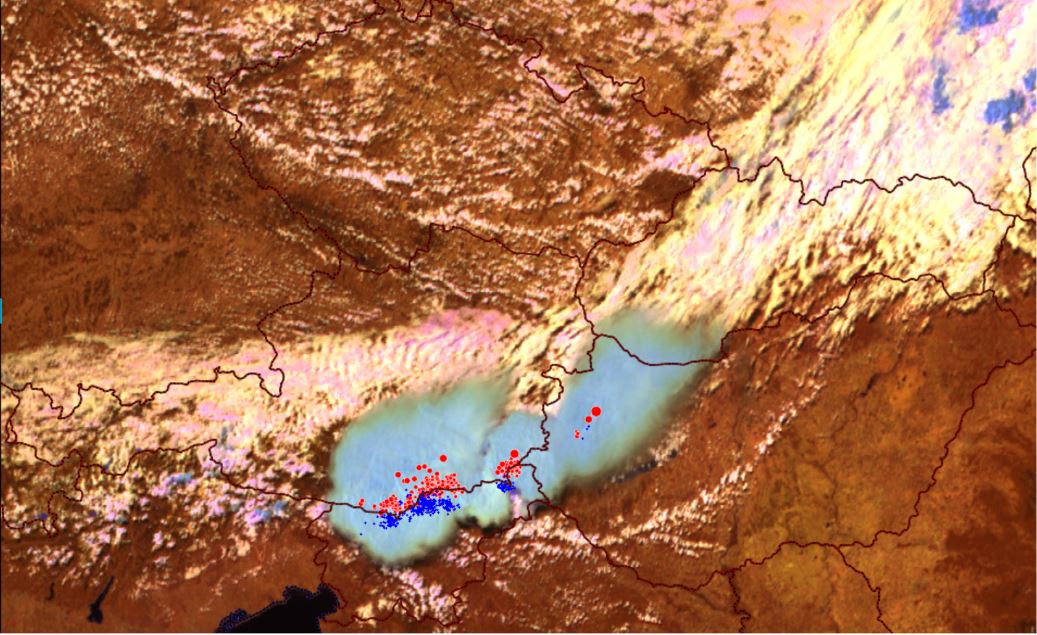
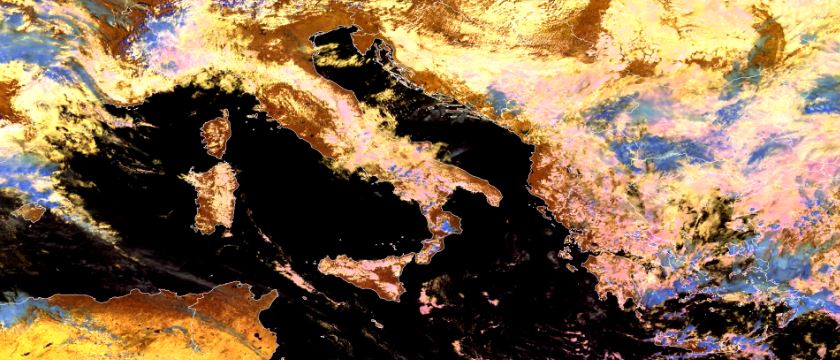
Maria Putsay discusses convective clouds that form over wildfires, focusing on Pyrocumulonimbus clouds and their detection in satellite imagery.
Pyrocumulonimbus (pyro-Cb) clouds can form above wildfires. These are fire-aided or fire-caused convective clouds with considerable vertical development. Large amounts of smoke particles are injected into these clouds. The increased number of condensation nuclei causes extremely small ice crystals on the cloud tops. That is why the typical colors of these clouds vary in several RGBs. The cloud top color may help to identify pyro-Cb clouds, which might be dangerous by causing extreme low-level winds, and hence increasing fire spread.
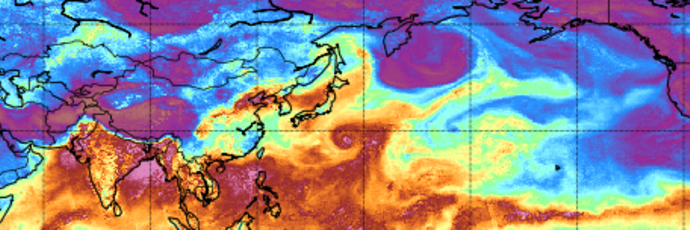
Have you ever wondered what an Atmospheric River is or how to recognize it in model or satellite data? The freshly released training module will assist you by guiding you step by step through the identification process.
First you will learn some basic facts on Atmospheric Rivers; how and where they are created, their typical characteristics and their appearance in satellite and model data. Step by step, you will then be guided through the identification process until you are certain that you are dealing with the phenomenon that is called an Atmospheric River.
Later stages of Atmospheric Rivers are sometimes tricky to identify as they are often merged with mid-latitude frontal systems. But here again, model fields and the timely evolution can give a precise answer whether there is an embedded AR or not.
And finally, it is well invested time going through this training module as ARs are responsible for many floods and heavy precipitation in Western Europe once they make a landfall.
The purpose of this Training Module is to provide step-by-step instructions for identifying Atmospheric Rivers.
This mini-module is part of a series of MTG mini modules produced by EUMETSAT/EUMeTrain with the aim of providing quick and useful learning experience about the new satellite products.
In this exercise you are giving forecast for a shipment route that could be affected by a convective event.
Enter the mini-module.
This mini-module is part of a series of MTG mini modules produced by EUMETSAT/EUMeTrain with the aim of providing quick and useful learning experience about the new satellite products.
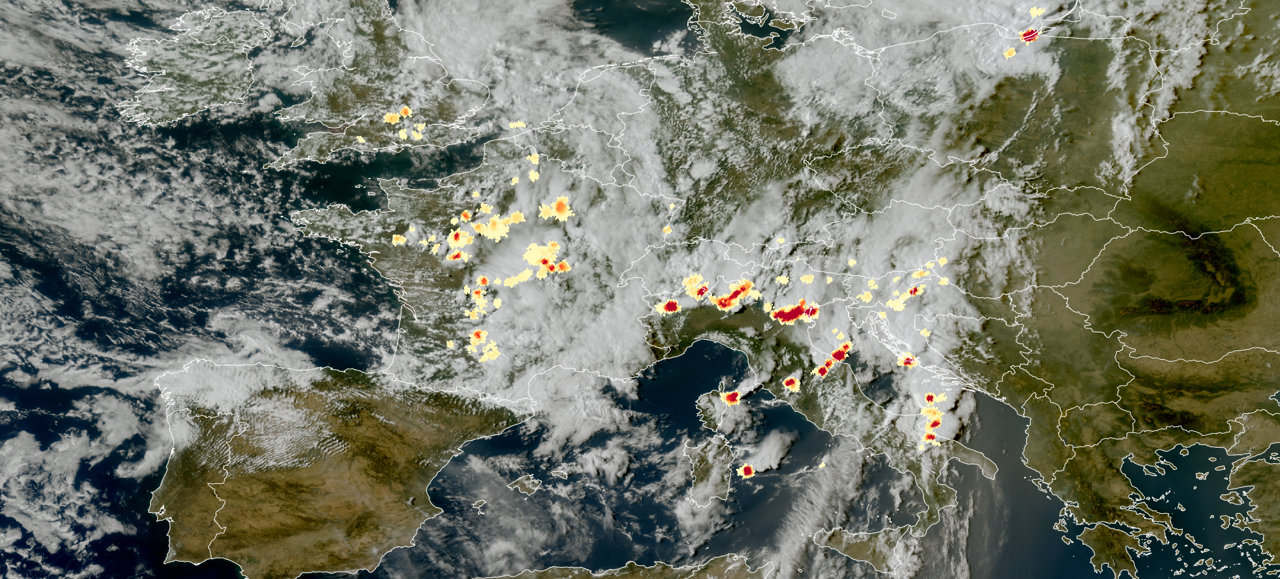
In this exercise you will learn how to use LI data together with ground based measurements.
Enter the mini-module.
This mini-module is part of a series of MTG mini modules produced by EUMETSAT/EUMeTrain with the aim of providing quick and useful learning experience about the new satellite products.
In this exercise you will learn how using MTG products can help you recognize convective initiation.
Enter the mini-module.
This mini-module is part of a series of MTG mini modules produced by EUMETSAT/EUMeTrain with the aim of providing quick and useful learning experience about the new satellite products.
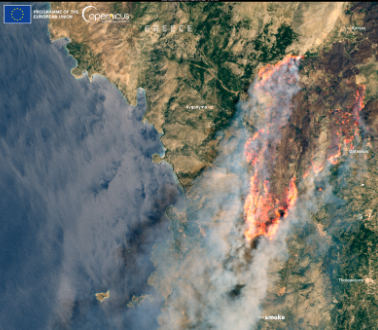
In this exercise you will learn about FCI ability to detect fires and how it compares to previous generation of satellite instruments.
Enter the mini-module.
This mini-module is part of a series of MTG mini modules produced by EUMETSAT/EUMeTrain with the aim of providing quick and useful learning experience about the new satellite products.
In this exercise you will learn about features in LI data as well as some limitations.
Enter the mini-module.
This training module shows the unique challenges that forecasters face when using satellite imagery in high latitude regions. Using a lot of examples and fun exercises, it compares different types of satellites (geostationary, polar) and different generations of satellites as well as benefits and drawbacks of each. It also explains different phenomena that occur in these high latitude regions due to viewing geometry and much more.

This resource was created in order for users to be able to access Weather Briefings page via resources search.
To access the Weather Briefings recordings, click here.
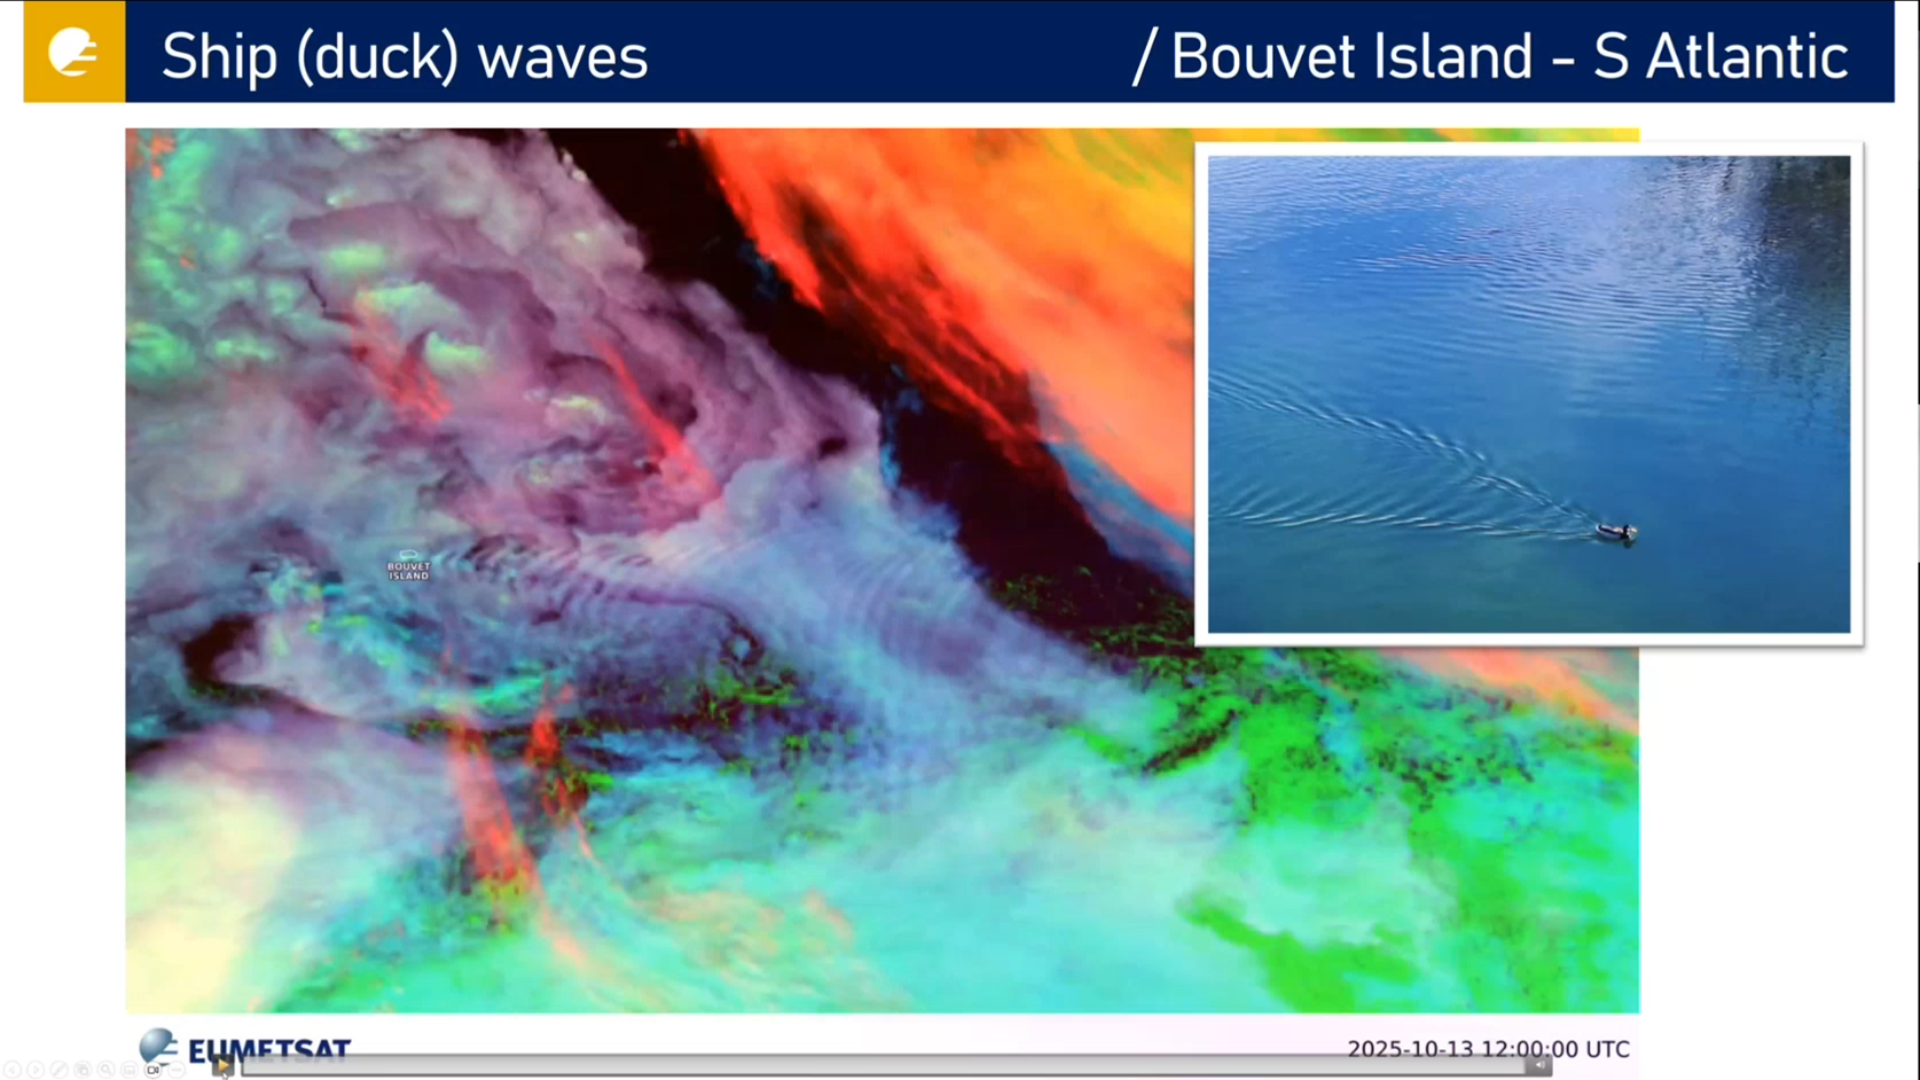
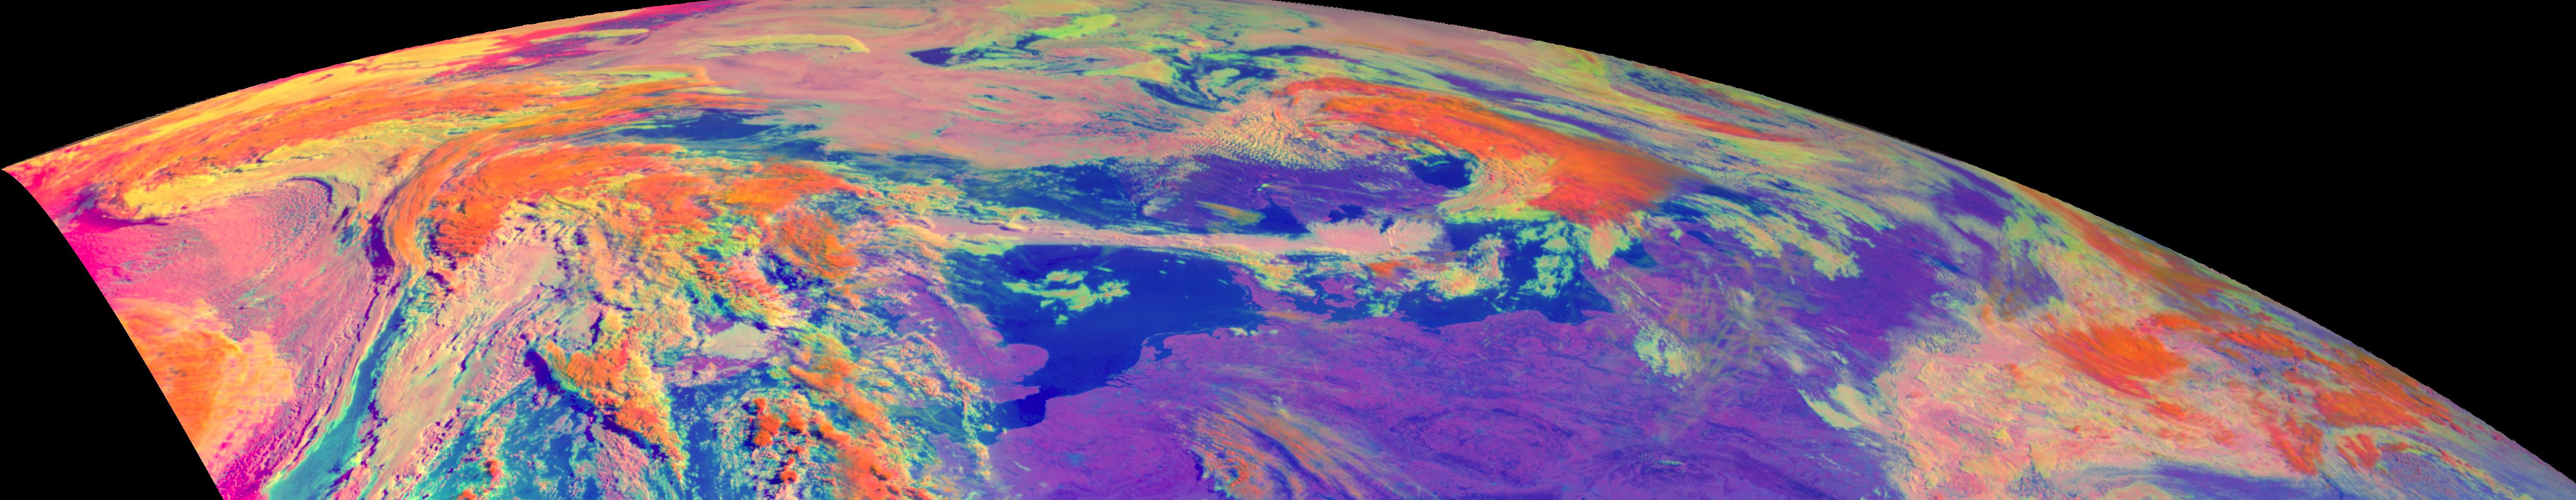
Ivan Smiljanic talks about turbulence and waves, showing many different examples.
Turbulence and waves in the atmosphere, like in other fluids, are signatures of usually dynamically strong processes that cause these disturbances. Also, they can be very dangerous on their own and can propagate to different parts of the atmosphere. Waves and turbulence behave differently in different fluids, and are seen differently with different spectral channels, thus not always easy to identify through satellite data. In this short lecture we will show you how these regular and irregular atmospheric motions are after all captured by advanced FCI instrument, and how that makes our everyday lives safer.
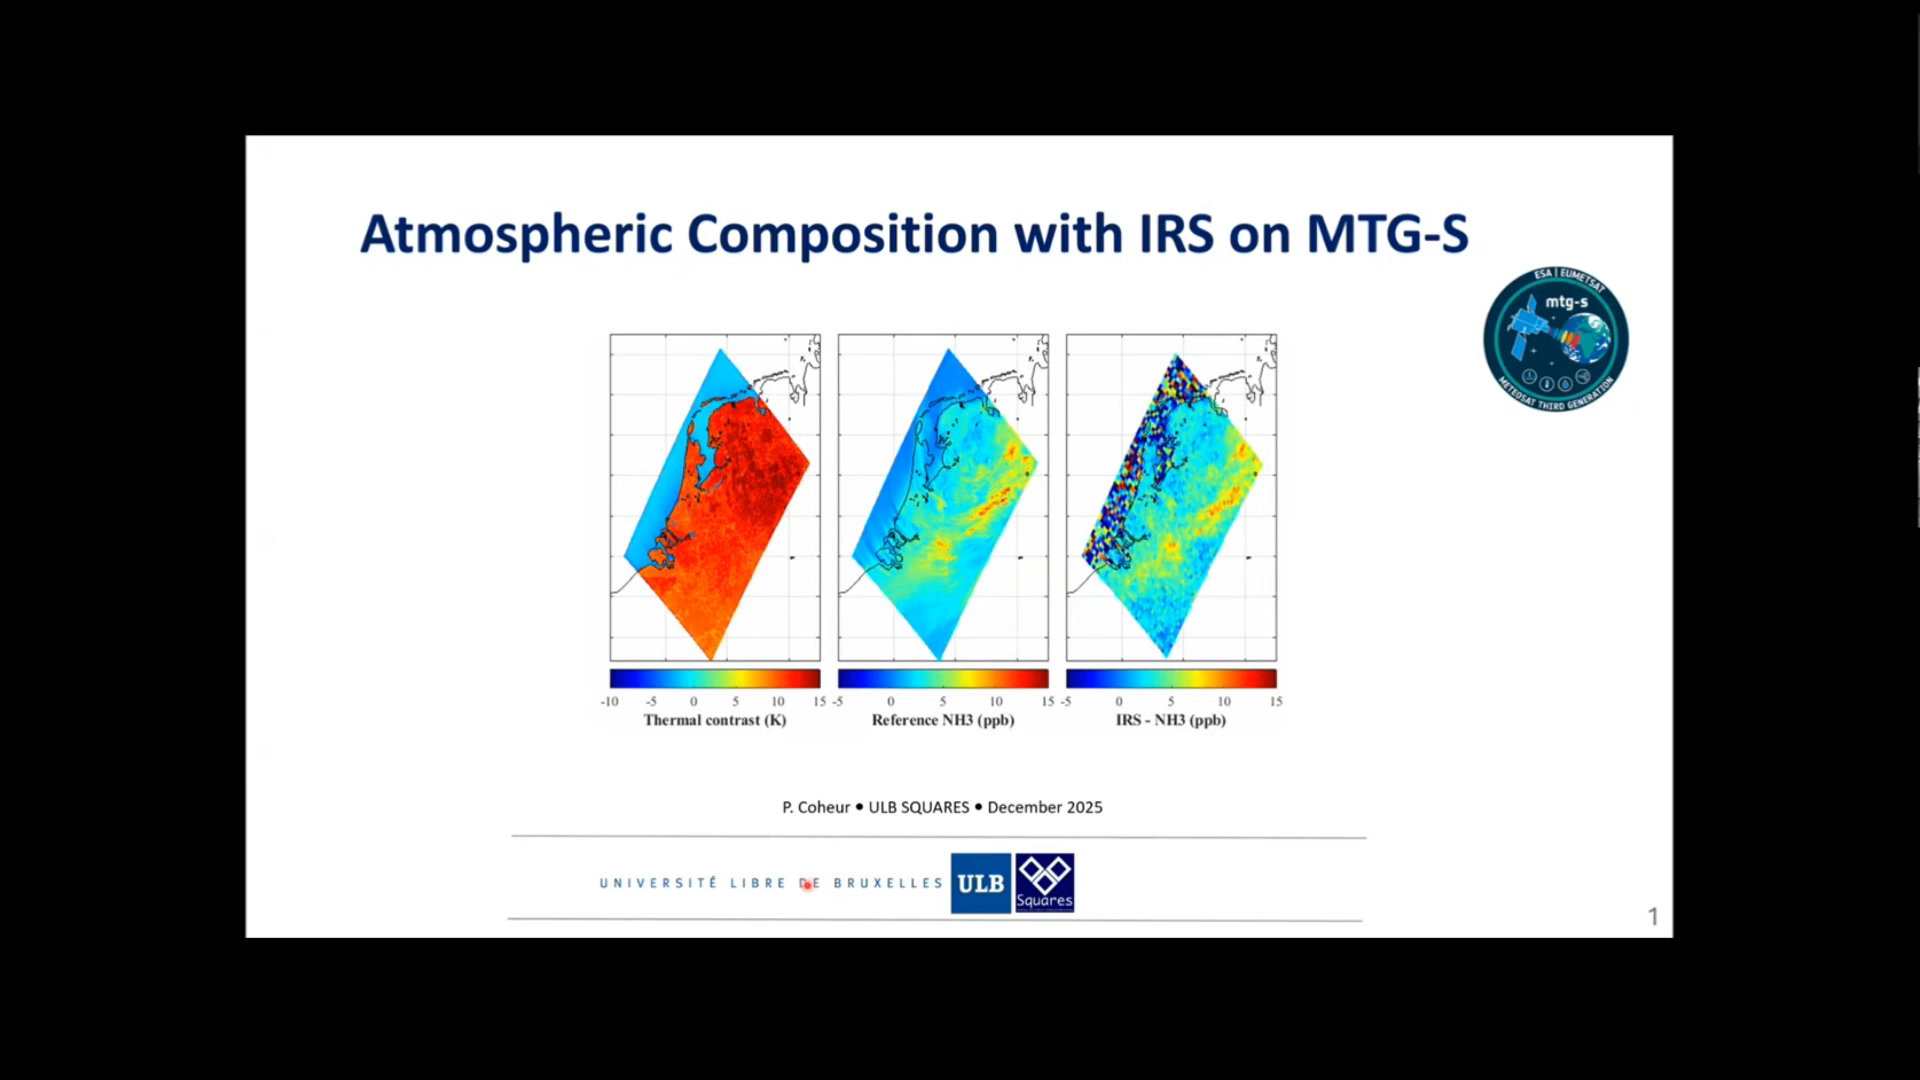
Pierre Coheur talks about the uses of IRS instrument for atmospheric composition.
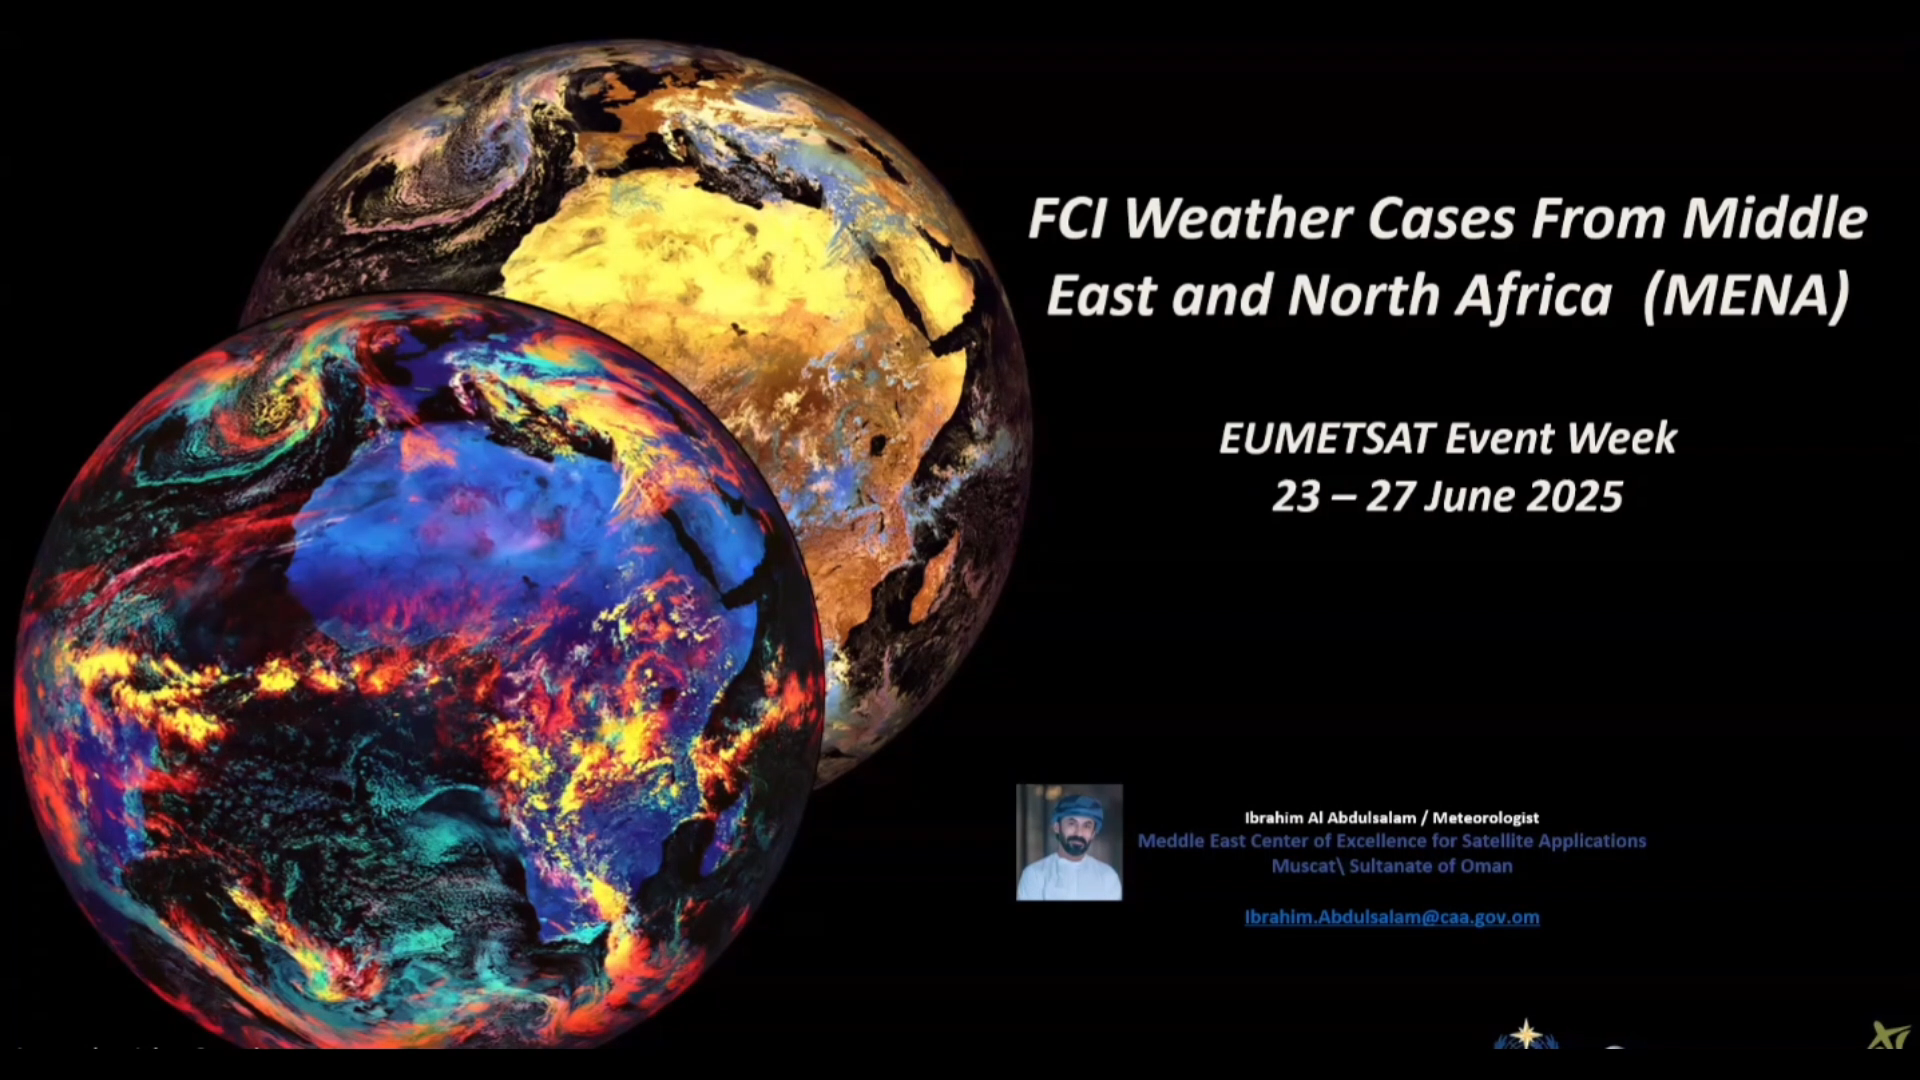
Ibrahim Mohammed Al-Abdul Salam shows a number of examples of MTG FCI Imagery during various weather situations over the Middle East and North Africa (MENA) region.
This presentation highlights early applications of Meteosat Third Generation (MTG) data across the Middle East and North Africa (MENA) region. Using regional case studies, it demonstrates how MTG supports the monitoring of convection, dust storms, fog, tropical cyclones, fires, and other key atmospheric features. The talk explores operational benefits, practical challenges, and the regional relevance of MTG products—while also recognizing the continued value of Meteosat Second Generation (MSG) data and its important role alongside MTG.