
Aviation
Listed here are other resources related to Aviation tag:
Note: click on an image to open the Resource
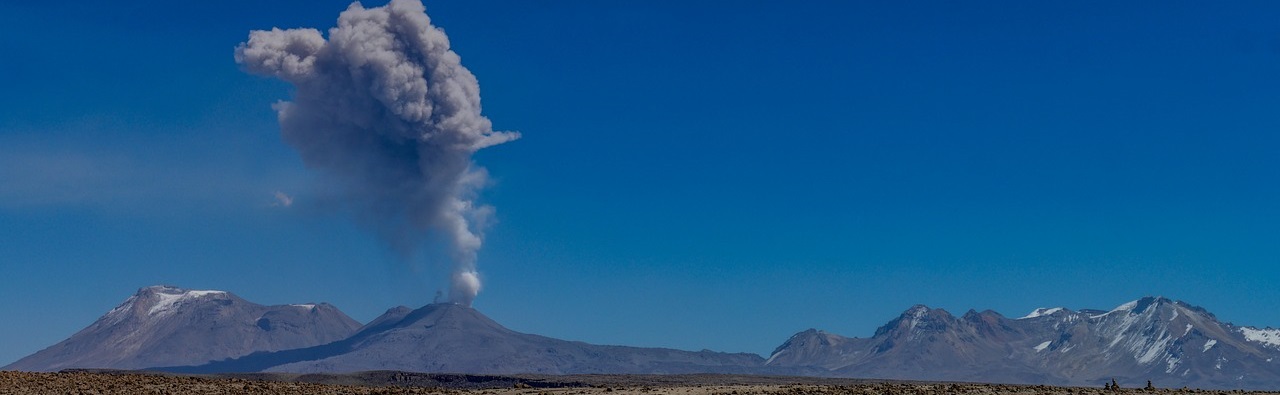
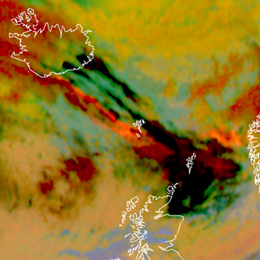
Training module focusing on identification of volcanic ash and sulfur dioxide plumes from satellite imagery.
Volcanic eruptions have a severe impact on human health, economy and traffic. They regularly cause natural disasters such as tsunamis and lava flows that are difficult to predict. Volcanic eruptions emit large amounts of gases, ash, and other aerosol particles into the atmosphere. In the short term, volcanic ash plumes have serious impacts on aviation. It is, therefore, very important to monitor the extent, height and duration of such events to properly estimate the impact of eruptions at various spatial and temporal scales, using data from different instruments on different satellites.
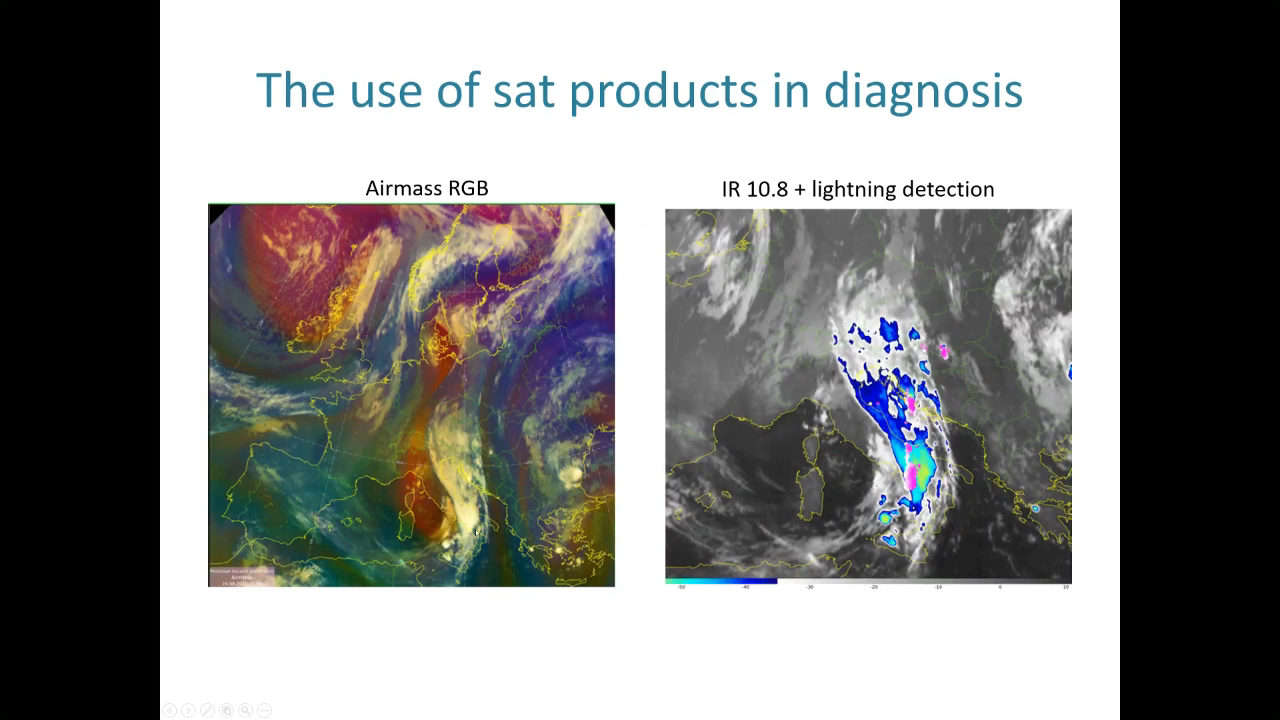
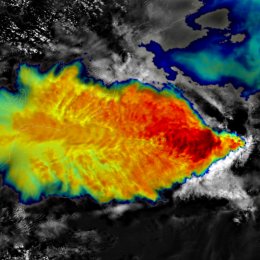
Vinko Šoljan talks about forecasting and nowcasting of deep moist convection, satellite products used, NWP outputs and more.
In this presentation, we will demonstrate the process of forecasting deep moist convection (DMC) at Croatia Control and how satellite products are utilized in this process. This includes large-scale analysis and diagnosis using satellite data, as well as monitoring and nowcasting existing DMC using satellite products and radar data. In DMC forecast we primarily rely on the ingredients-based methodology and NWP guidance.
Marco Stoll shows the importance of mountain waves in aviation forecasting.
Meteorological information is crucial for flight safety and efficiency. Mountain waves are an example of a potentially hazardous phenomenon for aviation that meteorological watch offices need to monitor and forecast. The typical appearance of the phenomenon in satellite imagery is illustrated, thereby making use of various MSG channels and RGB products. The difficult task of quantifying vertical speeds and estimating the degree of turbulence associated with breaking waves is discussed with the aid of NWP cross sections.
Identify and locate features indicating regions of possible turbulence.
This module teaches you how to use satellite data to observe and analyze atmospheric phenomena. It will show you which products can be used to identify dust storms, smoke, fires, precipitation, etc.
To access the resource click here.
Note: all resources are provided as an external link which redirects you to https://eumetcal.eu where you will need to create a user account in order to gain access to the course
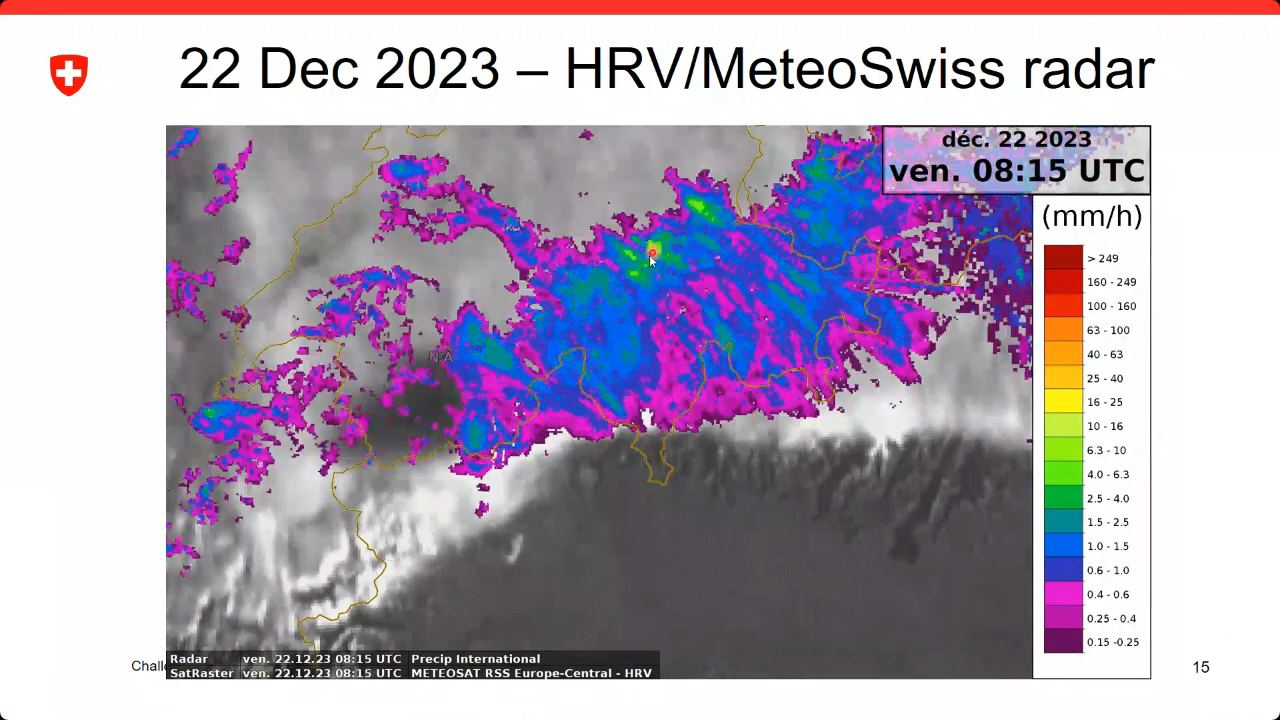
Johannes Häkkinen presents forecasting different precipitation types and using satellites together with weather models in aviation.
The presentation will go through different precipitation types, forecasting the precipitation types, and supporting the weather model with satellite images. The precipitation types are estimated from a model sounding by top-down method. Satellite imagery is mainly used for estimation of the cloud top. The focus is on aviation weather and short-term forecasts.
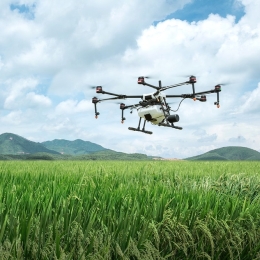
Norman Wildmann presents a wind measurement technique based on the use of UAS, a.k.a. drones.
Exchange and transport processes in the ABL are driven by turbulence on a wide range of scales. Their adequate parameterization in numerical models is essential. In heterogenous and complex terrain, the common simplification of turbulence to statistical models does not necessarily hold. Coherent structures such as convective cells, gusts, slope and valley flows, but also turbulence in cities or behind wind turbines are features which are not well represented in models. A reason for the lack of understanding is the challenge to adequately sample their spatio-temporal structure. Small unmanned aerial systems (UAS, a.k.a. drones) are increasingly used to measure meteorological quantities, including the three-dimensional wind vector in the ABL. In this talk, methods and results will be shown how UAS, either fixed-wing or rotary-wing, can be used to obtain in-situ measurements and thus help to understand complex flows.

Ab Maas talks about the challenges that wind presents in ballooning.
Although balloons were by far the first manned aircrafts in the sky their economic and military importance stayed marginal.
The main reason for that is the difficulty of steering a balloon. Balloons go with the wind flow and the only way to steer a balloon is to find different wind directions at different heights. Therefore, wind and wind forecasts are of utmost importance for sport- and commercial ballooning.
Sandwich products help to detect and analyse various cloud top features of storms (storm systems) in their mature phase.
This training module describes the Sandwich Products. These products help to detect and analyse various cloud top features of storms (storm systems) in their mature phase. It eases the detection of specific cloud-top features related to storm dynamics and microphysics, structure, and possible storm severity - such as overshooting tops, cold-U/V (enhanced-V) or cold-ring features, embedded warm spots/areas, gravity waves, above-anvil ice plumes, areas composed of very small ice particles, etc. These products directly support monitoring and nowcasting of convective storms. In areas with no, or poor, weather radar and surface observation coverage, this product is essential for proper storm detection.
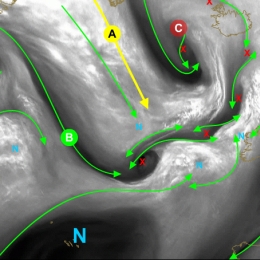
This module takes a closer look at vorticity maxima and minima signatures in satellite imagery.
Vorticity patterns control the circulation of air masses in their vicinity. By doing this they control the location of important meteorological quantities that are essential for an accurate diagnosis and forecast of the atmosphere.
The scale of vorticity patterns in the atmosphere ranges from large-scale synoptic system circulations (low and high pressure centres) to smaller meso-scale circulations (water vapour vortices (sometimes referred as WV eddies or WV eyes). The (anti-)cyclonic rotation in the atmosphere caused by a vorticity maxima is easily seen in satellite imagery. And quite naturally, satellite imagery is the key tool to correctly locate the maximum of cyclonic and anticyclonic vorticity in the atmosphere. Moreover, satellite images are able to show the small-scale vorticity patterns that are easily overlooked and smoothed out by a NWP model.
This training module has been developed to teach you to identify these vorticity centres in Meteosat Second Generation (MSG) satellite imagery. In addition the module will provide you with a firm physical background to help you understand why it is important to do a good diagnosis of satellite images and also provide you with a range of examples and exercises to demonstrate the impact a vorticity centre may have on your weather forecast.
This module provides a guideline on how to assess the threat of volcanic ash. Therefore several tools based on satellite data can be consulted. Prominent examples are the Ash RGB or the use of IASI data.
Extreme weather conditions such the presence of volcanic ash can put aircraft navigation into major difficulties. If an aircraft encounters volcanic ash the navigation gets extremely challenging. Between 1975 and 1994 more than 80 jet airplanes were damaged due to unplanned encounters with clouds of volcanic ash. Seven of these encounters caused in-flight loss of jet engine power, putting the passengers lives at severe risk. Therefore the correct assessment of the weather conditions is essential to ensure save flight conditions. This training module is dedicated to forecasters/aviation forecasters. The main intention is to provide a guideline on how to assess the potential of hazardous weather events such as volcanic ash. For this purpose several tools based on satellite data can be consulted.
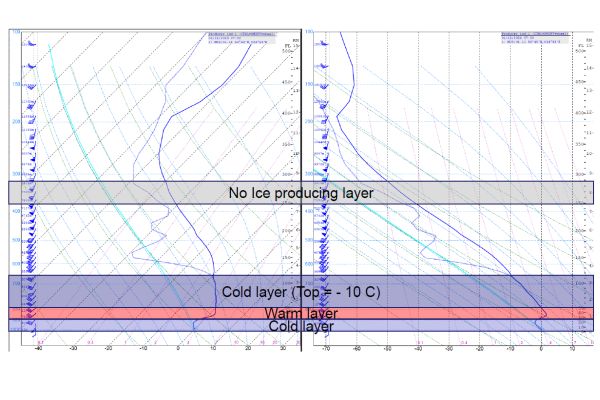
Icing still represents a major threat to aviation. This CAL module focuses on the occurrence of icing in stratiform clouds. A method to detect icing probability from satellite images in combination with radar and radiosonde data is presented.
Ice formation on wings and inside of the jet engine of planes causes around 15% of weather related aircraft accidents. Most icing occurs inside cumulonimbus clouds when supercooled droplets freeze with contact of the aircraft body. But also in stratiform clouds icing represents a major threat to aircrafts during landing and take-off phase. In this CAL module, icing hazards related to stratiform clouds are examined. The introductory chapter focuses on the different types of icing and the physical principles leading to ice formation on aircrafts. Satellite products from geostationary and polar orbiting satellites help differentiating between ice and water clouds. A sample of satellite images and products illustrate this capability. Additional data sources like radiosoundings and radar imagery are useful completions to the satellite data. Interpretation of radiosoundings in view of icing occurrence is the main topic of chapter 4. The usefulness of radar data for detecting ice clouds is demonstrated. Three case studies complement the theoretical part of the training module, showing typical weather situations where severe icing represented a serious threat to aircrafts in the past. These case studies combine the above mentioned data sources in the frame of a practical situation. The CAL module finishes on a suggested procedure for nowcasting icing from stratiform clouds. Exercises offering the possibility to test the acquired knowledge form the end of this module.
Jean Marc Moisselin presents methods to detect IWC from satellite data.
Length: 45 min
Author: Jean-Marc Moisselin (Météo-France)
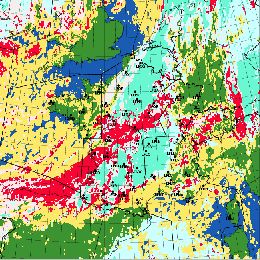
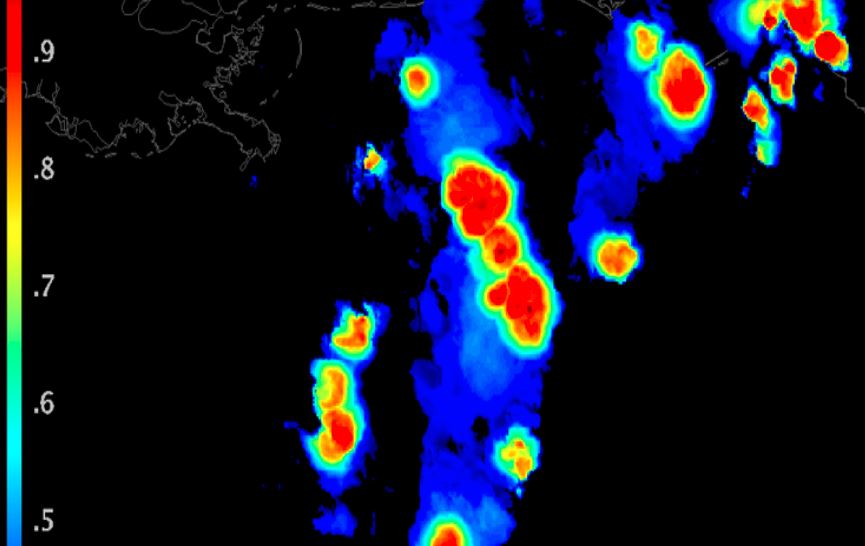
Large amount of ice particle may cause erroneous aircraft probe measurement and damage aircraft engines. The ice crystals are generally located near cores of deep convection and associated cirrus anvils, at high altitude and in tropical areas. The understanding of the phenomena and its forecast are a key issue for aviation. There are several methods to detect clouds associated with ice crystal icing: MSG-CPP High IWC Mask, DARDAR, PHIWC, Alpha, RDT(detects and tracks convective systems).
A series of fields experiment in tropical regions have been conducted separately or conjointly by HAIC and HIWC projects. During HAIC campaigns, RDT has been provided on an operational basis through dedicated MétéoFrance processing chains. Qualitative and quantitative studies provided reasonably good results, especially in terms of probability of detection.
A new day-time attribute (adapted from MSG-CPP High IWC Mask algorithm) has been implemented in RDT v2016. Now RDT is produced globally by using five geostationary satellites, which in turn increased operational applications. New generation of satellites and the feedback on products performance will help to improve retrieval of the hazard and to define future research fields.