
Understand NWP outputs
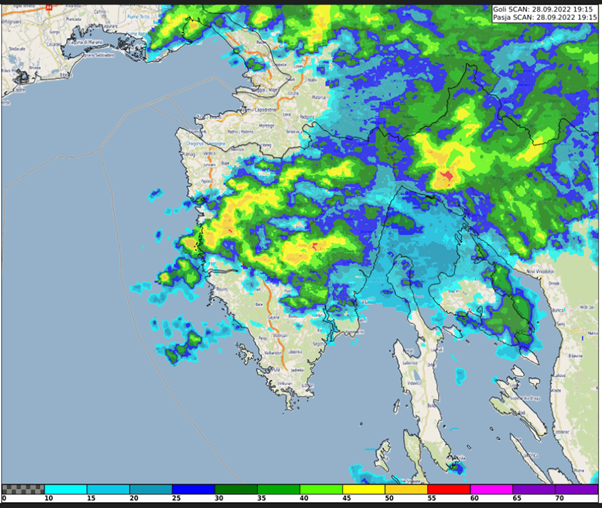
Case study about the extreme precipitation event in Rijeka, Croatia on 28 September 2022. The study focuses on the special case of convective development that caused the severe event.
This study accompanies the simulator.
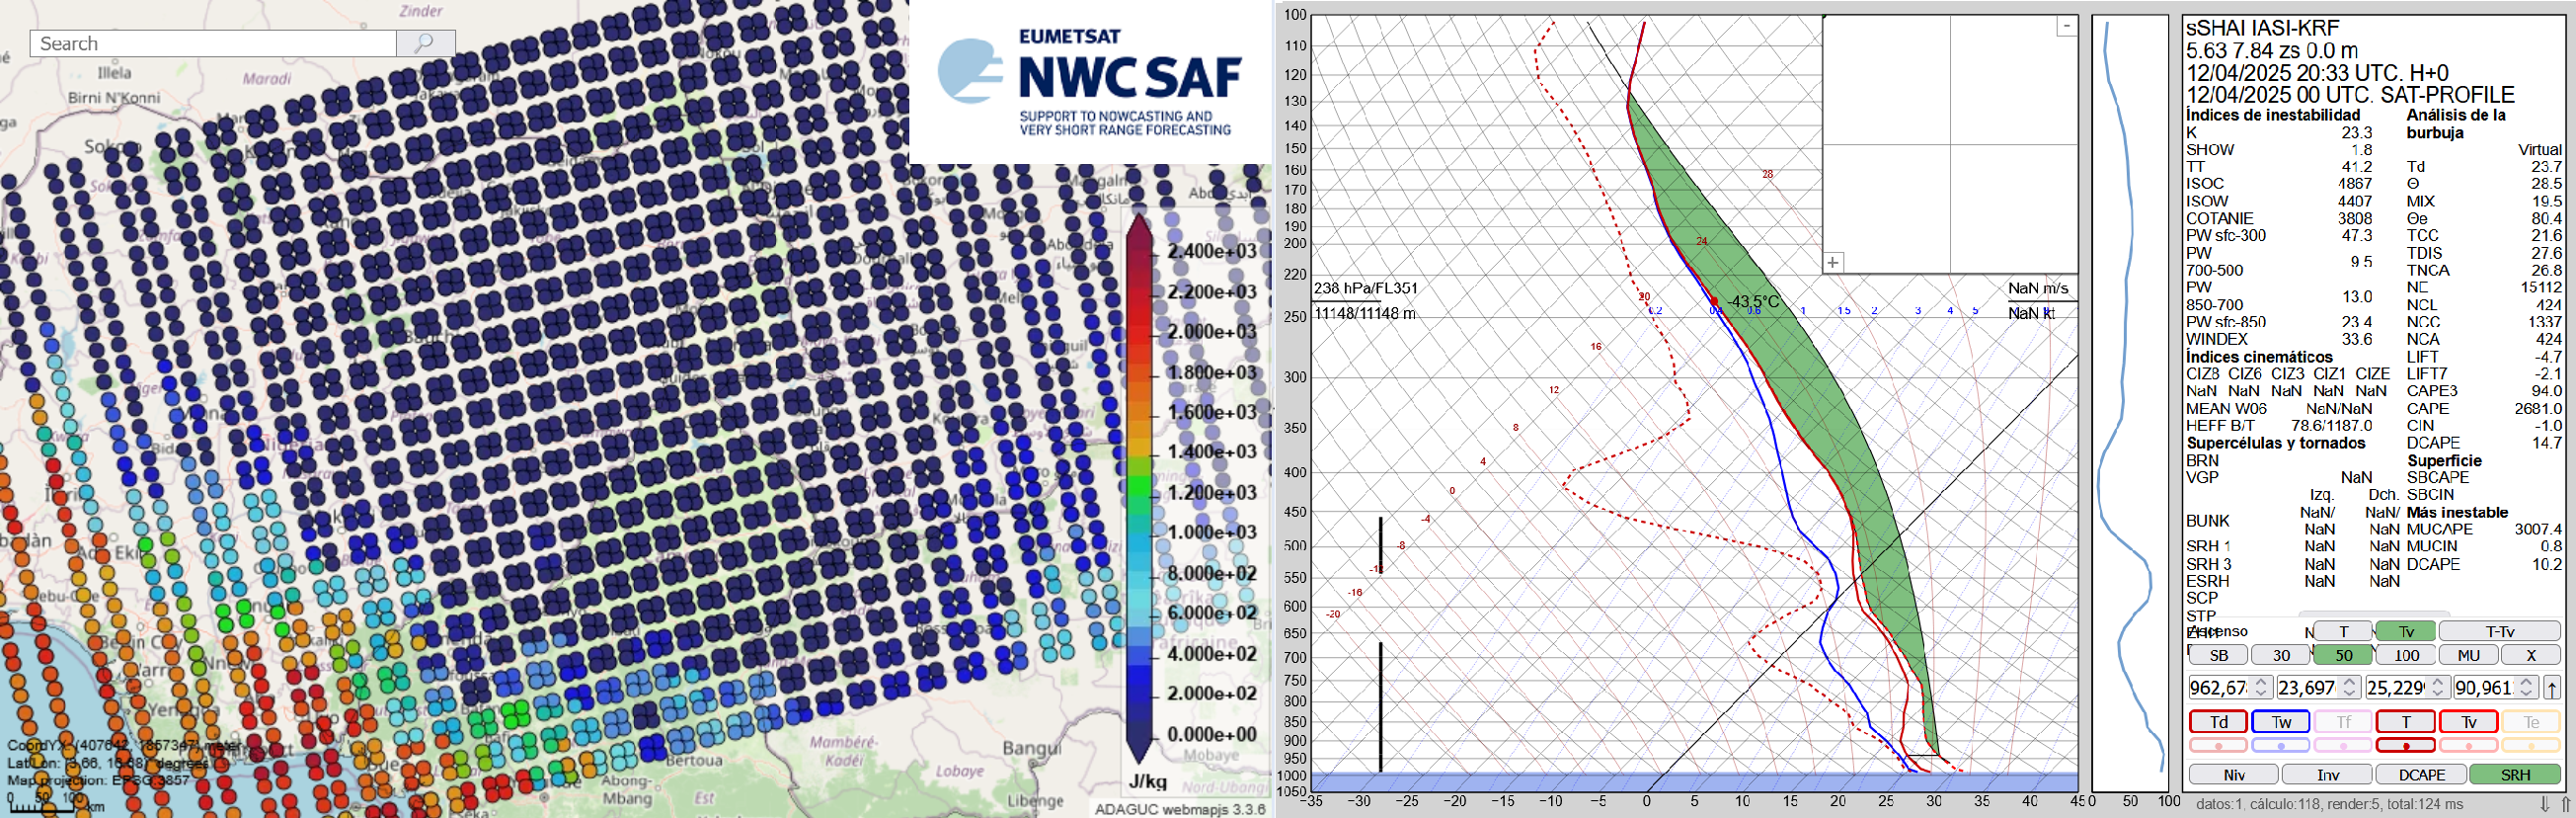
The Nowcasting SAF is planning a new software package dedicated to the new geostationary MTG-S Infrared Sounder instrument (IRS). This new software package will generate Satellite Humidity And Instability products (sSHAI) that will be key in Nowcasting using the IRS instrument. It will also deliver services to make the best use of MTG-IRS channels and combine its virtues with those of the MTG imager FCI.
In this Workshop you will learn about these revolutionary product and services. You will also have a taste of what will come in a few months with MTG-IRS by using in real world applications the prototype product obtained from the polar orbiting IASI instrument.
The Workshop is comprised of 4 presentations:
Part 1. X. Calbet (AEMET) - Introduction GEO-S
Part 2. N. Peinado-Galán (AEMET) - sSHAI prototype
Part 3. N. Peinado-Galán (AEMET) and X. Calbet (AEMET) - Practical cases with course attendants using SHAI on the EWC
Part 4. Miguel-Ángel Martínez (AEMET) - Other services from the GEO-S package: quickIRS, sSHAI_ES and Remapping tool
Vinko Šoljan talks about forecasting and nowcasting of deep moist convection, satellite products used, NWP outputs and more.
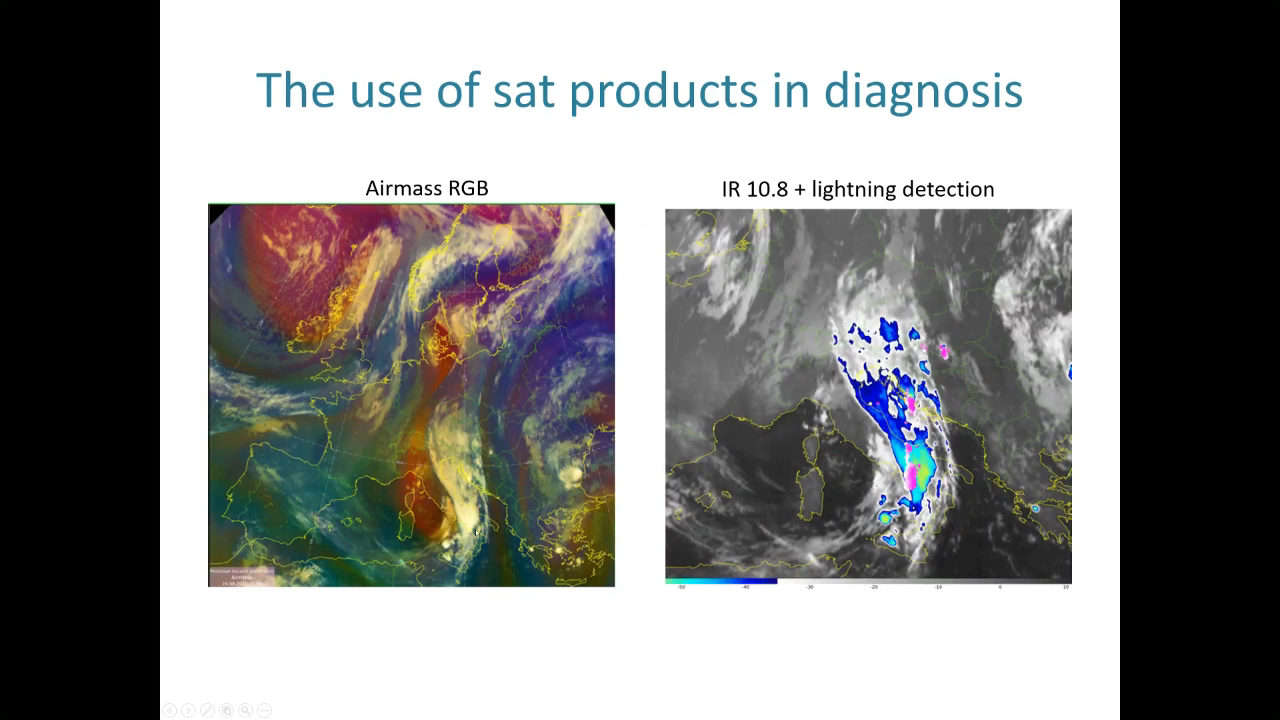
In this presentation, we will demonstrate the process of forecasting deep moist convection (DMC) at Croatia Control and how satellite products are utilized in this process. This includes large-scale analysis and diagnosis using satellite data, as well as monitoring and nowcasting existing DMC using satellite products and radar data. In DMC forecast we primarily rely on the ingredients-based methodology and NWP guidance.
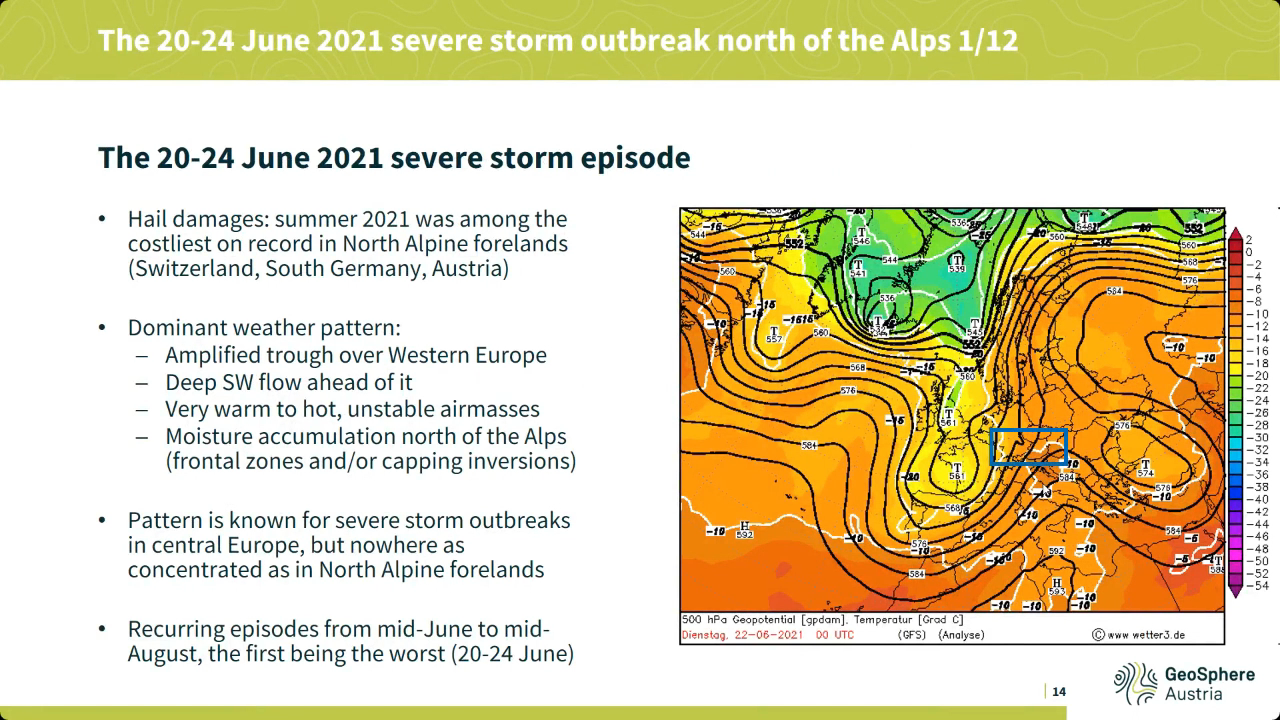
Georg Pistotnik covers the topic of drylines, shows it's relevance in severe weather development.
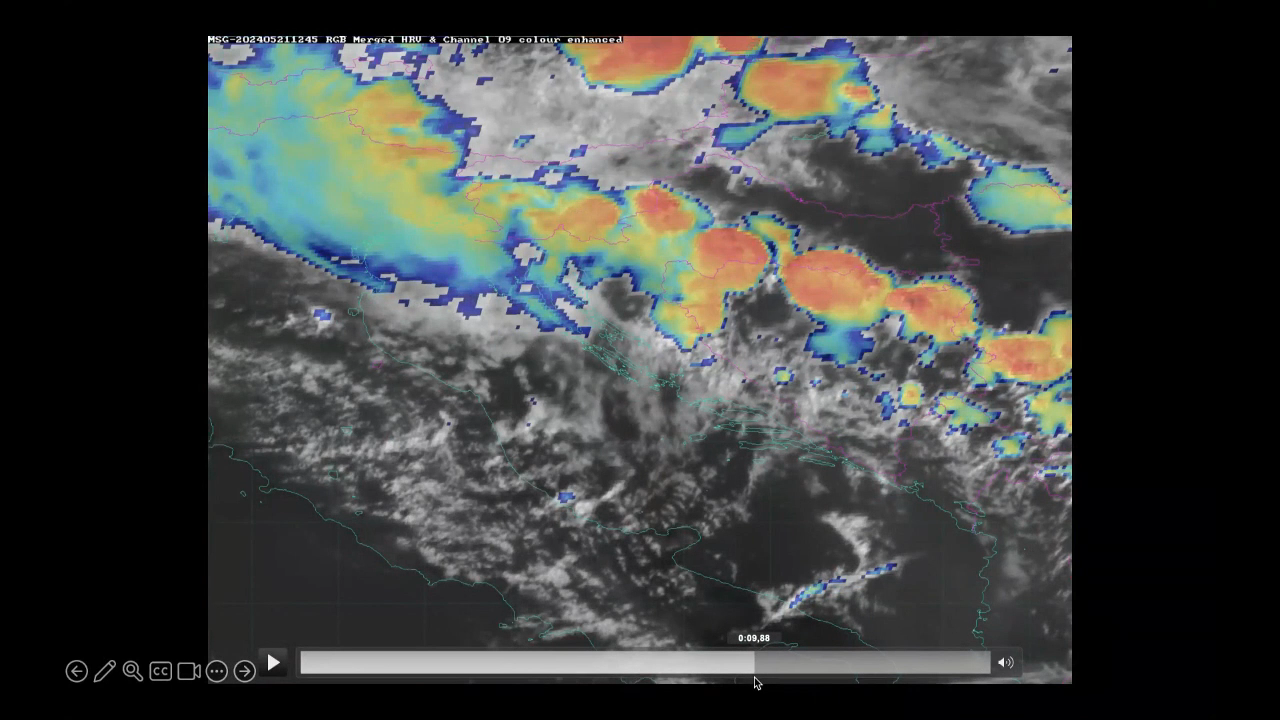
Drylines are boundaries separating warmer and drier from cooler and moister air, usually resulting from differential diurnal heating and therefore vertical mixing. The most common and distinct dryline in the Alpine region is the boundary between Foehn winds (dynamically driven) and upvalley/upslope circulations (thermally driven). Thunderstorms often form along drylines and intensify when they move onto their moist side, where CAPE and vertical wind shear are systematically enhanced and favor convective organization. This presentation highlights how station and readiosonde data, high-resolution satellite imagery and even webcam images can be integrated into the nowcasting of drylines and resulting thunderstorms, using some prominent cases of the past few years in the eastern Alpine region.
Lecture slides
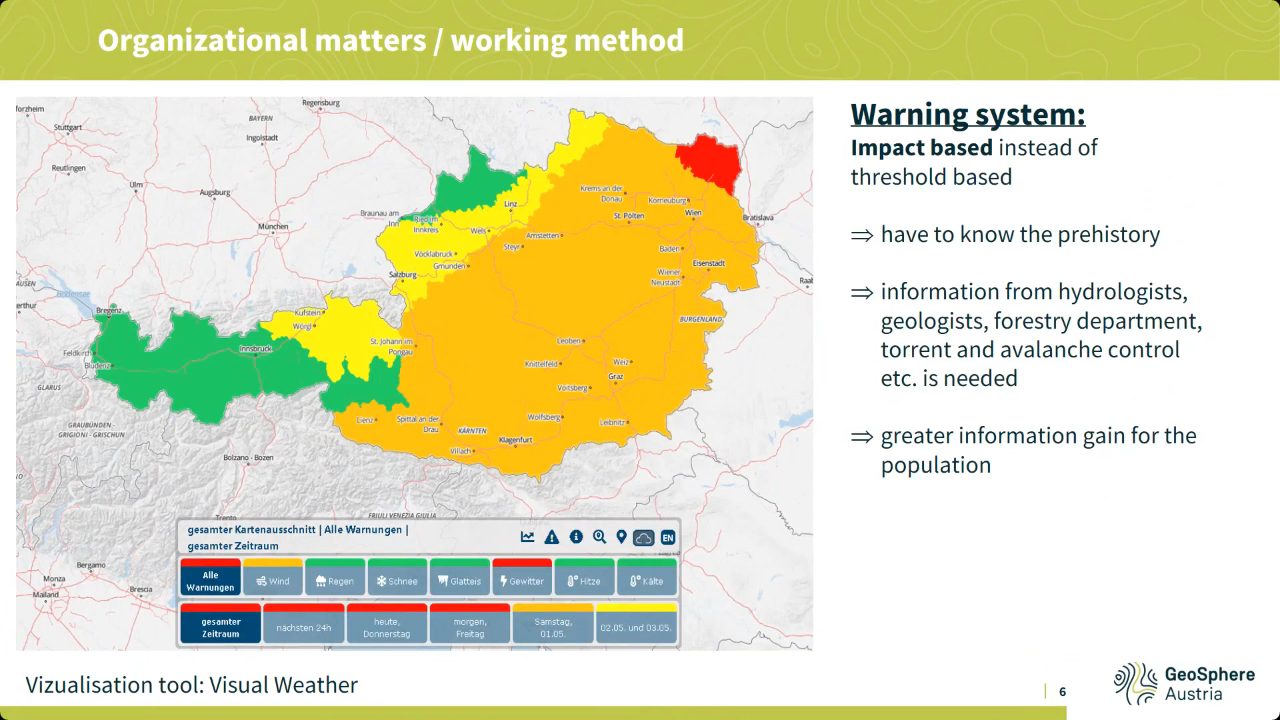
Liliane Hofer speaks about prognostic service of Austria, work organization, regional weather forecast specifics such as southerly föhn winds and others.
Various phenomena, some of which are regionally specific, such as southerly föhn winds or precipitation in northern or southern congestion, make the weather forecast in Austria very challenging at times. In addition, the topographically highly structured landscape also results in quite small-scale differences, for example in inversion weather conditions. All this and special customer products are highlighted in this presentation, as well as the basic working environment of the forecasters and, of course, the satellite products used for this purpose.
Lecture slides
Katarina Katušić talks about Croatian Met Service work principles and schedules, case study and satellite products used during operational shift work.
The Weather and Marine Analysis and Forecasting Sector is a part of the Croatian Meteorological and Hydrological Service (DHMZ), and it is in charge of weather forecasts and warnings for the public and numerous companies. Over the years, we have gone through many challenges. Quite recently, during the lockdown, the earthquake severely damaged our headquarters, and even with those difficulties the work did not stop. We also prepare and present weather forecasts for national television. Furthermore, this presentation will cover the usage of weather satellite products in daily operational work.
Lecture slides
Marco Stoll shows the importance of mountain waves in aviation forecasting.
Meteorological information is crucial for flight safety and efficiency. Mountain waves are an example of a potentially hazardous phenomenon for aviation that meteorological watch offices need to monitor and forecast. The typical appearance of the phenomenon in satellite imagery is illustrated, thereby making use of various MSG channels and RGB products. The difficult task of quantifying vertical speeds and estimating the degree of turbulence associated with breaking waves is discussed with the aid of NWP cross sections.
Case Study of the pre-convective environment of 19th May 2021 using IASI sounder data.
This Case Study of the pre-convective environment of 19th May 2021 using IASI sounder data focuses on exploring how the use of IASI retrievals added additional value to the forecast of the incoming storm over Hungary.
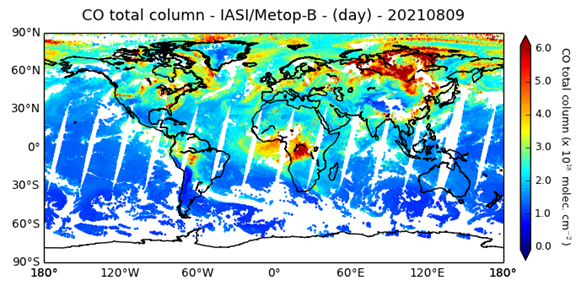
In this air quality module, you will learn to respond better to air pollution and Sahara dust events, by learning which resources to use for these events.
Atmospheric composition can be observed using various instruments (satellite and ground-based) and can be analysed and forecasted using numerical models. This training module provides an overview of available online resources that can be used to assess an air pollution or a Sahara dust event. An air pollution event is defined as a time during which the concentration of atmospheric pollutants exceeds air quality standards. In southern Europe, these also include Sahara dust events, which occur mostly in spring and summer, when south-westerly flow transports desert dust from the areas south of the Atlas Mountain range.
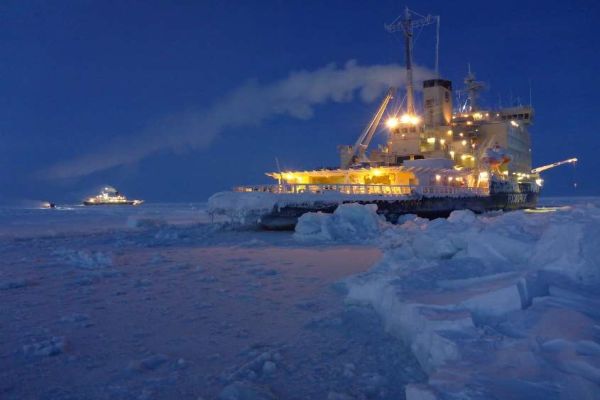
Robert Hausen describes his journey in the Arctic during the MOSAIC project.
The presentation is about the Multidisciplinary drifting Observatory for the Study of Arctic Climate (MOSAiC) from a forecaster’s perspective. As kind of an experience report this talk gives some impressions from the preparation before the expedition started up to the uncertain outcome of Leg 3 of 6 due to the Corona Crisis and other circumstances.

Vojtěch Bližňák presents how the satellite cloud data helps forecasting road surface temperature in Czechia.
The goal of the contribution is to assess an impact of extrapolated cloud cover derived from satellite observations on forecasts of road surface temperature (RST) performed by the road weather model (RWM) FORTE. Based on road weather station measurements and forecasts of the ALADIN numerical weather prediction (NWP) model, which are used as inputs to prepare initial and boundary conditions, the RWM generates a linearly continuous forecast of RST on selected Czech highways. The work will compare the evaluation of RST forecasts generated by two model runs using NWP and satellite-derived cloud cover estimation.
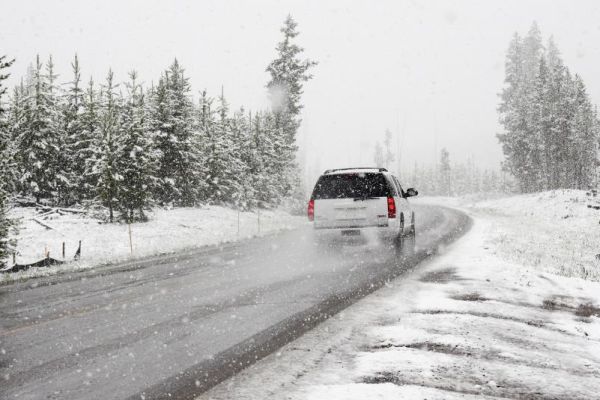
Virve Karsisto shows the road model FMI uses to forecast road conditions.
Finnish Meteorological Institute’s (FMI) road weather model has been in operational use over 20 years. The forecasts help in the road maintenance decision making and give useful information for road users about the driving conditions. Recently, a shadowing algorithm has been implemented to the model to take in to account the shadowing caused by the surrounding objects. This helps to make more localized forecasts, as shadowing can cause great differences in road temperature even between different lanes.