
Climate services
Listed here are other resources related to Climate services tag:
Note: click on an image to open the Resource
Gwenaël LE BRAS shows what MTG means in context of SST monitoring.
The MTG-I1 launch introduced the Flexible Combined Imager (FCI), boosting spatial and temporal resolution for Sea Surface Temperature (SST) retrievals. OSI SAF focused first on maintaining service continuity by developing a new Level 3 product matching current MSG resolutions. Higher input resolution from FCI enhances product quality, especially through improved cloud masking. Research is also underway to create a new high-resolution SST product leveraging FCI’s advanced capabilities. The MTG-S1 recent launch will further expand SST coverage, with the processing of the new InfraRed Sounder (IRS) data.
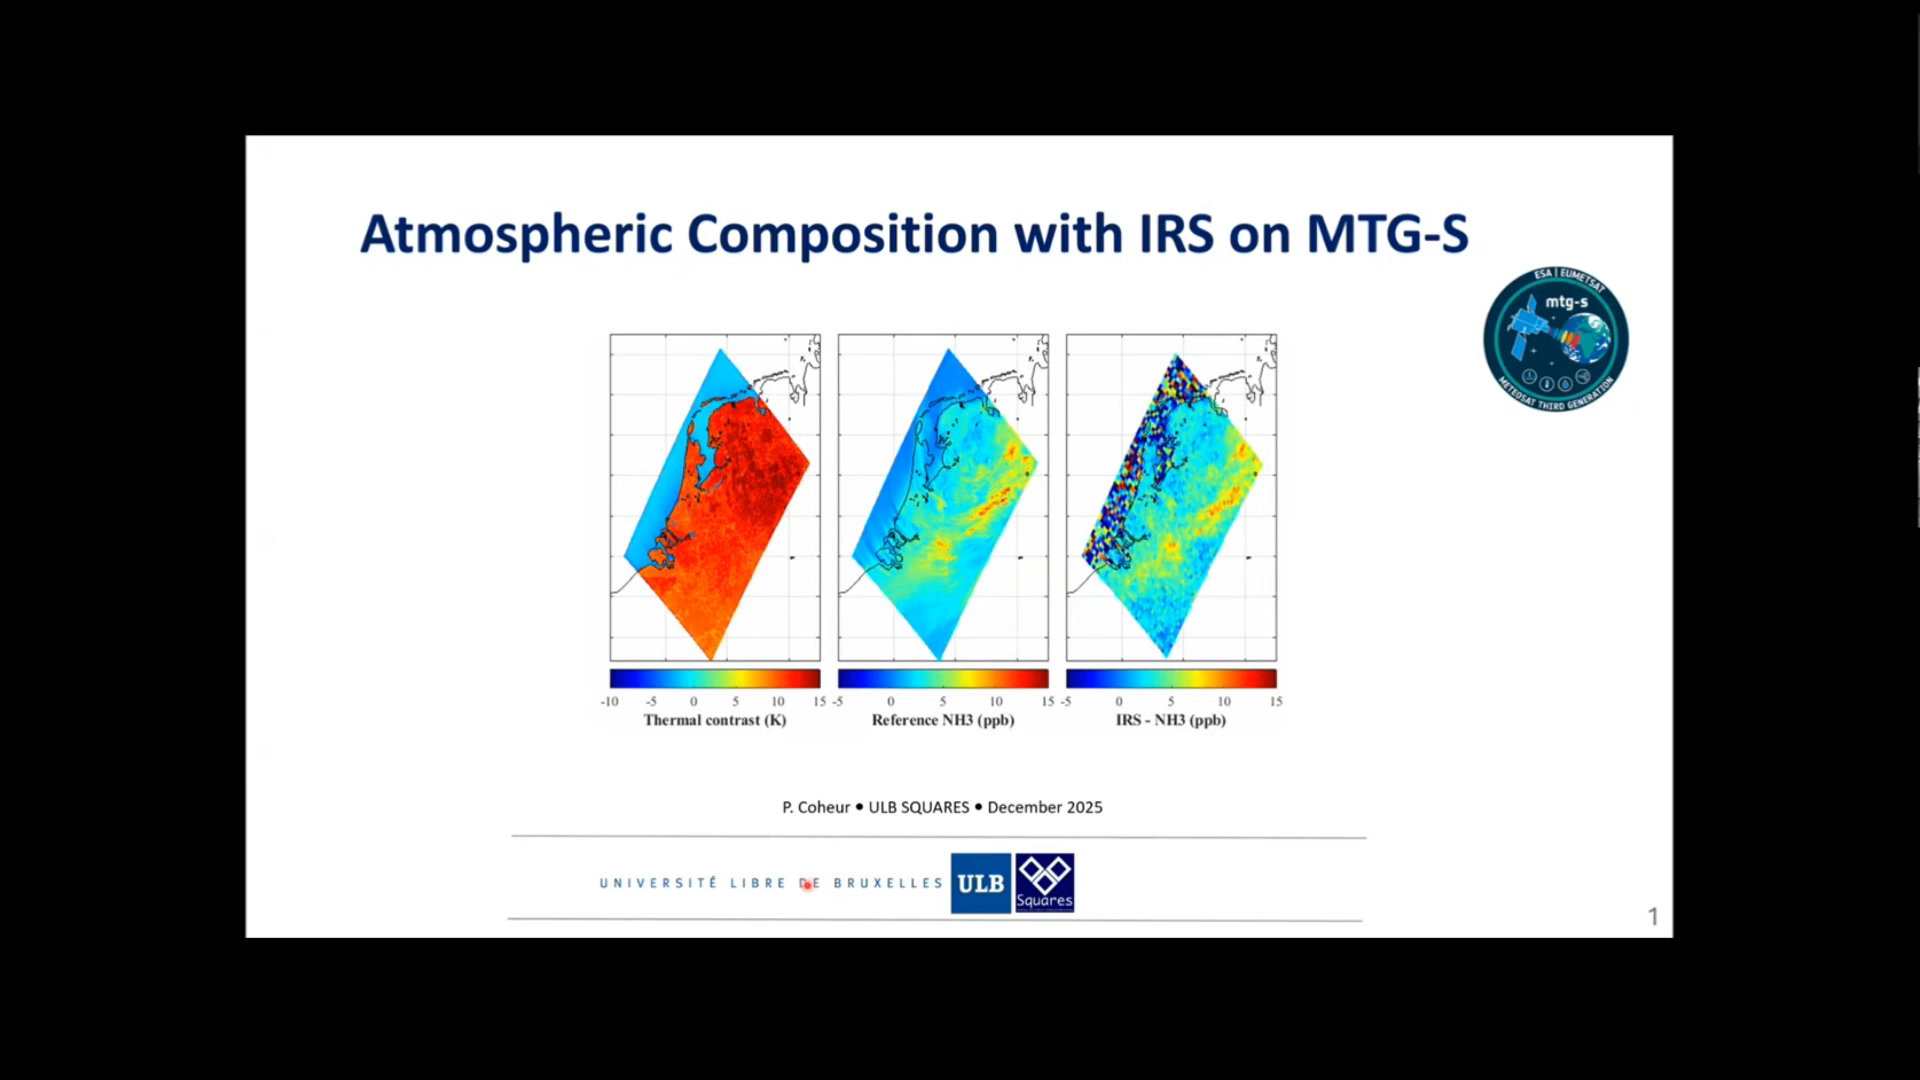
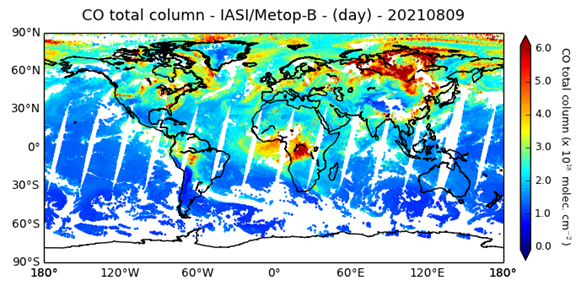
Pierre Coheur talks about the uses of IRS instrument for atmospheric composition.
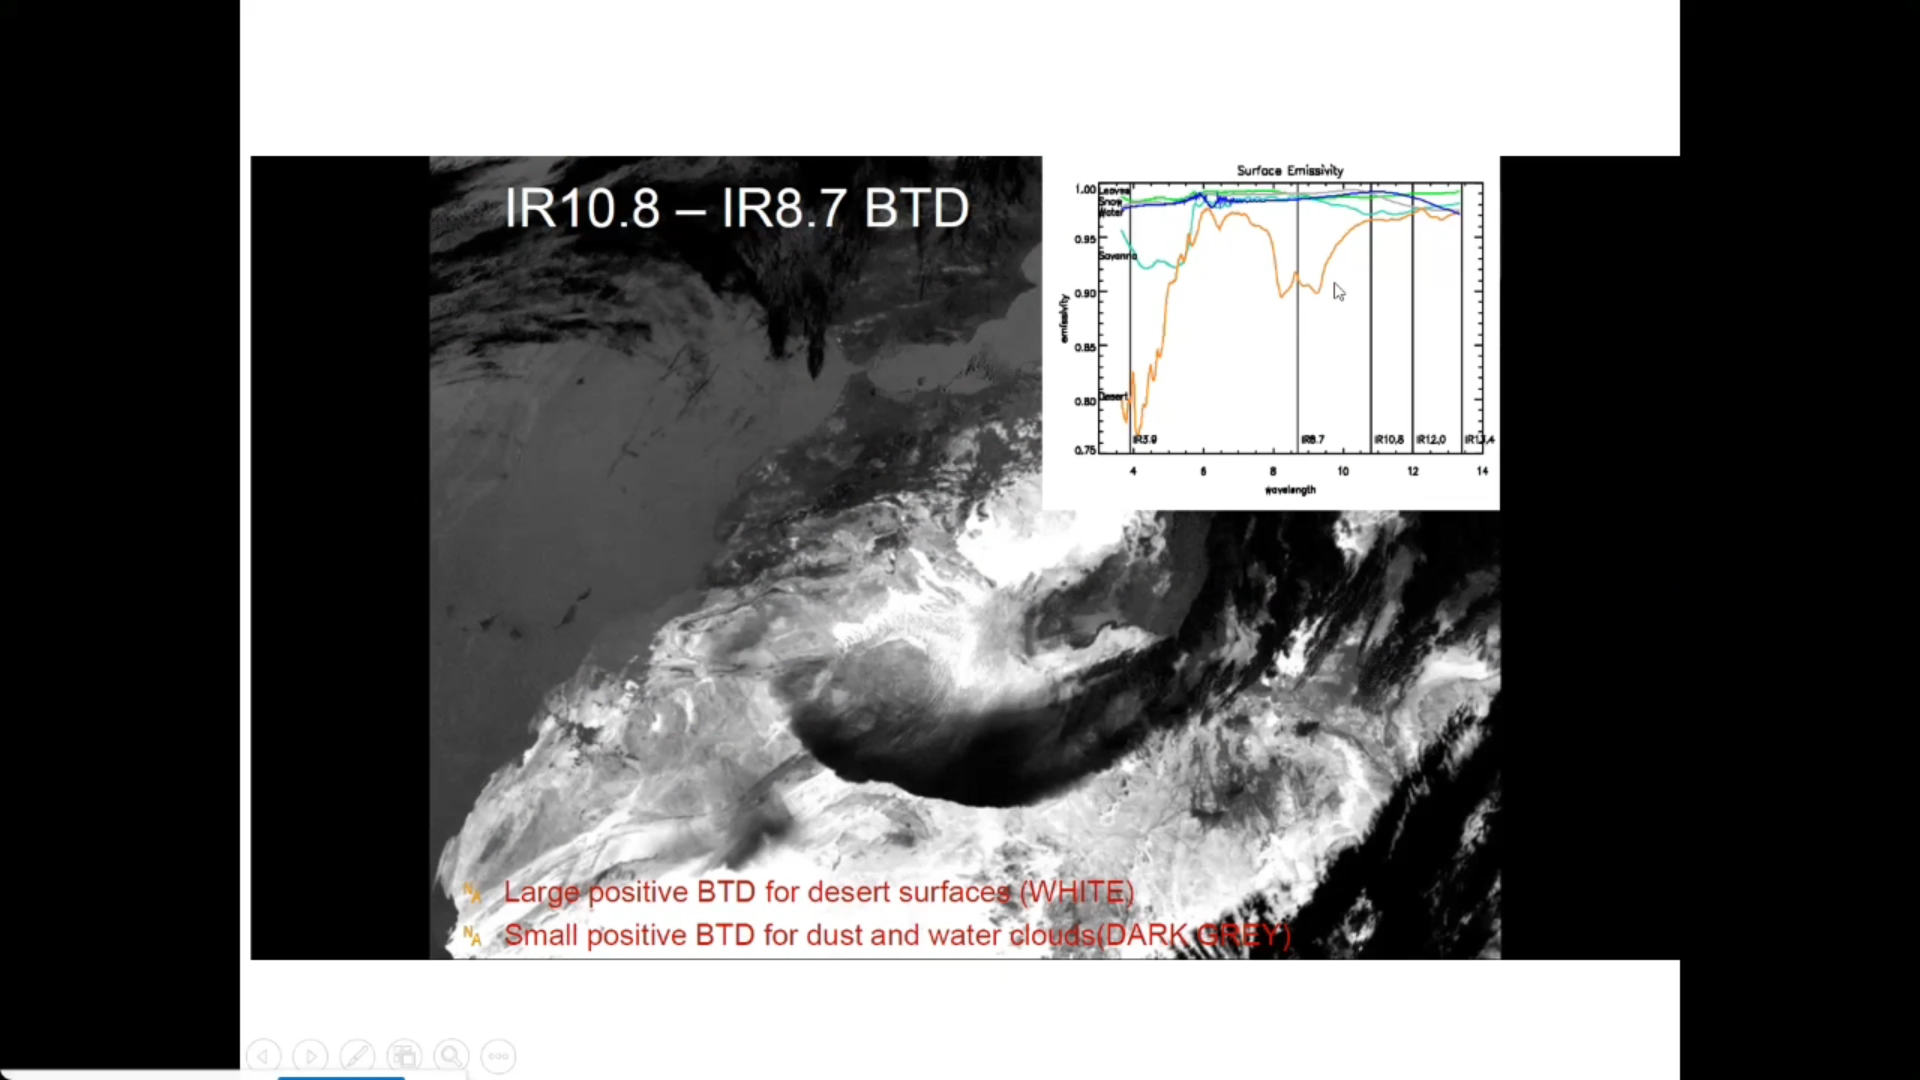
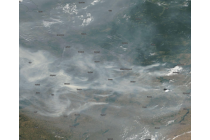
Andreas Wirth goes over the topic of Dust Infused Baroclinic Storms (DIBS) and explains the current forecast model inconsistencies regarding DIBS as well as their impact on weather.
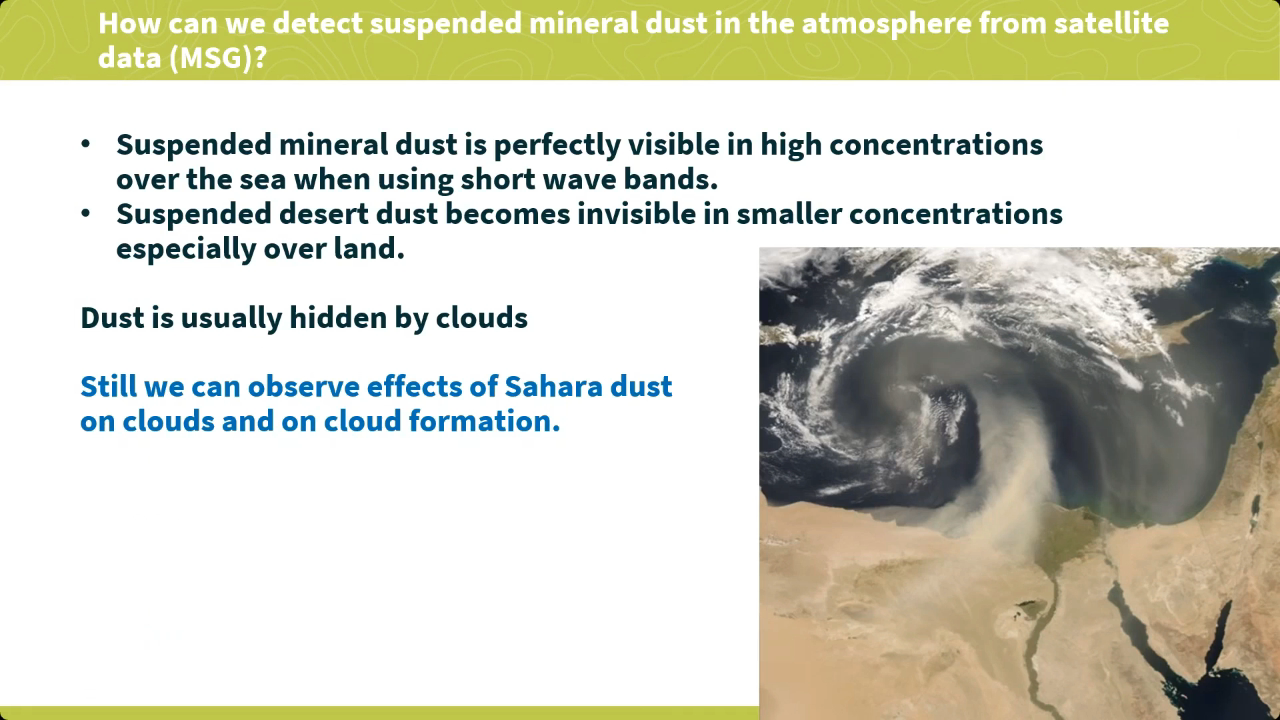
Dust Infused Baroclinic Storms (DIBS) have a high impact on weather. Mineral dust particles in the atmosphere reduce sunlight at lower levels, reduce visibility and damp daily temperature maxima. Dust particles can have an impact on forecasted precipitation too, and in higher concentrations, dust particles can cause respiratory problems.
This presentation focuses on circulation pattern that causes dust transport towards Europe and on how to detect high dust loads in- and outside clouds from geostationary satellite imagery on the basis of recent examples.
Lecture slides
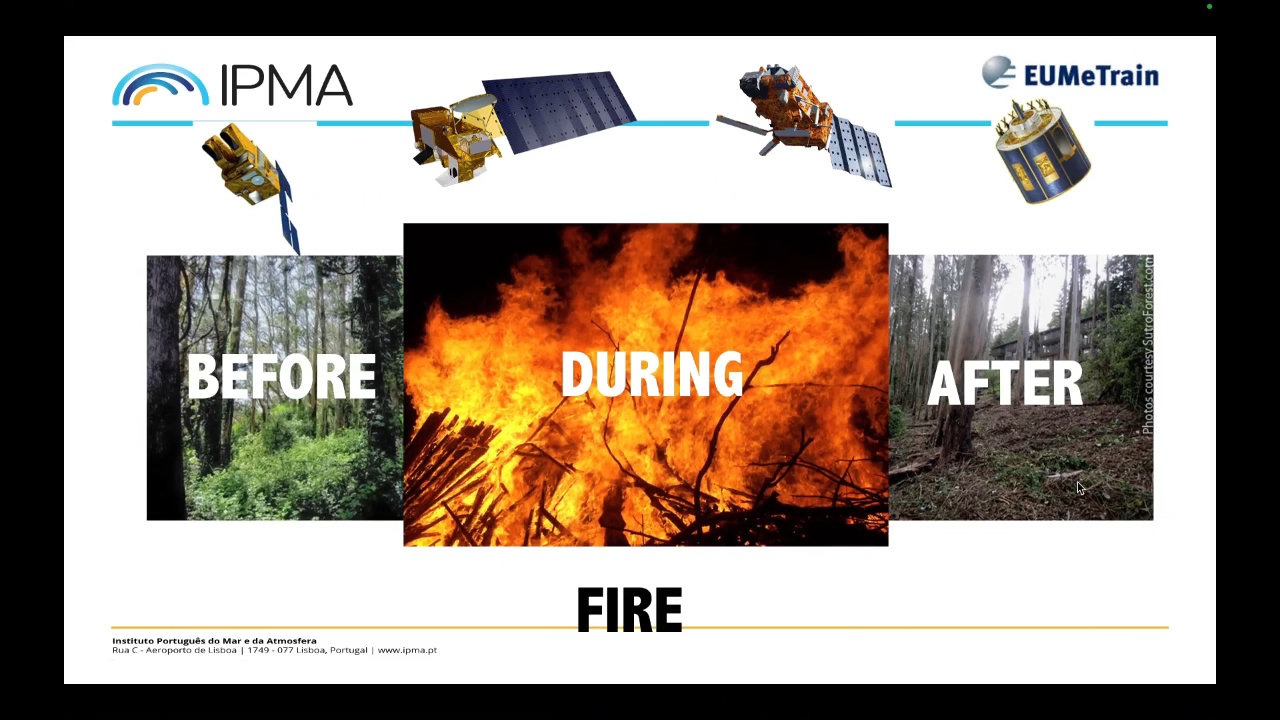
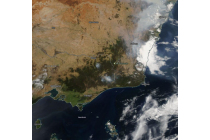
Celia Gouveia shows the importance of monitoring the fire risk for preventive measures, as well as impact assessment.
LSA-SAF generates a large set of products for land surface characterization derived from SEVIRI on board Meteosat Second Generation (MSG). The availability of such datasets in Near Real Time (NRT) allows a continuous monitoring of the situation before, during and after wildfire. The monitoring of the situation during the fire season relies on the fire risk mask (FRM) disseminated daily and with 5 days in advance. The severity of the occurred events is assessed by means of Fire Radiative Power. Post fire conditions over burned areas and the assessment of the impact of fire events on vegetation regeneration is assessed by means vegetation products.
Lecture slides
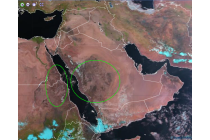
In this air quality module, you will learn to respond better to air pollution and Sahara dust events, by learning which resources to use for these events.
Atmospheric composition can be observed using various instruments (satellite and ground-based) and can be analysed and forecasted using numerical models. This training module provides an overview of available online resources that can be used to assess an air pollution or a Sahara dust event. An air pollution event is defined as a time during which the concentration of atmospheric pollutants exceeds air quality standards. In southern Europe, these also include Sahara dust events, which occur mostly in spring and summer, when south-westerly flow transports desert dust from the areas south of the Atlas Mountain range.
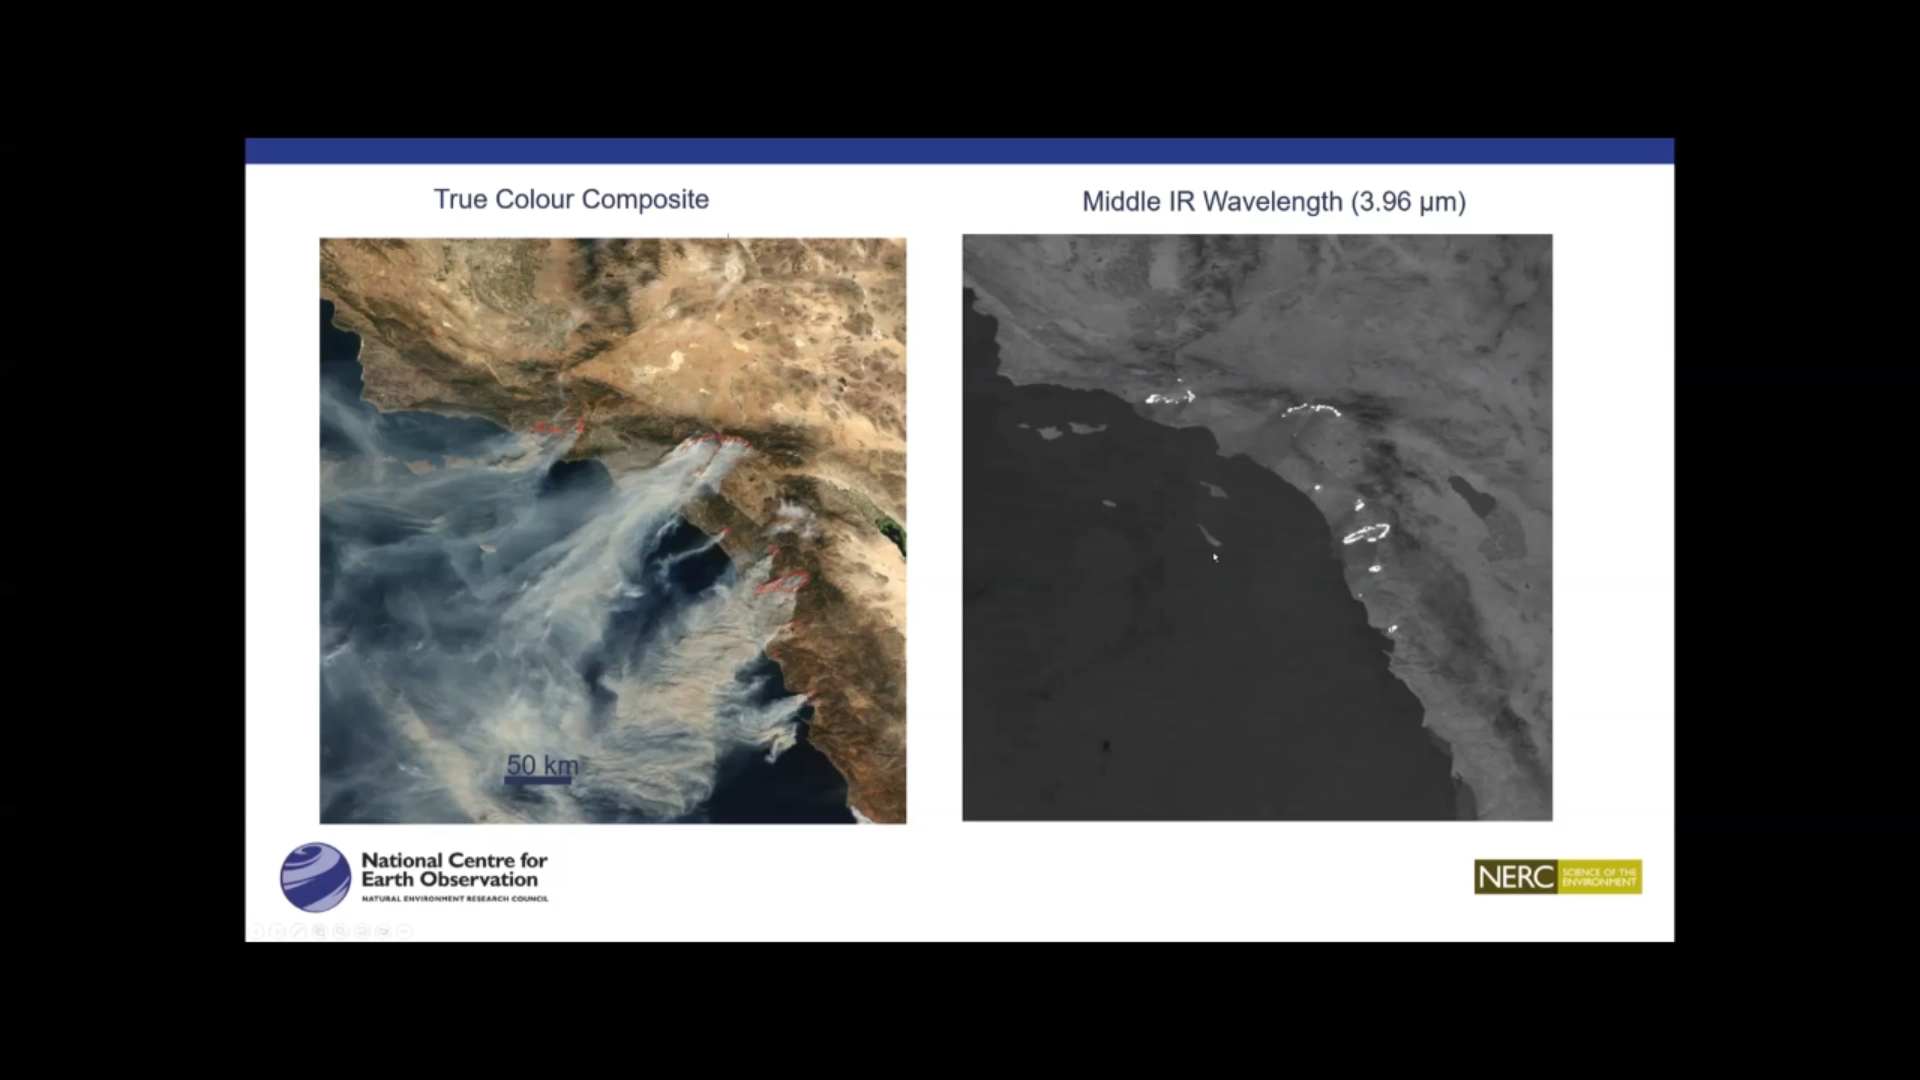
Martin Wooster talks about fire detection and FRP (Fire Radiative Power) product.
Martin Wooster talks about fire detection and FRP (Fire Radiative Power) product.
Lecture slides
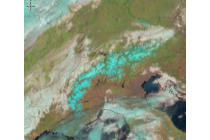
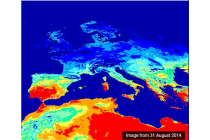
Federico Fierli shows how to use satellite imagery for observing aerosol.
Aerosol particles are a key component of weather and climate atmospheric system. Satellite offer the unique advantage to provide a global view with a long-term continuity. We will explore the methods to retrieve aerosol burden with the associated uncertainties for several cases as dust plumes and wildfire emissions. The presentation addresses the data chain from retrieval using different orbital geometries, spectral regions and geophysical products to advanced products as Climate Data Records to the assimilation process.
Lecture slides
Learn how to detect areas covered with snow, ice or cloudy areas.
In this module you will be able to identify geographical features and surface characteristics and conditions through images and satellite products. Although surface features are not the main purpose of meteorological forecasting, being able to identify and distinguish them from atmospheric features can be useful.
To access the resource click here.
Learn how to recognize burnt areas.
In this module you will be able to identify geographical features and surface characteristics and conditions through images and satellite products. Although surface features are not the main purpose of meteorological forecasting, being able to identify and distinguish them from atmospheric features can be useful.
To access the resource click here.
Learn how to identify hotspots.
In this module you will be able to identify geographical features and surface characteristics and conditions through images and satellite products. Although surface features are not the main purpose of meteorological forecasting, being able to identify and distinguish them from atmospheric features can be useful.
To access the resource click here.
Learn how to identify areas of drought and heatwaves.
In this module you will be able to identify geographical features and surface characteristics and conditions through images and satellite products. Although surface features are not the main purpose of meteorological forecasting, being able to identify and distinguish them from atmospheric features can be useful.
To access the resource click here.
Learn how to identify vegetation free areas as well as how to identify different types of desert surface such as sand or desert pavement.
In this module you will be able to identify geographical features and surface characteristics and conditions through images and satellite products. Although surface features are not the main purpose of meteorological forecasting, being able to identify and distinguish them from atmospheric features can be useful.
To access the resource click here.