
Satellite skills and knowledge for operational meteorologist
Listed here are other resources related to Satellite skills and knowledge for operational meteorologist tag:
Note: click on an image to open the Resource
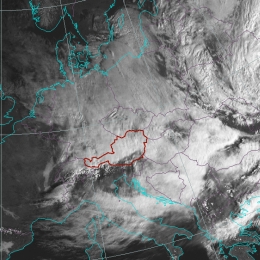
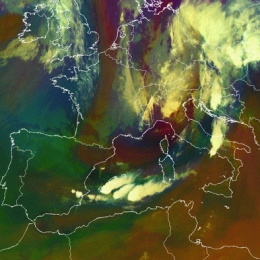
Foehn is a wind system created by the impact of orographic obstacles like mountains on the flow, which often shows a typical cloud structure.
The term Foehn in a general sense refers to a typical wind phenomenon in mountainous areas. At least in the Alpine area, there are cases where such a wind occurs but no or almost no cloudiness develops. Since this manual deals with satellite meteorology, only Foehn cases with cloud features are treated. The basic condition leading to a Foehn process is a flow perpendicular to a mountain range. The basic synoptic-scale precondition is an intensive low to the W, NW of this mountain chain for such a perpendicular stream. Reaching the mountain chains the air is forced to rise. Initially the cooling of the air mass is dry-adiabatic (1C/100 m) until saturation is reached. Condensation begins and from then on the cooling is at the moist adiabatic lapse rate which is 0.65C/100 m. At the height of the mountain tops the air mass will have lost much of its humidity content and can now be regarded as relatively dry. The sinking on the other side of the mountains and associated warming therefore takes place with the dry-adiabatic lapse rate. Consequently the air warms up during descent at a rate higher than the cooling during ascent and reaches the plains as a very dry, very warm and very strong wind - the Foehn.
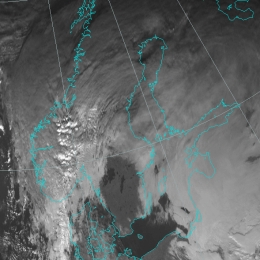
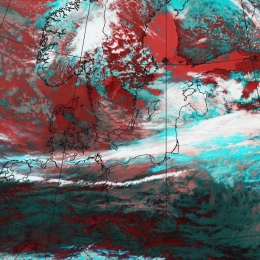
Smooth, very low cloud sheets with warm tops called Stratus unless reaching the ground in which case they are Fog.
Fog and Stratus are seen in satellite images as low-level cloud sheets with a variable horizontal extent. Small local patches of fog are difficult to distinguish in satellite images (size in the order of a few kilometres). However, large areas of fog and stratus can cover areas over hundreds or thousands of square kilometres. Fog (or low Stratus) is formed, when moist air near ground level starts to condensate. This condensation can be produced in the atmosphere by three mechanisms: by ascent and resultant cooling of an air parcel, by radiative heat loss and by the mixing of two parcels of slightly unsaturated air initially having different temperatures. The necessary condition for both the advection and radiation St/Fog formation is a sufficient moisture content in the lowest layers of the atmosphere.
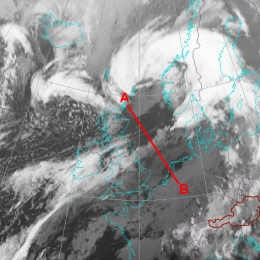
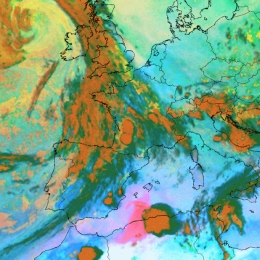
Mesoscale areas of cloud dissolution within frontal cloud bands driven by sinking cold air on the anticyclonic side of a jet streak.
The conceptual model Front Decay describes a mesoscale dissipation of clouds within a Cold Front. Here parts of the frontal clouds disappear due to several reasons. In general, the conveyor belt concept provides an excellent explanation for the decay of cloudiness within a frontal cloud band. A distinction can be made between cases with rising and sinking warm conveyor belts. In the case of a rising warm conveyor belt any gap within the frontal cloud band will probably close again, while in case of a sinking warm conveyor belt a complete dissipation of cloud in the IR imagery is probable. Front decay can also be caused by other processes such as deformation (elongation) of the frontal cloud band. Often Front Decay happens during the development of the CM of Rapid Cyclogenesis.
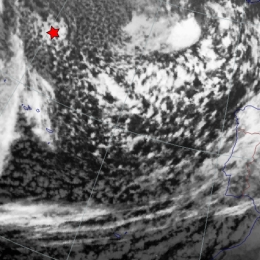
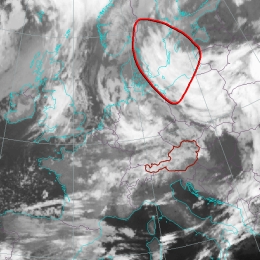
Enhanced Cumulus areas (ECs) consist of a cluster of thicker and larger cloud cells within the usual cold air cloudiness behind frontal cloud bands.
Enhanced Cumulus (EC) areas consist of clusters of convective cells which are thicker and mostly larger than the surrounding cloud cells. As such they are a special form of Cumulonimbus (Cb) Clusters. Enhanced Cumulus areas (ECs) are mesoscale cloud phenomena, which develop within the cold air mass behind a Cold Front in the area of an upper level trough. They do not develop at the boundary of two air masses like Cold or Warm Fronts. In some cases ECs are embedded within cellular cloudiness with tops reaching only up to the lower levels of the troposphere. Although ECs develop in cold air, temperature advection is relatively small.
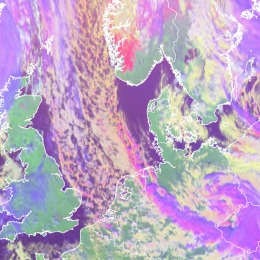
Cloud bands or lines which form within a deformation field and stretch or dissolve under the influence of elongation.
Deformation zones are generated by opposing flows, where cloud systems of two synoptic or meso-scale cloud systems are brought closer to each other. A deformation zone needs a cyclonic and an anticyclonic circulation to form. As anticyclonic circulations tend to be rather dry, characteristic patterns for deformation zones can be best seen in water vapour image loops. After the deformation stage the cloudiness dissipates or merges with other cloudiness. The deforming band elongates in the direction of the upper level flow. Often there is sinking motion on the poleward side of the cloud band. This sinking air can be seen spreading in both directions with the upper level wind field.
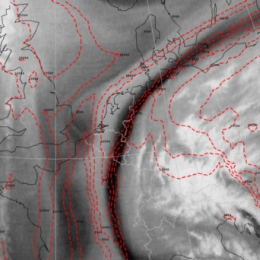
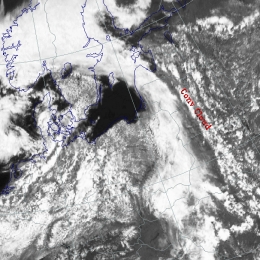
Rather narrow dark stripes in WV images, representing dry sinking air along the cyclonic side of a jet stream.
One of the main features in WV images are rather narrow Dark Stripes lying along the cyclonic side of bright bands and fibres. Typically they occur on the cyclonic side of a jet axis, to the rear of Cold Fronts and Occlusions, and along the leading edge of Warm Fronts. The Dark Stripe represents sinking dry air which can be of stratospheric origin. As such, the stripe can be used as an indication of cloud dissipation from above or to indicate possible unstable development at the boundary between dry and moist air. Dark Stripes in WV images are especially useful if they are combined with relative streams where they can frequently be found associated with dry intrusions as well as with isentropic potential vorticity.
A preferred area for the initial development of deep convection is the maximum of warm air in the warm sector in front of Cold Fronts.
There are typical situations in the thickness ridge ahead of Cold Fronts where Mesoscale Convective Systems develop quickly in the afternoon. In low and middle layers moist warm air is advected from the south or south-west which, together with the drier and colder air at upper levels, leads to potentially unstable stratification of the troposphere. If such a situation occurs close to the Cold Front the effect is often increased by dry and cold air stream from behind the Cold Front overrunning the frontal zone at higher levels.
PV anomalies (stratospheric values of PV low down in the troposphere) are preferred areas for the development of Cbs and Mesoscale Convective Systems.
If stratospheric air is penetrating into the troposphere, a PV anomaly associated with a vorticity maximum will be observed. The reason for this is that the static stability in the troposphere is significantly lower than in the stratosphere. When a PV anomaly approaches an area of moist and potentially unstable air, strong convection is initiated and convection systems such as EC, Comma, Cb Clusters or Mesoscale Convective System can develop. Additionally decaying systems can intensify through this process. Locations favourable for these phenomena are in cold air to the rear of frontal cloud bands.
Unstructured cloud fields developing in areas of pronounced convergence.
Many different kinds of cloudiness related to convergence exist, from small scale to synoptic scale. This concept addresses only cloud features associated with an Occlusion are called Convergence Cloudiness. It is quite a frequent phenomenon which can be observed about twice a month. It is more frequent in winter time since more frontal events can be observed then. About 30% of the Occlusions develop such Convergence Cloudiness.
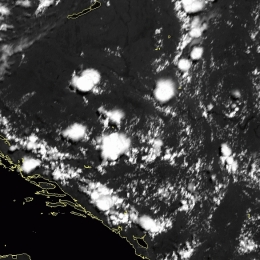
Small scale lines of convective cells as a result of confluence in a land/sea system.
Convective bands are caused by low-level lines of convergence. They often develop in cold air outbreaks in which the coastal shape and sea-surface temperature pattern have a profound effect in establishing a low-level mesoscale circulation. Due to the large temperature difference between land and sea, offshore winds are generated. Convergence occurs when offshore winds, from opposite coasts meet each other. The cold air stream becomes unstable due to turbulent transport of sensible and latent heat from the warm sea surface. Convergence Lines form downwind of major bends in the coastline.
Lines of convective cells in advance of a Cold Front cloud band developing according to a diurnal cycle.
Lines of convective clouds which occur independently from orographic obstacles are mainly linked to frontal systems and appear in advance of frontal cloud bands or within the cold air behind a a frontal system. They are often more or less stationary or at least show a much slower propagation than the surrounding cloud systems. Like the orographically driven convective Convergence Lines the cloudiness is produced by upward motion due to low level convergence which is the result of different processes. Pre-frontal convective lines are influenced by an approaching frontal system as well as the diurnal variation of solar radiation. Consequently, the synoptic situation is changing during day.
Development of convective cells and Cbs over mountain chains through confluence within a diurnal cycle.
The main reason for the development of convective Convergence Lines is the wind field pattern produced by changing thermodynamical situations in an orographic region during daytime. Convergence of the wind during daytime develops because of the differential diurnal heating of the mountainous area (mountain slopes and valleys). These meso-scale wind patterns are under the influence of synoptic scale wind. The orography changes the wind field in direction as well as in speed. Upward motions can be found in the regions of convergence. The strength of the upslope wind also depends on the climate of the area being observed. Mountains in moister climates, for example, have weaker diurnal mountain wind systems, because of the weaker sensible heat fluxes. For mid-latitudes these winds are the strongest during the warmer part of the year (mostly during summer months), and convective Convergence Lines can be observed mostly during this period.