
Satellite skills and knowledge for operational meteorologist
Listed here are other resources related to Satellite skills and knowledge for operational meteorologist tag:
Note: click on an image to open the Resource
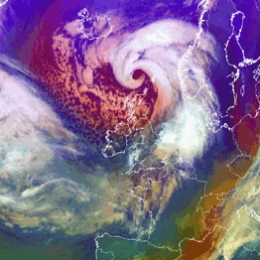
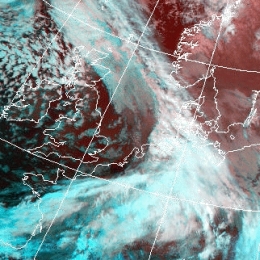
Secondary Low Centres are small scale cloud vortices which develop within already mature Occlusion cloud bands.
Secondary Lows appear as a cloud vortex within the frontal cloud band. A Secondary Low often forms within a Neutral Occlusion, that is, the Occlusion is neither warm nor cold. In this type a strong jet runs over the Occlusion point. The low forms usually between the Occlusion point and the midpoint of the occluded Front. Nearly all Secondary Lows form in systems over the sea during the winter season. This follows from the fact that the basic westerly flow is stronger during the winter, and the deepening of a low is easier over the relatively warm water. Although the secondary lows are associated with strong jets, there seems to be no obvious connection to the conceptual model FI by Jet. The processes in the left exit region are involved in less than half of the cases. But if the left exit region is favourably situated in the vicinity of the occluded front, it can enhance the development. In the process of the secondary low development there is temporarily a back bent part in the occluded Front. However the situation differs to the common Back Bent Occlusion.
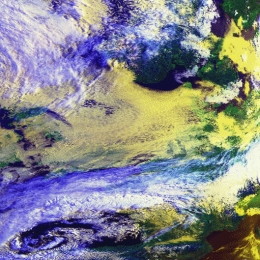
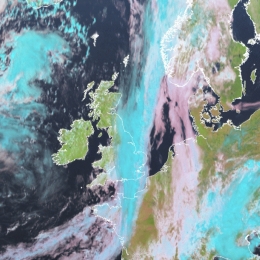
Unstructured patches of low cloud within a stable stratified troposphere.
Sc clouds are a common cloud type both in northern latitudes as well as mid-latitudes. They are most often observed over cool waters throughout the year but also over land areas, especially in winter. The formation of stratocumulus depends on variable scales of physical factors: Synoptic scale flow and the properties advected by the air streams, e.g. moisture content, have an effect on formation of the cloud layer. On the other hand the development of Sc Sheets is controlled by small-scale factors in the atmosphere, such as turbulent mixing in cloud. Sc Sheet formation is often observed after a cold front passage as well as on the rear side of the low pressure. Cool air flow with reasonable wind shear, stable stratification and a large amount of moisture (not necessarily because of advection of moisture from the sea, but by evaporation of rain and from wet ground) form a suitable condition for Sc formation.
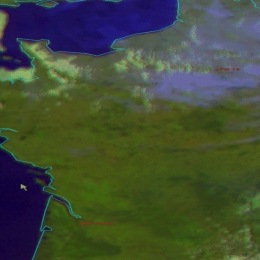
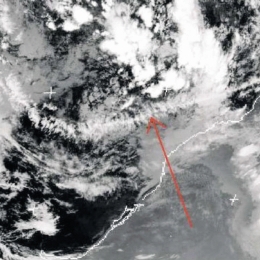
Development of thermally driven circulation between sea and land, often resulting in organized convective cloudiness in the vicinity of coastlines.
The Sea-Breeze is a circulation that develops due to differential heating of air over land and sea. As the sun heats the boundary layer over land, the resulting pressure gradient causes the movement of low-level air from the sea to land (Sea-Breeze) with a return flow aloft. The Sea-Breeze circulation is able to strengthen and/or changing (veering) the surface wind in large scale synoptic onshore circulations. The existence and intensity of the Sea-Breeze depends strongly on seasonal and latitudinal factors and on the time of day. In tropical and subtropical coastal regions the Sea-Breeze is a regular phenomenon throughout the year bringing a pleasant cooling. At higher latitudes it is a common feature during spring and summer only, clear skies, strong insolation and a temperature difference between land and sea at its maximum are relevant and important factors for the Sea-Breeze to develop.
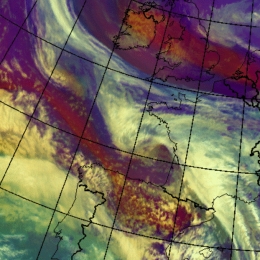
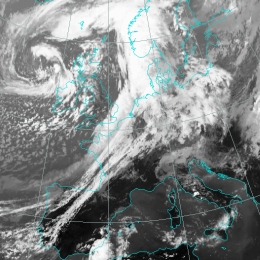
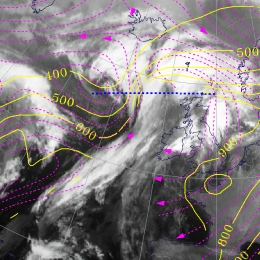
Rapid Cyclogenesis describes a very fast and intensive development of an Occlusion cloud spiral from a low level cloud head. Upper air processes are driving factors in such a development.
Rapid Cyclogenesis (RaCy) describes the development of a cloud head located on the pole ward side of a frontal zone into a cyclonic cloud spiral. The life cycle of this mechanism ranges from 6 to 48 hours. While classical cyclogenesis through Wave development is often slow and the Wave bulge dissolves after some time or produces a spiral after some days, Rapid Cyclogenesis usually leads to a fast development of a cloud spiral. Comparing again Wave development and Rapid Cyclogenesis, a main difference can be found in the orientation of the relative stream forming the cloud head, or cloud bulge. It is similar to a Warm Conveyor Belt in the case of the Wave turning to east/north-eastern direction, but quite opposite in the case of Rapid Cyclogenesis turning to west/south-western directions. While in the case of Wave development stratospheric air (if present at all) does not reach down to levels lower than 300 hPa, in the case of Rapid Cyclogenesis stratospheric air is a key feature and protrudes much further downward (down to approximately 500 hPa or even lower).
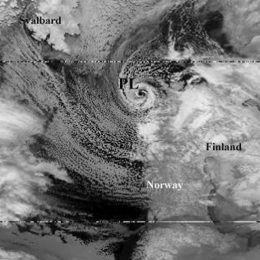
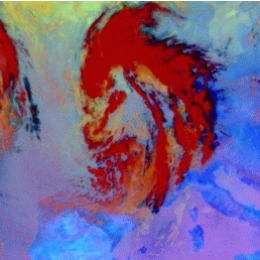
Polar Lows look very similar to Commas but usually occur in northern latitudes. They develop under more specific synoptic conditions when compared to the more general features of a Comma.
A Polar Low is a meso-scale cyclone which normally occurs during winter time far north from the main polar front. In a northerly flow cold arctic air pours out over relatively warm seawater. Polar Lows start to develop in small baroclinic zones resulting from old Occlusions or arctic fronts. Polar Lows are closely related to the Conceptual Model of a Comma. Both are mesoscale systems developing in cold polar or arctic air. Whilst both are induced by upper air disturbances such as PVA and Potential Vorticity, there are some distinct differences. Polar Lows only occur during wintertime (October until April) while Commas can exist during the whole year. Weather events associated with Polar Lows are more severe than those accompanying a Comma.
A WCB Occlusion is accompanied by a distinct cloud spiral; clouds of all three frontal parts CF, WF and WCB Occlusion are multilayered.
The Warm Conveyor Belt is a rising relative stream transporting warm wet air from south-east to northern directions. It is strongly involved in the processes and cloud development connected with fronts. A Warm Conveyor Belt is defined as a layer of air which: originates in a relative easterly to south-easterly flow within the lower levels of the troposphere in the ridge area ahead of the front; generally ascends pole ward forming # cloudiness due to the condensation of moist air; after turning to south-eastward directions ascending motion changes to descending motion, where cloud dissolution takes place. Warm Conveyor Belts are directly involved in the frontal processes, but typical cloud configurations can also be observed separately from the frontal cloudiness.
Mid-level cloud streets and/or high level cloud sheets extending from the mountain ridges to the lee side. They develop when the wind stream is almost perpendicular to the mountain barrier.
There are two possibilities for air to flow past a mountain ridge. Either the air parcels go around the mountain or it is forced to rise over the mountain: Which of these cases occurs, is dependent on several parameters: The static stability, the height of the mountain or mountain ridge and the wind component perpendicular to the mountain. The term combining these parameters gives an idea whether there is a flow across the mountain or not: If U is small the mountain is difficult to cross; also if N increases the mountain will be more difficult to cross. But even in the case of air partially streaming around the mountain, those streamlines approaching a greater height will cross the mountains. When the wind has a component perpendicular to a mountain chain the air accumulation due to deceleration of wind speed by the obstacle on the upwind side creates high pressure. Part of the air is deflected upward giving rise to mountain waves. According to the theory of internal gravity waves, an air parcel within a stable stratified atmosphere will start to oscillate, as long as the waves are damped by friction. Waves can only occur in a stable atmosphere. An air parcel which is removed from its original place cannot oscillate if there is no returning force. Lee Cloudiness will form where there is a sufficient supply of humidity near the wave crests and where there is upward motion.
Upper Waves are cloud bulges at the rear edge of Cold Front cloud bands. They are associated with upper level processes and do not develop.
The term upper level refers to heights that are below the tropopause, but generally above 500 hPa. Wave developments in general take place within a Cold Front. According to the polar front theory a low pressure area in the lower levels of the troposphere can develop if a small-scale disturbance is superimposed on the stream field, causing an ageostrophic circulation within the baroclinic zone of the frontal cloud band. A Wave bulge is an indication of such a process. This circulation causes a fall in surface pressure, convergence, a maximum in temperature advection and an increase in cyclonic vorticity within the lower levels of the troposphere. However, in the physical background of an Upper Wave some processes can be distinguished from classical theory. The observed cloud bulge of an Upper Wave is a sign of a disturbance in the upper stream, but there is no corresponding and deepening pressure minimum at the surface. The dominating driving mechanisms in the upper levels can also be seen from a sharp and pronounced trough at 300 hPa leading to an increase of curvature vorticity. An additional reason for the release of relative vorticity is the right entrance region of the associated jet streak, supporting ageostrophic circulation at upper levels within the stream field.
Development of thicker and mostly more convective cloud within a frontal cloud band in the left exit region of a jet streak during frontal crossing.
If a jet streak approaches and crosses a frontal zone at a large acute angle, horizontal and vertical increase of frontal cloudiness in the left exit region of this crossing jet streak can be observed. These cloud phenomena are produced by the interaction between front and jet streak. The intensification of cloudiness within the left exit region is caused by the following processes: the frontal circulation (for instance an Ana Cold Front) causes lifting processes within the front; the cross circulation in the left exit region of a jet streak causes an intensification of the temperature gradient (frontogenesis); a PVA maximum in the left exit region contributes to upward motion.
Jet Fibres are long and narrow bands of high clouds caused by the Jet streak. They usually form directly attached to Cold Fronts or Warm Front Shields.
Jet Fibres, also known as cirrus streaks, are elongated patches of cirrus clouds, which move rapidly near the jet axis. There is no single theory explaining the formation of the Jet Fibres, but there are several mechanisms probably acting in combination. Generally, there are two necessary conditions needed for clouds to develop: sufficient humidity content and upward motion. In general, bands of cirrus clouds tend to form or persist on the anticyclonic side of the jet. The reason for this is that jet streams are associated with the strong thermal contrast across frontal zones and the layered clouds form in the warm moist air of the Warm Conveyor Belt with cloud edge lying along the jet core. This synoptic scale upward motion would bring a lot of humid air to upper levels and form a broad band of clouds. In order to produce a cloud structure of relatively small dimensions, such as Jet Fibres, there must be an additional smaller scale mechanism. Since a jet is necessarily involved in the formation of Jet Fibres, ascent may also occur because of the circulation in the cells around the entrance and the exit regions of the jet streak. Taking into account the vertical wind shear, directly above the jet core there is also upward motion on a smaller (turbulence) scale
During an Instant Occlusion process, a Comma approaches and merges with a frontal cloud band. As a consequence, an Occlusion-like form of a cloud spiral develops.
The name Instant Occlusion results from the resemblance of the mature stage of development of the cloud system with that of an Occlusion. But the meteorological background of the development is completely different from an Occlusion process where warm air is lifted from the surface. The process of the Instant Occlusion is characterized by the mergence of a distinct cold air, Comma-like cloud feature with a cloud band associated with the polar front (Cold Front). The adjective instant represents the fact that the Occlusion appearance is assumed suddenly without the usual development at a front. Consequently three different systems are involved in the process: comma, cold front and wave.
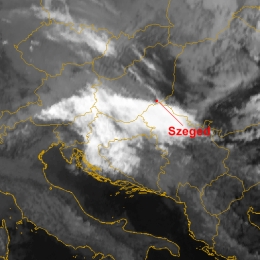
Orography has a strong influence on the propagation of frontal cloud bands; some parts can be retarded which might result in a delay or a decoupling of clouds at different heights. Also, fronts can be rapidly intensified or rapidly shifted.
Whilst passing a mountainous area a front can be modified by orography. Front delay is one possibility, decoupling of clouds at different heights is another. Two phenomena cannot be completely distinguished and are sometimes even difficult to detect because they occur in the same front. Therefore, these two modifications will be treated as one CM in the Manual. Front Delay occurs in cases where there is a long frontal cloud band which is orientated normal or almost normal to a major mountain chain. In the Alpine region this is the common north-south and northeast-southwest orientation of fronts. Moreover, it is observed that the deformation occurs more often if the front approaches the Alps from the west than if it comes from the northwest. If air is being advected towards an obstacle there are two possibilities: either going around or going above. Which possibility dominates depends on wind speed and stratification: low wind speeds inhibit ascent, as does stable stratification. Clouds are displaced slower in the mountainous region then the surrounding regions. As this phenomenon only lasts several hours, it is more important for nowcasting than for forecasting.