
Weather
This mini-module is part of a series of MTG mini modules produced by EUMETSAT/EUMeTrain with the aim of providing quick and useful learning experience about the new satellite products.
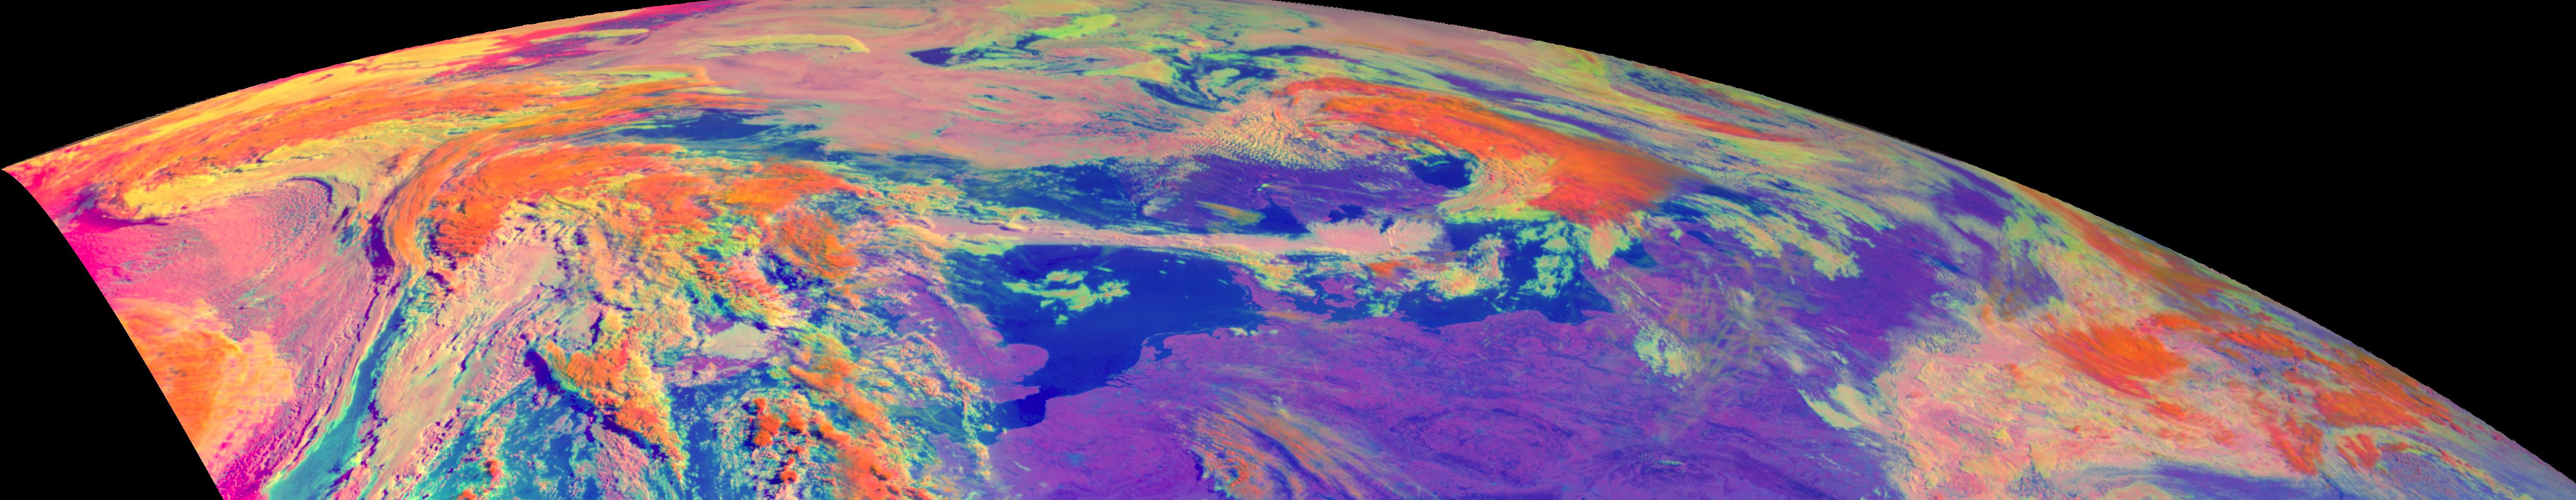
In this exercise you will learn how using MTG products can help you recognize convective initiation.
Enter the mini-module.
This mini-module is part of a series of MTG mini modules produced by EUMETSAT/EUMeTrain with the aim of providing quick and useful learning experience about the new satellite products.
In this exercise you will learn how to detect fog and low clouds by using FCI products.
Enter the mini-module.
This mini-module is part of a series of MTG mini modules produced by EUMETSAT/EUMeTrain with the aim of providing quick and useful learning experience about the new satellite products.
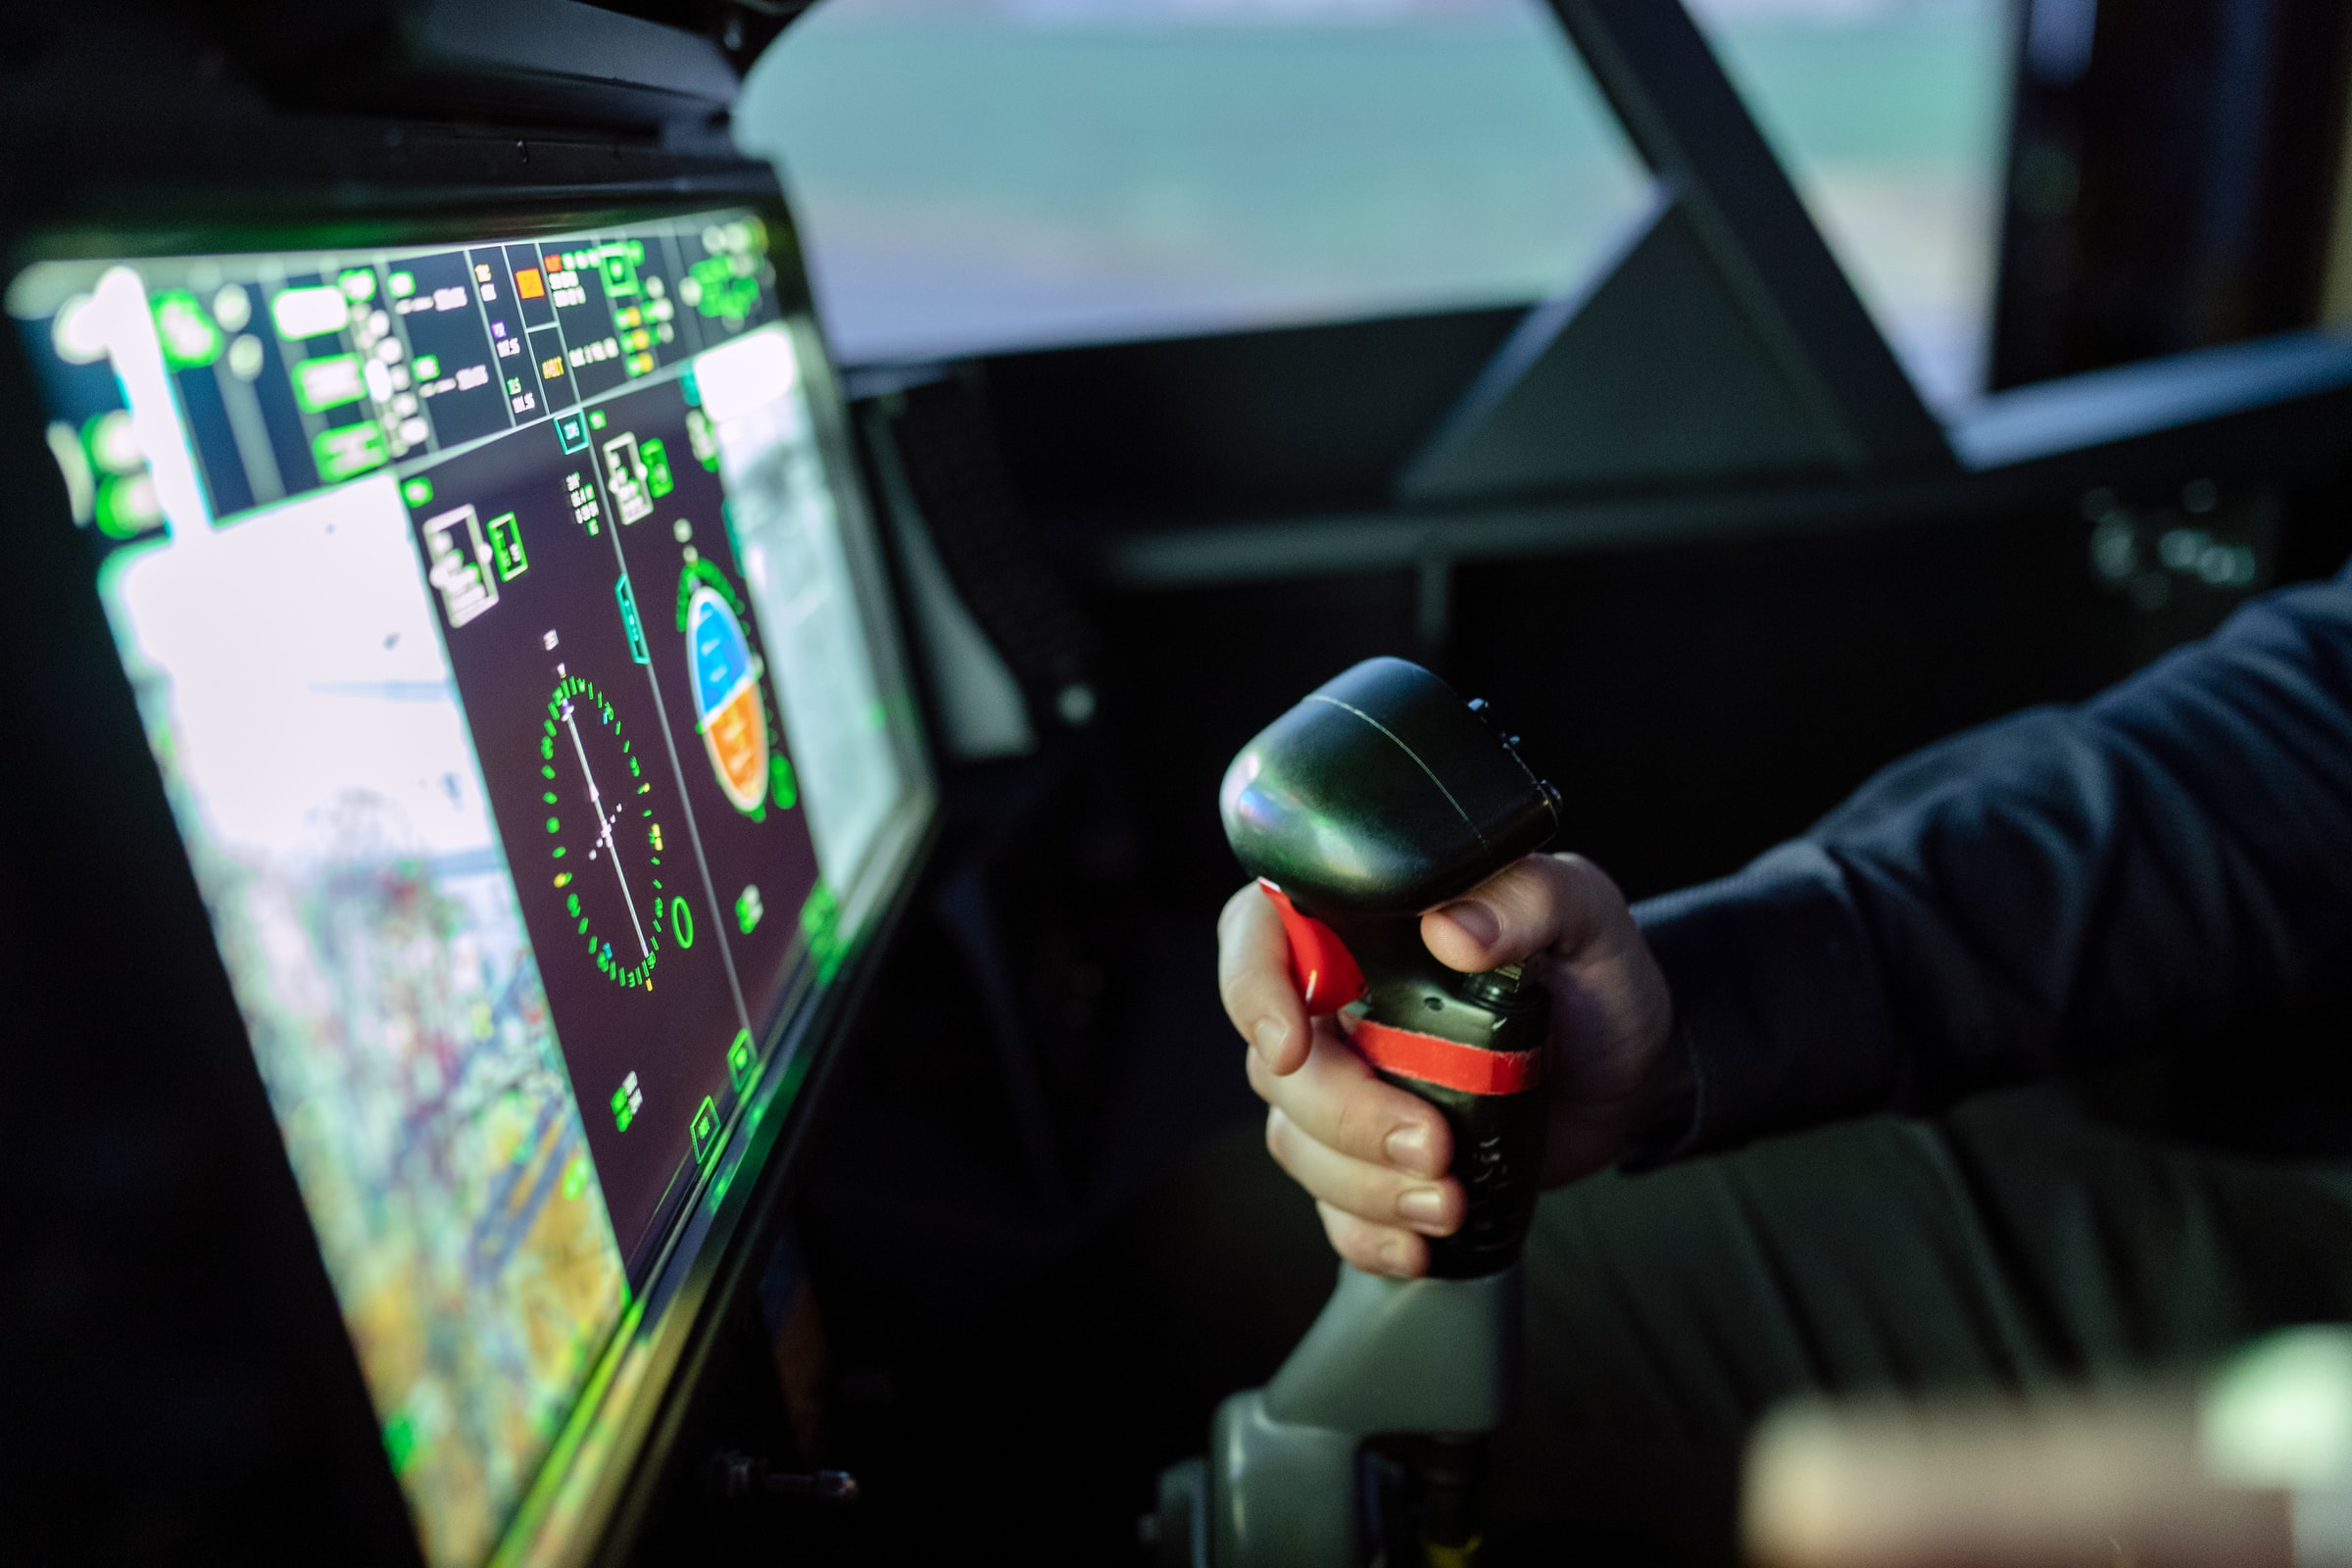
In this exercise you will learn about detection of supercooled droplets which pose a problem for the air traffic.
Enter the mini-module.
This mini-module is part of a series of MTG mini modules produced by EUMETSAT/EUMeTrain with the aim of providing quick and useful learning experience about the new satellite products.
In this exercise you will learn about the improvements in fog & low cloud detection using the new FCI products.
Enter the mini-module.
This mini-module is part of a series of MTG mini modules produced by EUMETSAT/EUMeTrain with the aim of providing quick and useful learning experience about the new satellite products.
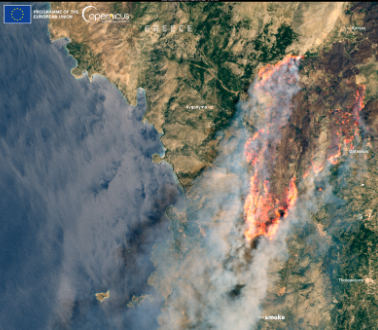
In this exercise you will learn about FCI ability to detect fires and how it compares to previous generation of satellite instruments.
Enter the mini-module.
This mini-module is part of a series of MTG mini modules produced by EUMETSAT/EUMeTrain with the aim of providing quick and useful learning experience about the new satellite products.
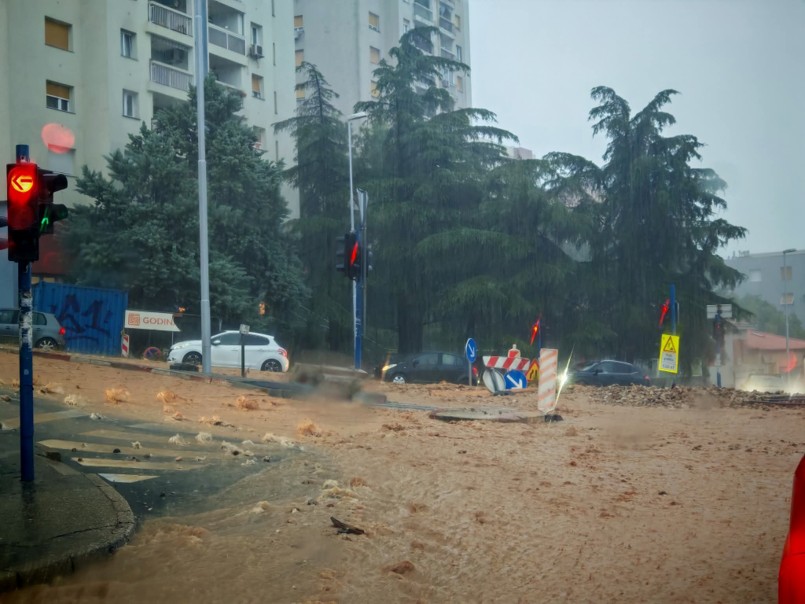
In this exercise you will learn about different MTG products for severe weather forecasting.
Enter the mini-module.
This mini-module is part of a series of MTG mini modules produced by EUMETSAT/EUMeTrain with the aim of providing quick and useful learning experience about the new satellite products.
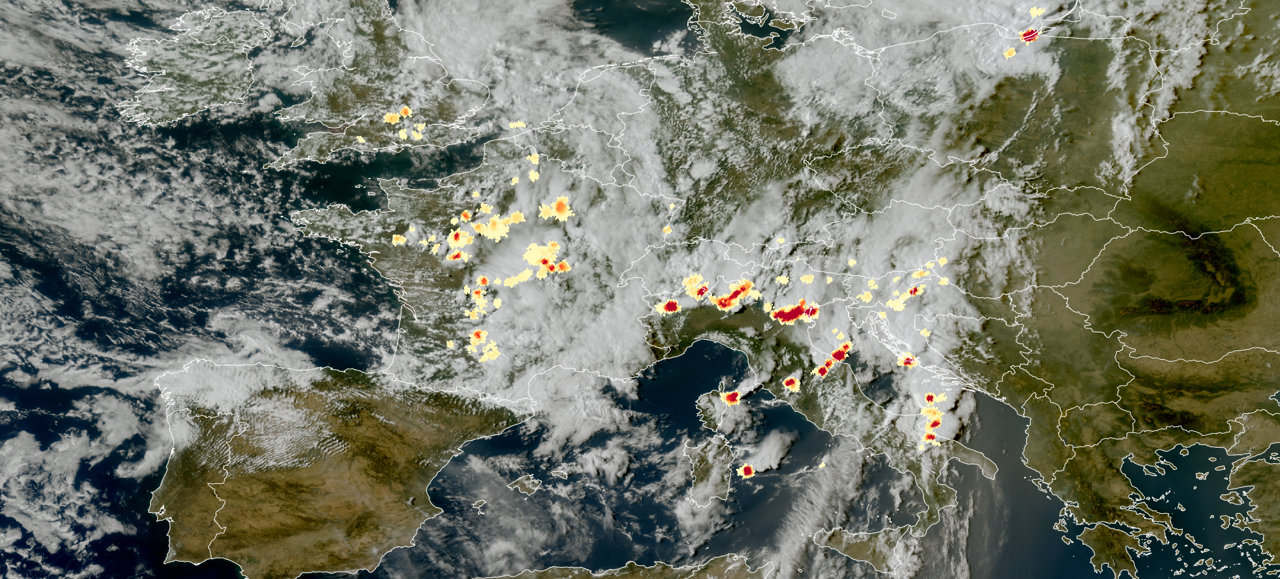
In this exercise you will learn about features in LI data as well as some limitations.
Enter the mini-module.
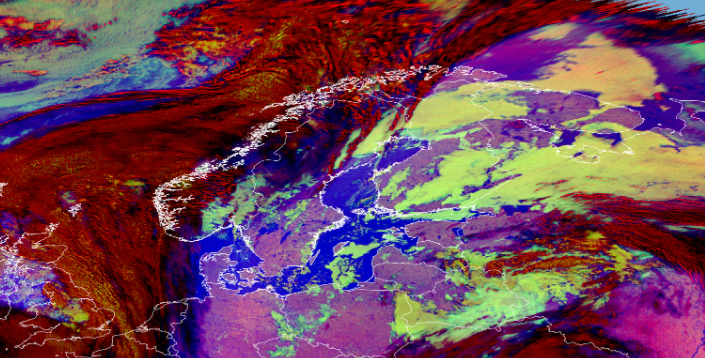
This training module shows the unique challenges that forecasters face when using satellite imagery in high latitude regions. Using a lot of examples and fun exercises, it compares different types of satellites (geostationary, polar) and different generations of satellites as well as benefits and drawbacks of each. It also explains different phenomena that occur in these high latitude regions due to viewing geometry and much more.

This resource was created in order for users to be able to access Weather Briefings page via resources search.
To access the Weather Briefings recordings, click here.
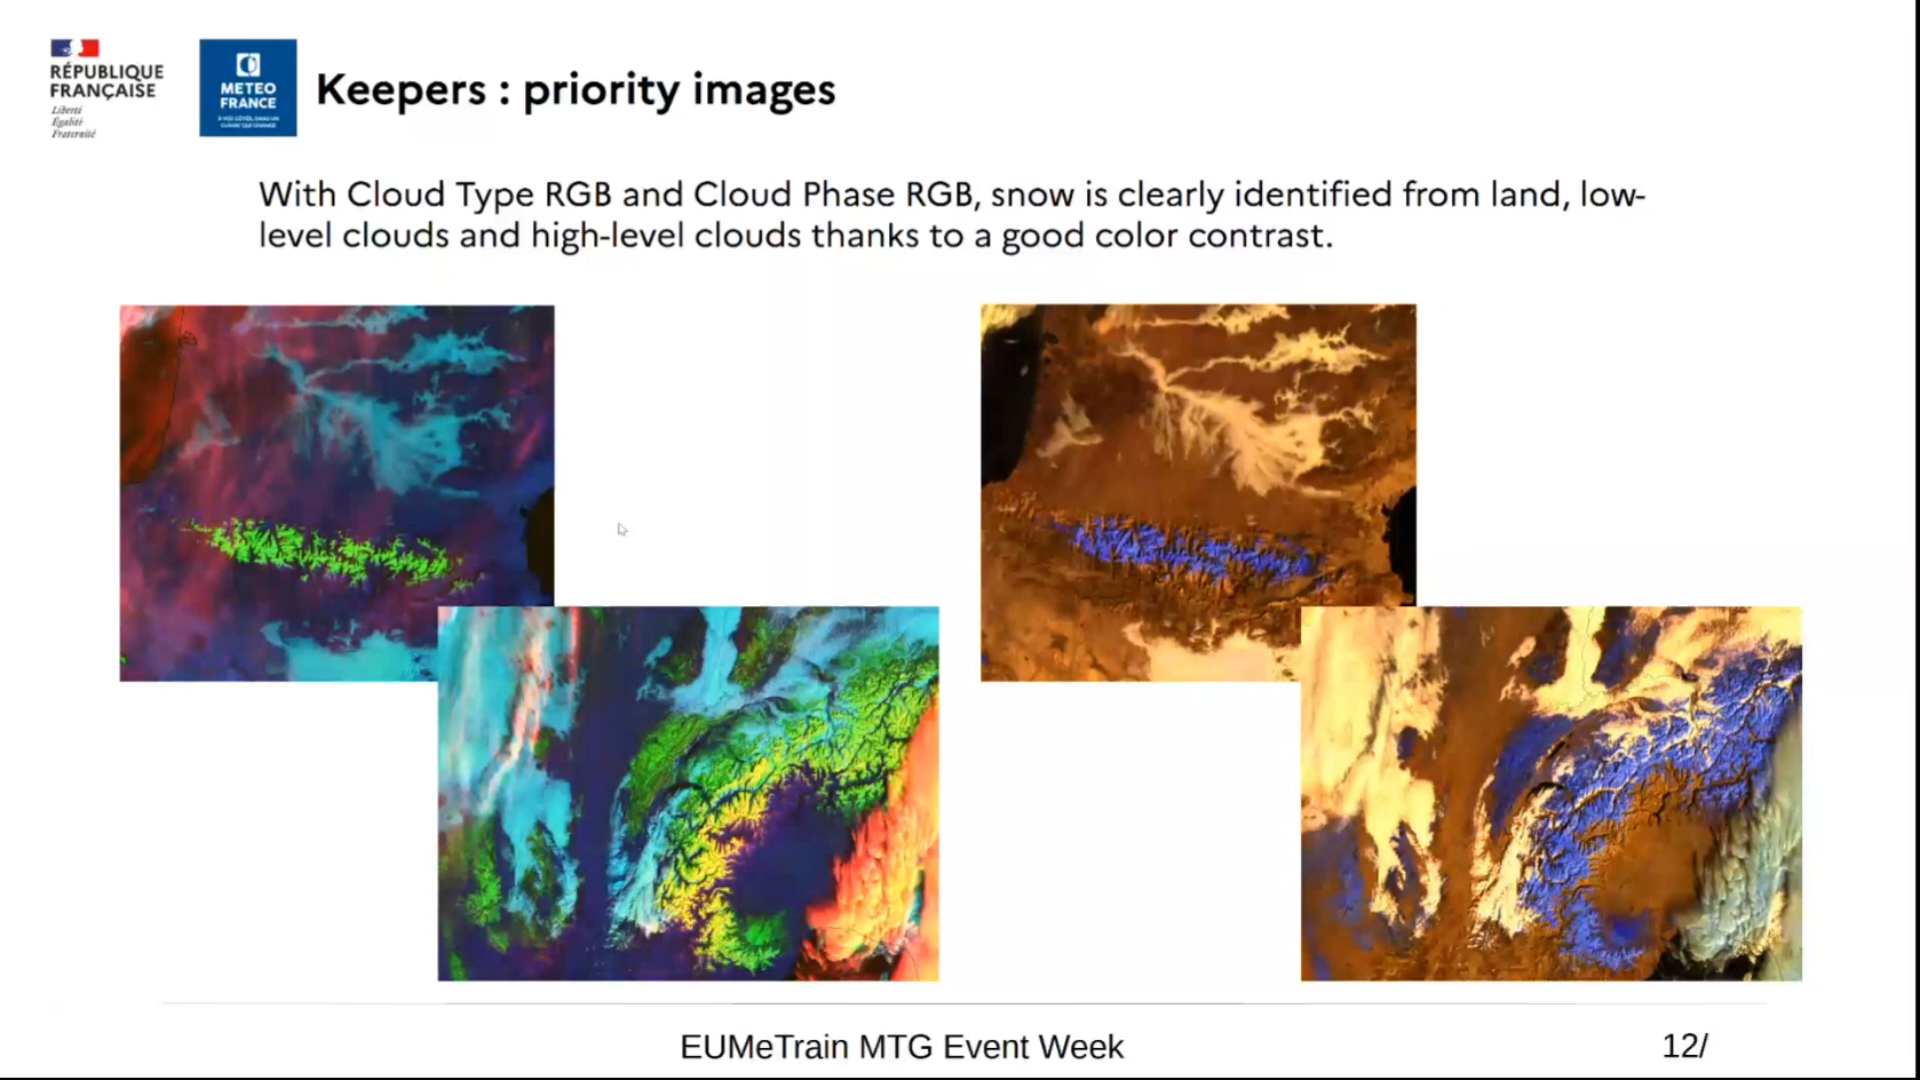
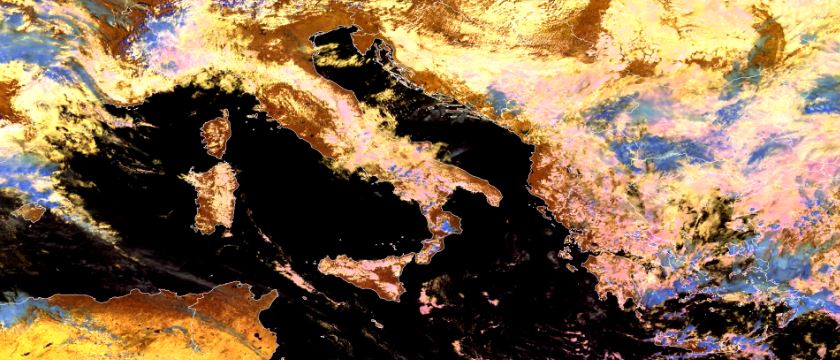
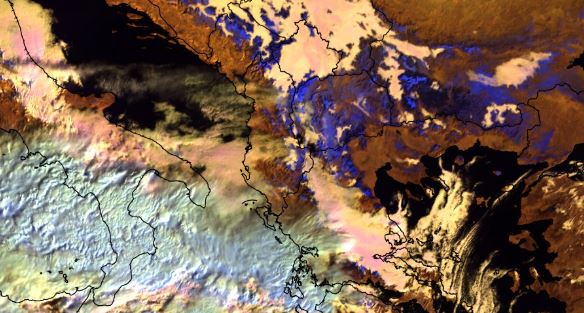
Roxane Desire shows the best RGBs for detection of typical winter weather phenomena: snow, ice and supercooled water clouds.
With the operational deployment of MTG, there are now various methods available for detecting snow on the ground. RGB products, in particular, provide high-contrast images that help distinguish snow on the ground from the underlying surface, low clouds, or ice clouds. We will also explore some important nuances to consider. Finally, still in the context of winter-related issues, we will discuss how these same RGB products can be used to detect supercooled water clouds, which can be responsible for ground ice formation or aircraft icing.
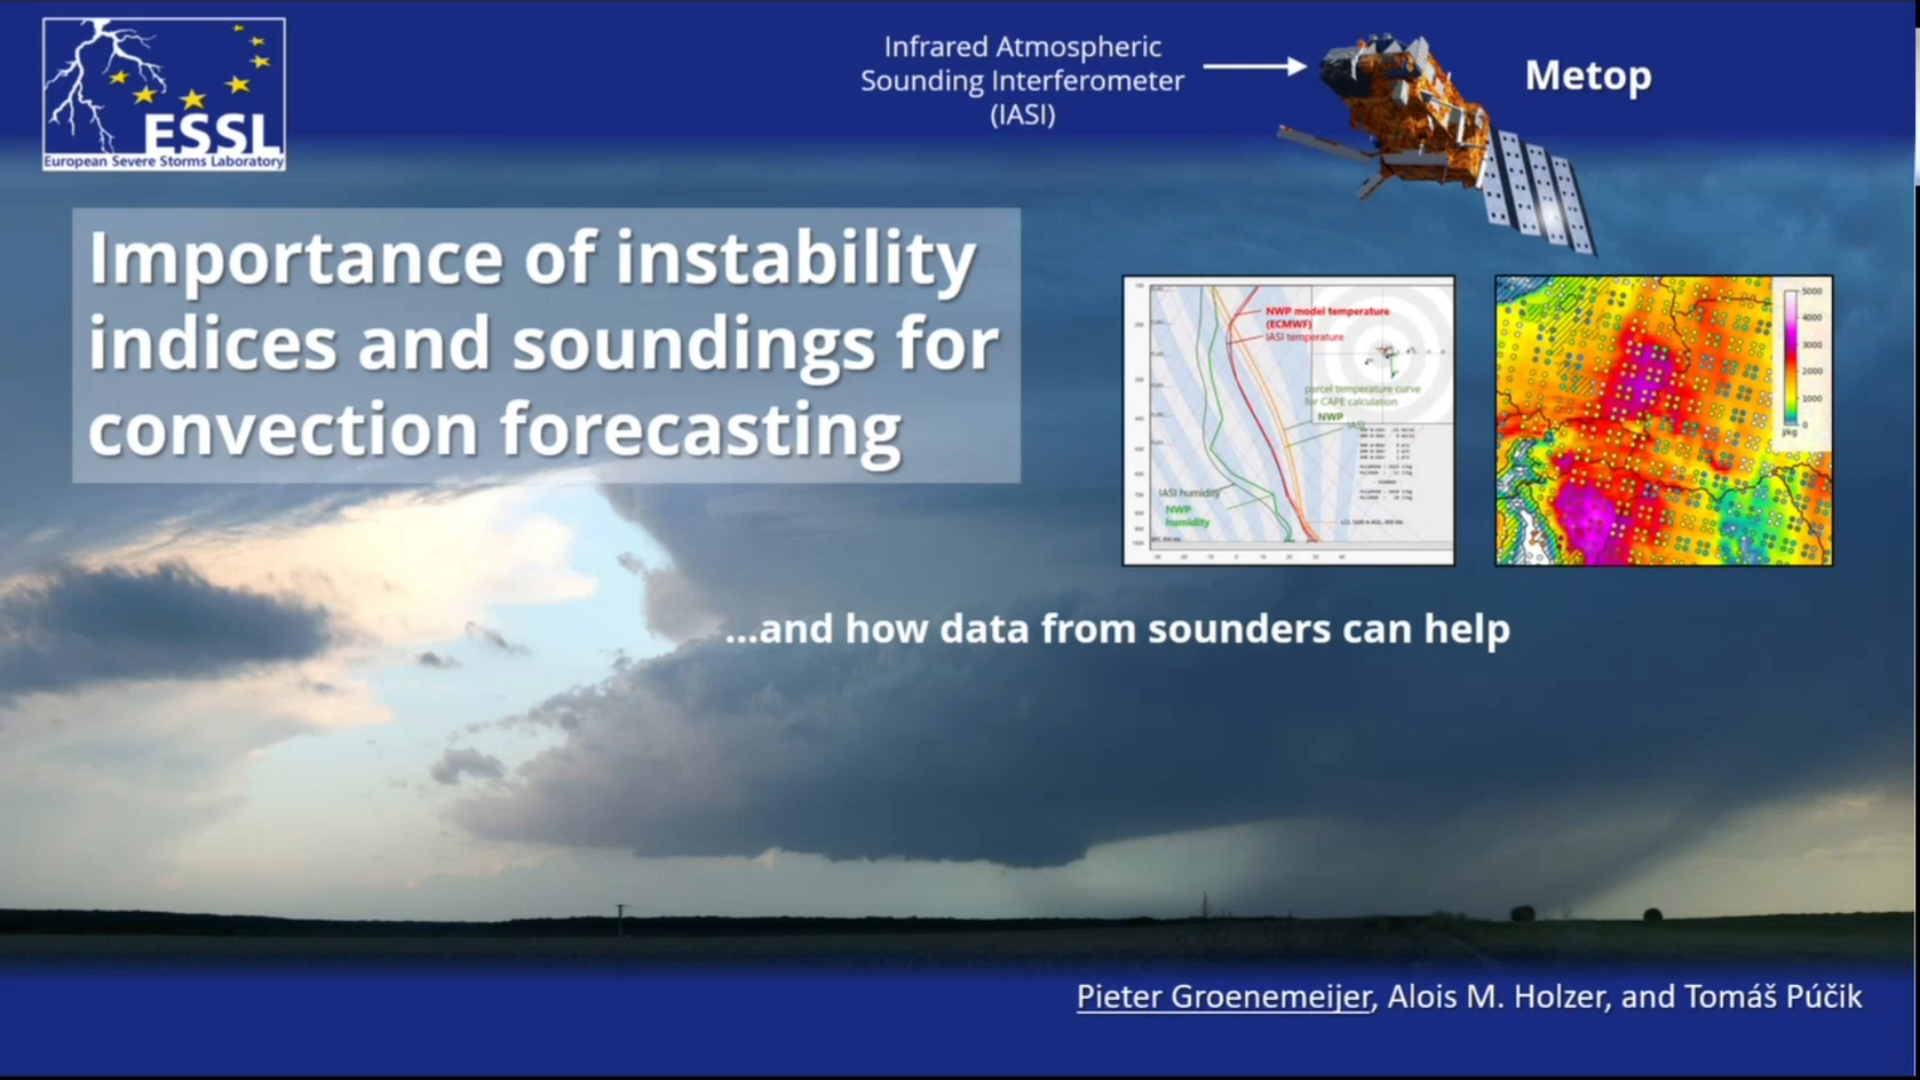
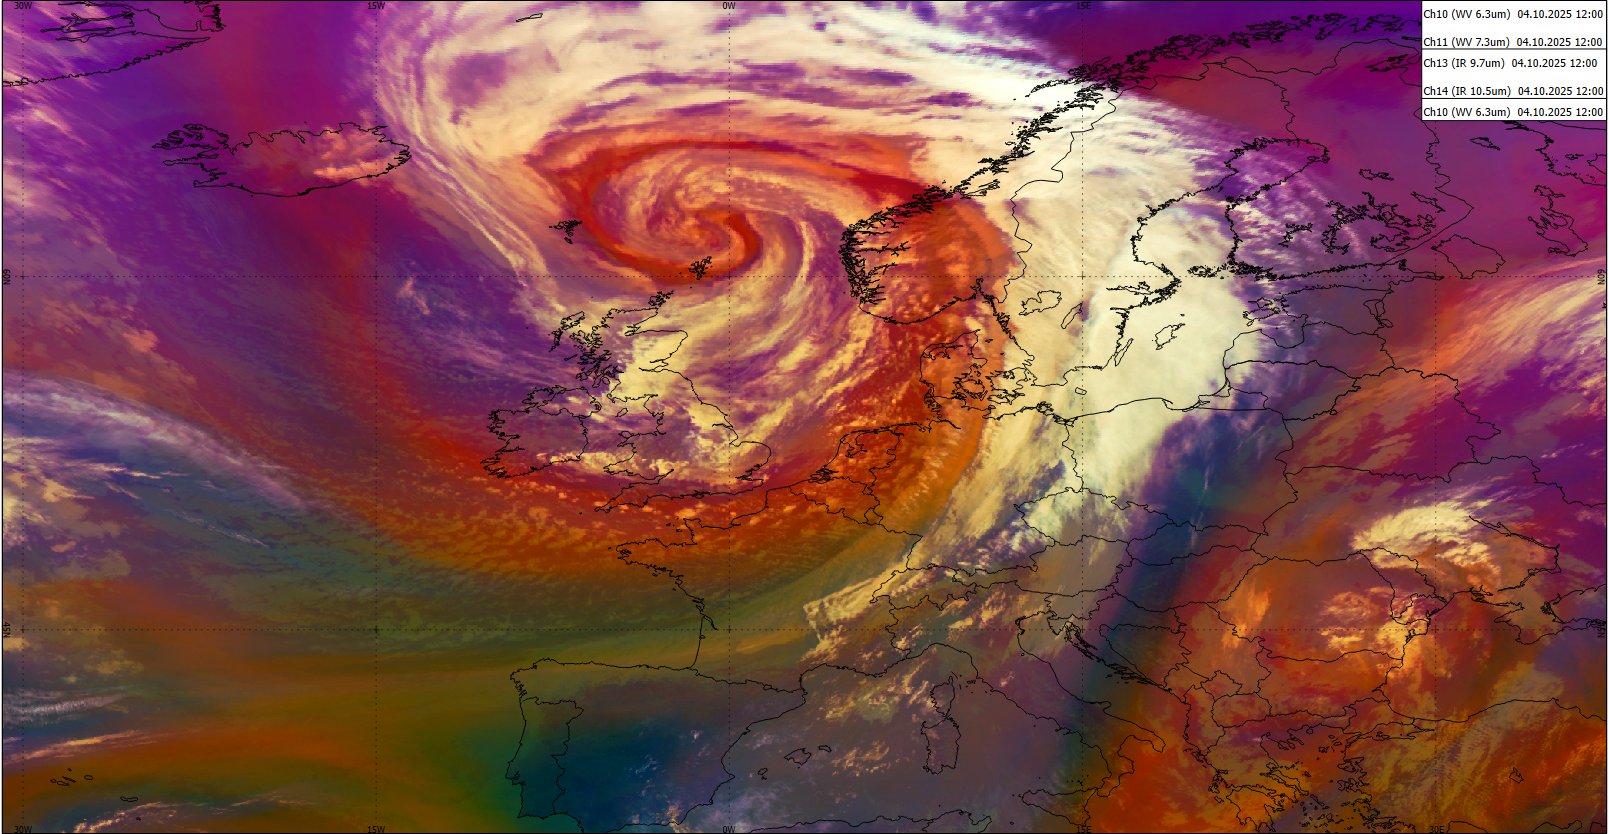
Pieter Gröenemeijer talks about using the IRS data in the context of convection forecasting.
Go to lecture slides