
Hydrology & water management
Listed here are other resources related to Hydrology & water management tag:
Note: click on an image to open the Resource
On 1 February 2024 H SAF held a webinar on the new Moodle e-learning platform.
On 1 February 2024 H SAF held a webinar on the new Moodle e-learning platform. Details about the platform were presented as well as case studies on soil moisture, snow and precipitation.
Go to webinar
Learn how to recognize areas of flooding.
In this module you will be able to identify geographical features and surface characteristics and conditions through images and satellite products. Although surface features are not the main purpose of meteorological forecasting, being able to identify and distinguish them from atmospheric features can be useful.
To access the resource click here.
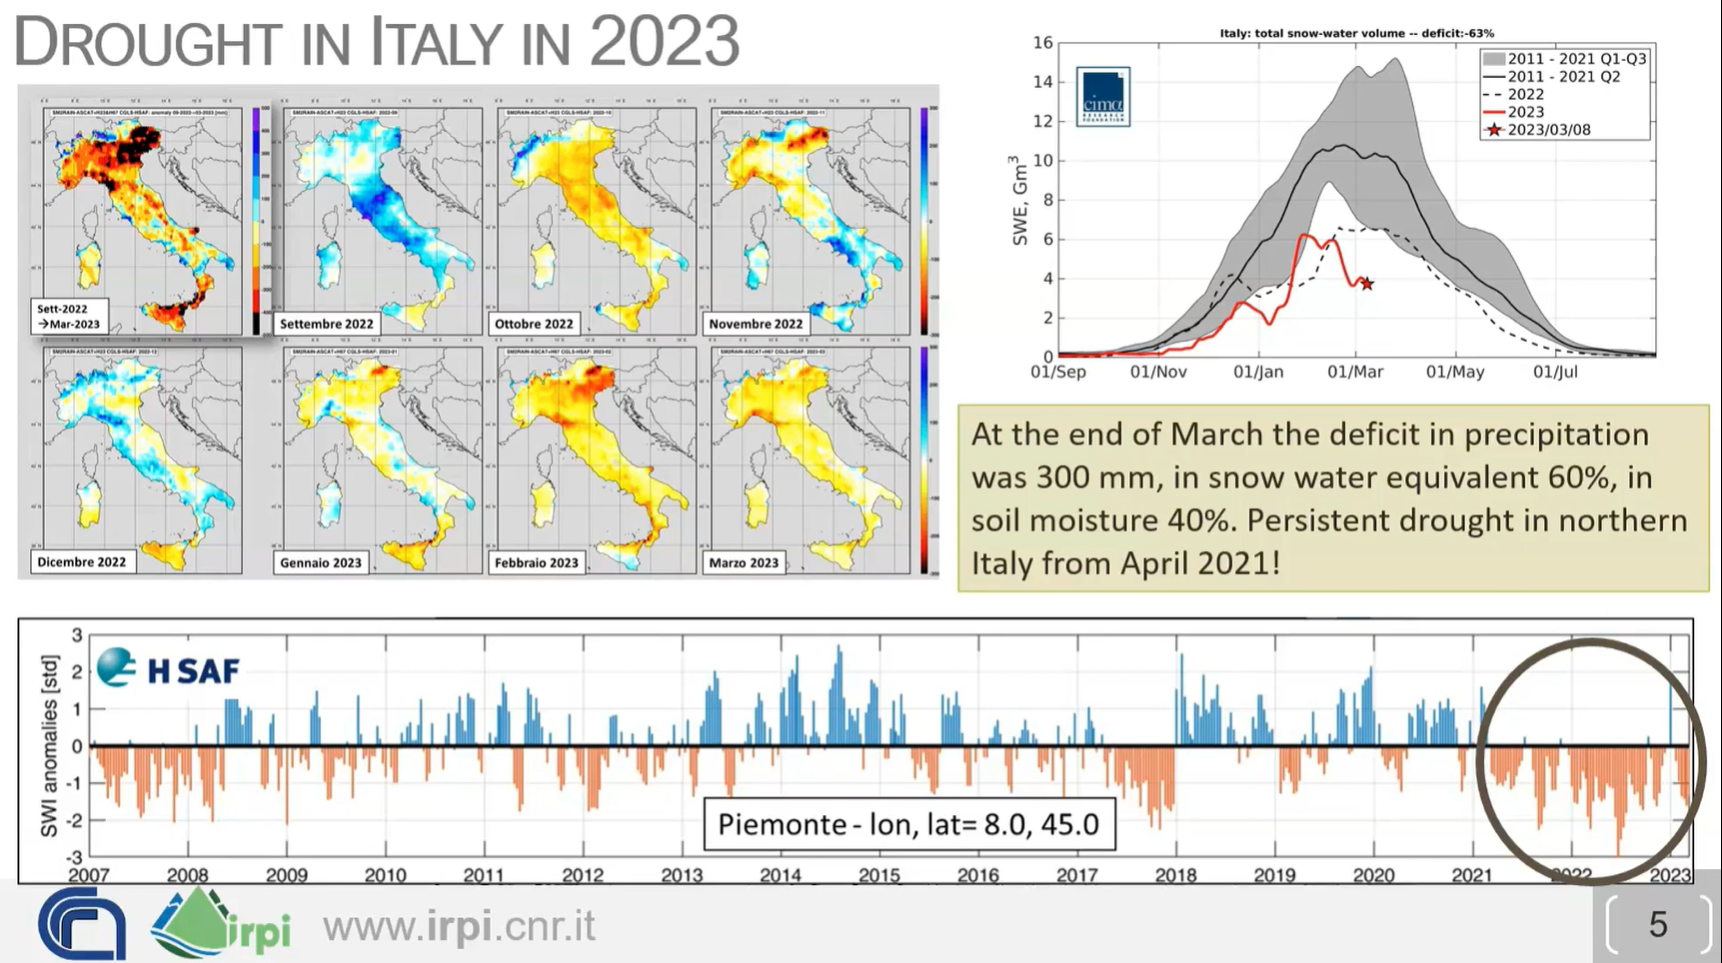
Luca Brocca shows how to combine multiple satellite derived variables to monitor drought.
How do we monitor drought? Is it enough to use only precipitation data and calculate the SPI (Standardized Precipitation Index)? New satellite-derived products (precipitation, evaporation, soil moisture and snow) offer additional ways to monitor drought in space and time, to assess WHERE the water is (surface soil, root zone soil, snowpack), and thus to know WHEN the water will be available. Real-world case studies will be analyzed together with the participants, also using an interactive platform (https://explorer.dte-hydro.adamplatform.eu/). The objectives of the lecture are: (1) to assess drought risk based on (new) satellite observations, and (2) to translate drought risk information into real-world decisions for water resources management (e.g., reservoir management, irrigation, hydropower generation).
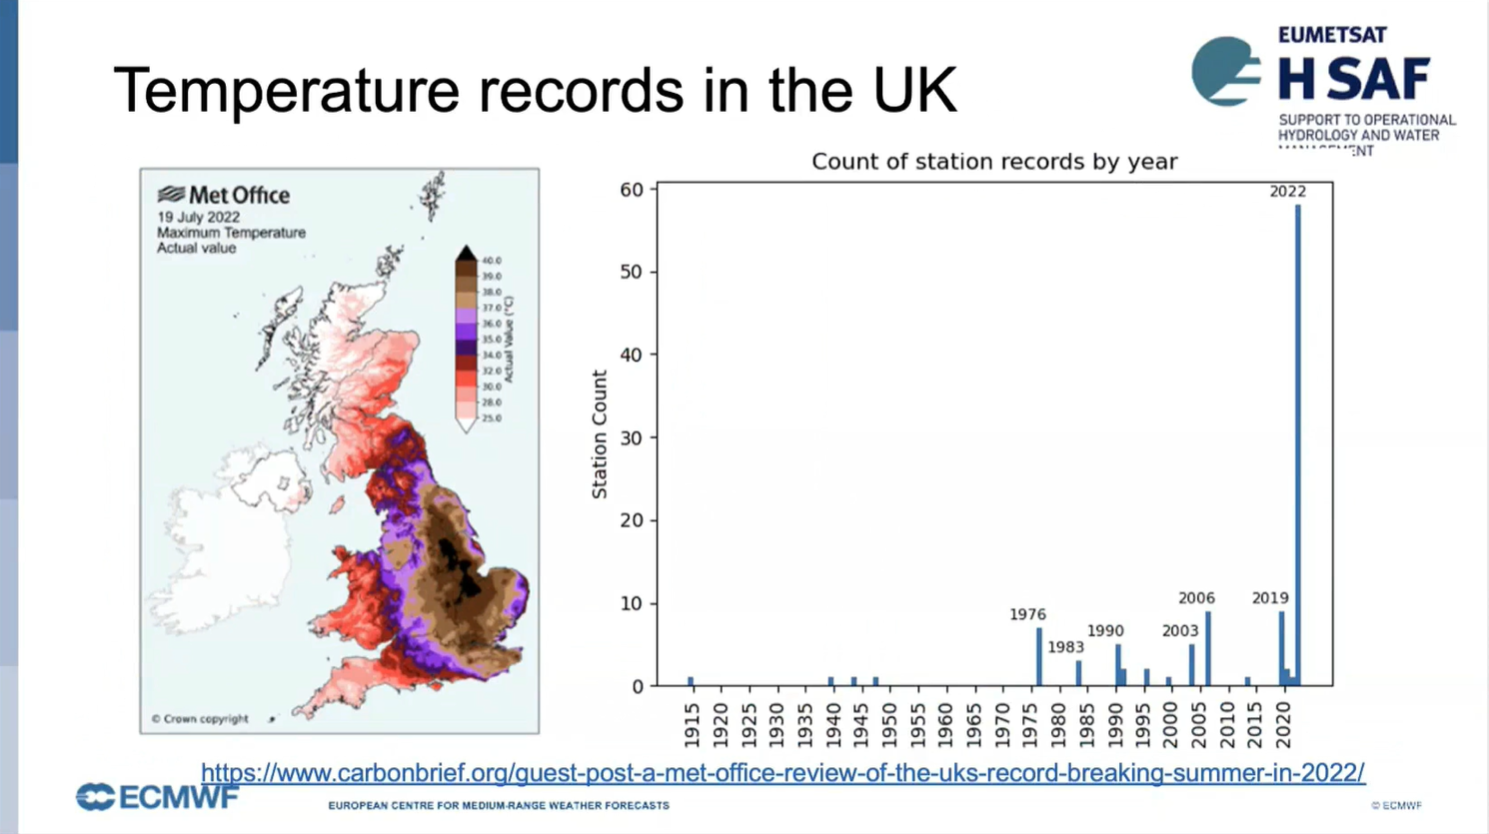
David Fairbairn talks about soil moisture and drought monitoring and using H SAF datasets.
H SAF soil moisture (SM) products are derived from ASCAT C-band backscatter measurements. In this presentation we compare the near-real-time products with long-term data records in order to demonstrate the exceptional severity and extent of recent droughts, including the 2022 summer drought over Europe.
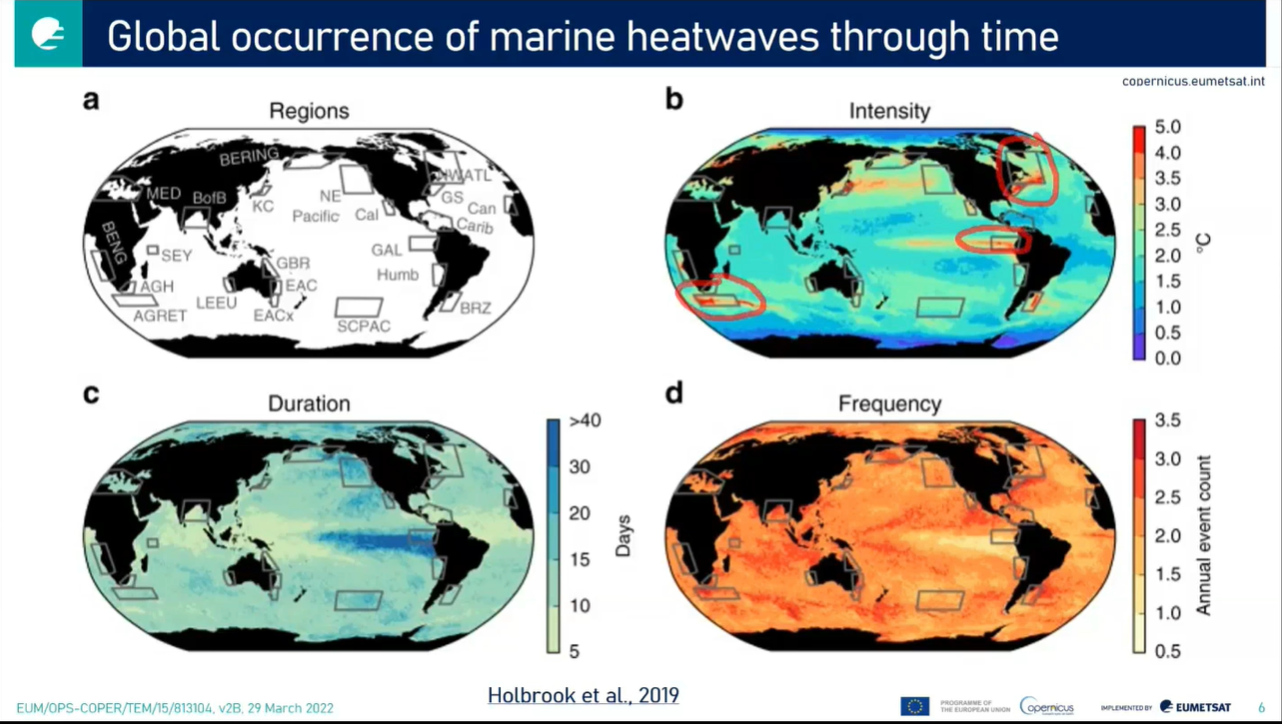
Hayley Evers-King talks about marine heatwaves and using Jupyter Notebooks for satellite data processing and visulization.
Heatwaves don't just happen on land, but also at sea. Periods of extreme regional ocean warming are becoming more frequent and more extreme, affecting our oceans most diverse ecosystems, and those upon which human society depends. In this presentation we'll see how satellite data can be used to identify marine heatwaves, via a practical demonstration in a Python Jupyter Notebook. We'll also consider the connections between heatwaves on land and those that happen at sea.
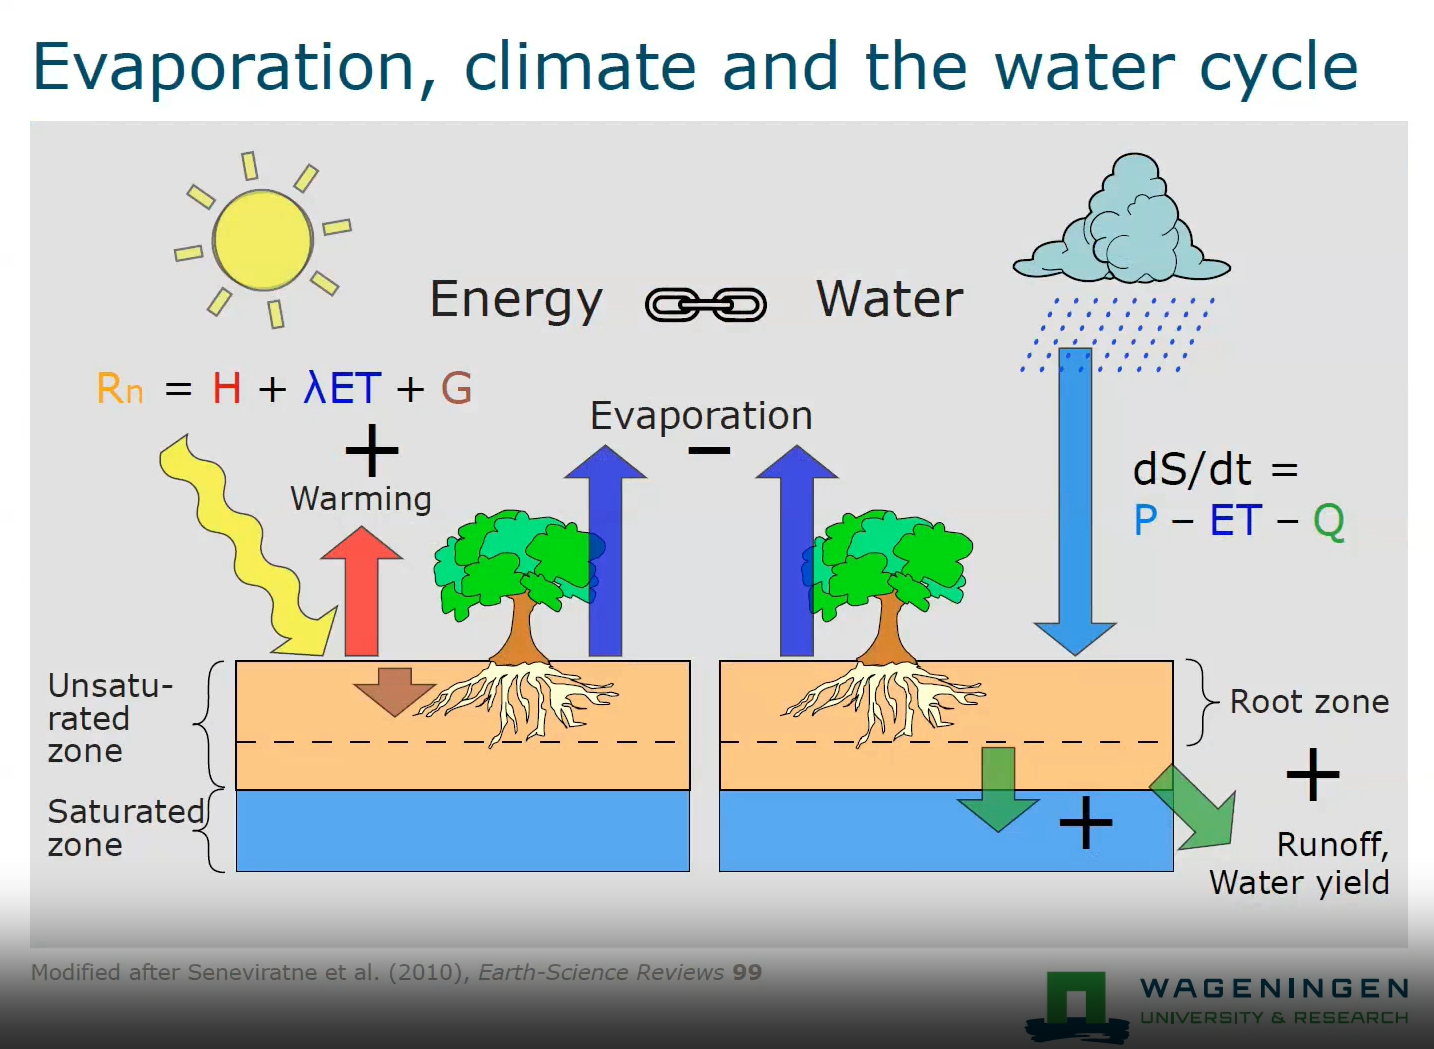
Ryan Teuling talks about soil moisture and land surface energy balance.
Heatwaves and droughts are often strongly linked due to the increased sensible heat fluxes at the land surface warming the atmosphere above. In this talk, I will discuss how soil moisture depletion changes the land surface energy balance, and how the evolution of changes in the land surface energy balance is different for different land cover types (i.e., forest and short vegetation). The use of high-resolution satellite soil moisture data for drought monitoring is also discussed.

Identify and locate moisture features, precipitation types and amounts.
This module teaches you how to use satellite data to observe and analyze atmospheric phenomena. It will show you which products can be used to identify dust storms, smoke, fires, precipitation, etc.
To access the resource click here.
Note: all resources are provided as an external link which redirects you to https://eumetcal.eu where you will need to create a user account in order to gain access to the course
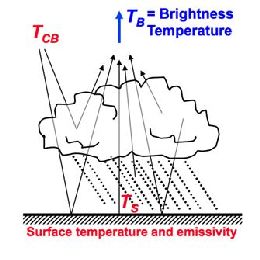
The purpose of the lecture is to provide a necessarily brief overview of the basic physical principles underlying satellite precipitation estimation methods.
The estimation of precipitation from space was attempted almost at the beginning of the satellite meteorology era by establishing a somewhat loose link between visible and infrared imagery of cloud tops and precipitation intensity at the ground. Since the early days estimation methods have qualitatively and quantitatively evolved with the advent of passive microwave sensors first and precipitation and cloud radars more recently. The purpose of the lecture is to provide a necessarily brief overview of the basic physical principles underlying satellite precipitation estimation methods trying to make the audience aware of what the sensors actually “measure” (radiation properties) and how these measurements are converted into precipitation intensity. All the methods, either based on “passive” or “active” sensing, are necessarily indirect and thus a clear understanding of the physics of radiation and of cloud hydrometeors is needed for the correct use of the products. In fact, such understanding helps in identifying the limitations of the existing precipitation products, which are too often used improperly or taken for granted. The lecture will try to pave the way to the in depth lectures of the other instructors on more specific topics of the discipline.
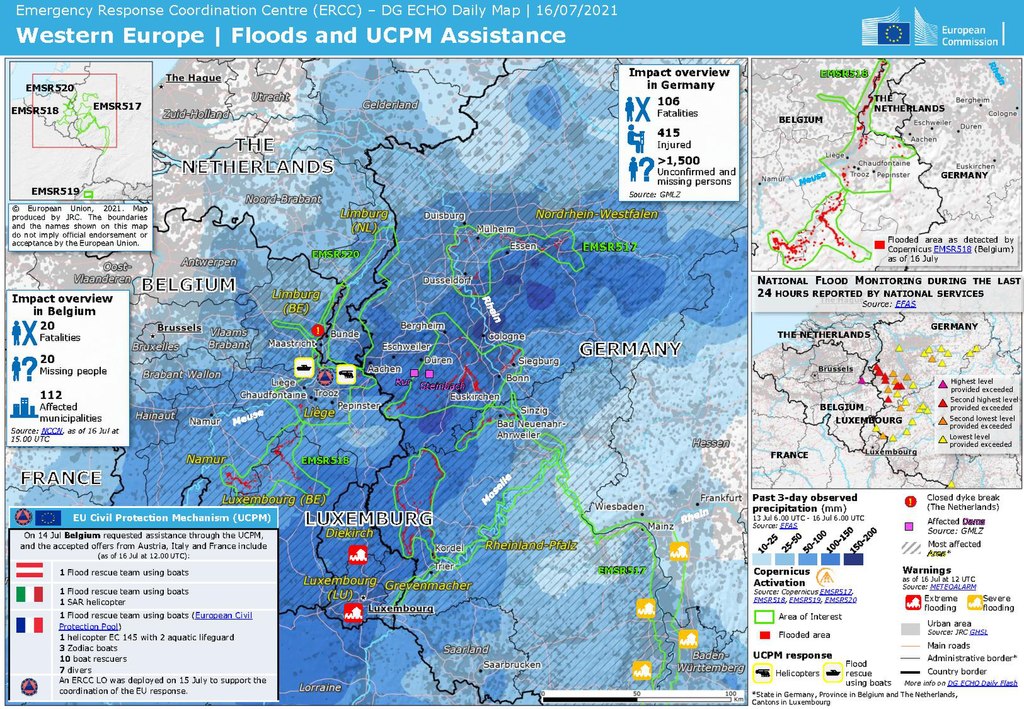
In this training module, you get an overview on the life cycle of Upper-Level-Lows and you will learn more about the impact on local weather.
Upper-Level-Lows (ULLs) are a very common phenomenon in mid-lattitudes. They are usually associated with cold and rainy weather that can last for several days. When they remain stationary over a period of time, the can bring considerable amounts of rainfall locally. This synoptic situation has led in the past to floods and damages in infrastructure as will be show by the example of the Central European Flood in summer 2021.
This training module focusses on the meteorological aspects of ULLs, describes the life-cycle and throws a spottlight on the involved physical processes that accompany this meteorological phenomenon. Each stage of development is exemplified by satellite loops and corresponding NWP parameters. Exercises will help you to check the acquired knowledge.
Peter Salamon provides an overview on EFAS (European Flood Awareness System).
Length: 40 minutes.
The disastrous floods in Elbe and Danube rivers in 2002 confronted the European Commission with non-coherent flood warning information from different sources and of variable quality, complicating planning and organization of aid. In response to this event, the European Commission initiated the development of a European Flood Awareness System (EFAS) to increase the preparedness for floods in Europe.
The aim of EFAS is to gain time for preparedness measures before major flood events strike particularly for trans-national river basins both in the Member States as well as on European level. This is achieved by providing complementary, added value information to the National hydrological services and by keeping the European Response and Coordination Centre informed about ongoing floods and about the possibility of upcoming floods across Europe. Since 2012 EFAS is running fully operational as part of the COPERNICUS Emergency Management Services.
This presentation will provide an overview of the following basic principles employed in EFAS: (1) the use of ensemble predictions in flood forecasting, (2) employing model climatology to derive return period statistics and (3) communication and visualization of uncertain results for decision making. Furthermore, the flash flood predictions as computed in EFAS will be presented.
Further information on EFAS can be found on www.efas.eu.
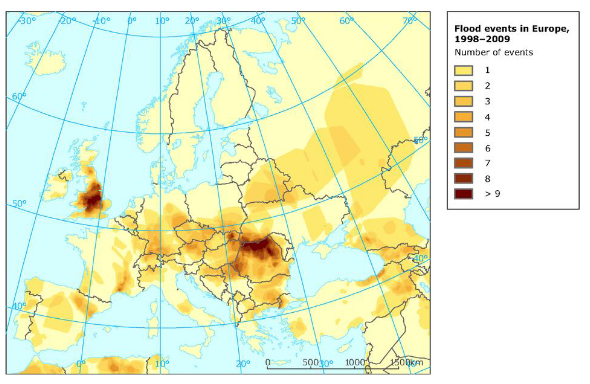
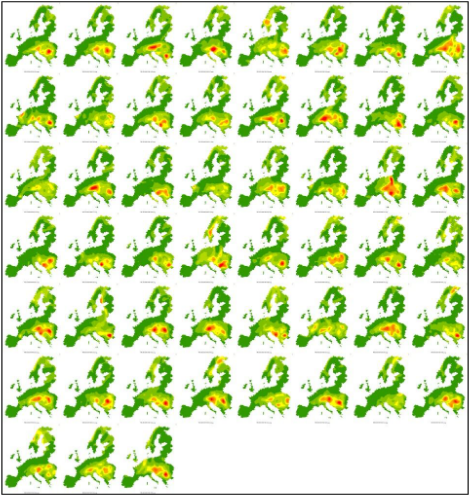
Natasa Strelec Mahovic investigates 5 years of flood events in Europe.
Length: 37 minutes.
In the last decade devastating floods occurred in Europe every year taking lives and causing great damages. In this presentation synoptic situations leading to the largest floods affecting Europe in the last 5 years will be analized. The main idea is to pinpoint the similarities and differences in synoptic patterns in order to improve the forecast of such events.
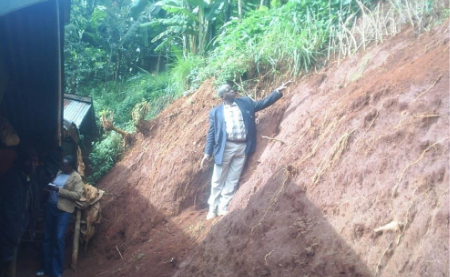
Joseph Kagenyi talks about forecasting land slides in Africa.
Length: 46 minutes.
The monitoring of weather characteristics over the equatorial and tropical regions is well covered with both polar and geostationary satellites hence the satellite becomes a very important instrument on severe weather monitoring and forecasting. The application of multispectral data of MSG in the monitoring the microphysics of clouds such as deep convective clouds with RGB composites provides in-depth understanding in the identification of regions where extremely active storms are located. The use of Multi sensor Precipitation estimate (MPE) also helps in the estimation total of accumulated rainfall on each region during the storm period. Such areas can easily be monitored and the possibility of excess rainfall within a day can be evaluated and such information is used to issue a warning for evacuation, or for support to the potential victims on these areas.
In short RGB composites, MPE Estimates, and the accumulated rainfall on daily basis becomes effective tools of landslide forecasting. We also add the NWP products particularly the High resolution (7 km) COSMOS data and NCEP CPC data as it gives a forecast with indications of possibly of heavy storms. However with satellite data you are able to ascertain which areas would the forecast show excess impact on the ground. The NWP products are used to help in creating accumulated rainfall values (estimates) necessary in establishing the threshold values for remote areas where station gauge data is not available.