
Identify and interpret fields and derived products

The monthly meetings (2020 - 2021) inform trainers about the MTG satellites, their onboard instruments, data, case studies, products, proxy data that can be used and everything connected to the training topic. The meetings were mainly intended for trainers, but the recordings are available to anyone.
Topics from this meeting: Fire Temperature RGB Quick Guide, QG Templates, Case studies.
Meeting 7 September 2020 - 60 min

The monthly meetings (2020 - 2021) inform trainers about the MTG satellites, their onboard instruments, data, case studies, products, proxy data that can be used and everything connected to the training topic. The meetings were mainly intended for trainers, but the recordings are available to anyone.
Topics from this meeting: Cloud Type RGB, Cloud Phase RGB, Case studies.
Meeting 8 June 2020 - 15 min

The monthly meetings (2020 - 2021) inform trainers about the MTG satellites, their onboard instruments, data, case studies, products, proxy data that can be used and everything connected to the training topic. The meetings were mainly intended for trainers, but the recordings are available to anyone.
Topic from this meeting: Cloud Type RGB Quick Guide.
Meeting 4 May 2020 - 25 min

The monthly meetings (2020 - 2021) inform trainers about the MTG satellites, their onboard instruments, data, case studies, products, proxy data that can be used and everything connected to the training topic. The meetings were mainly intended for trainers, but the recordings are available to anyone.
Topics from this meeting: EUMETSAT MTG Training, 1.38 μm channel guide, Cloud Type RGB guide, Case studies.
Meeting 2 March 2020 - 49 min
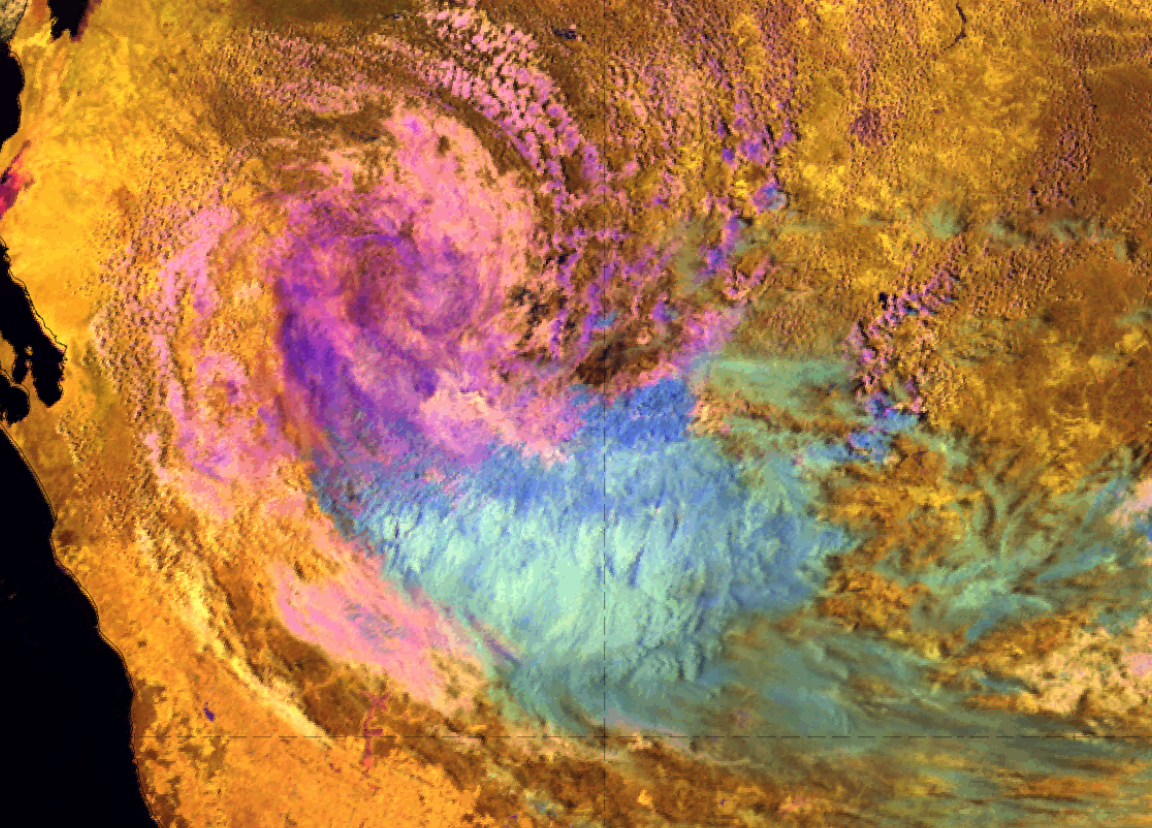
A collection of cases and colour interpretations derived from MTG proxy data from satellites such as GOES and Himawari.
Author(s): Marko Blaskovic
A developed convective system in Australia shows different cloud phases in a beautiful way, enabling the analysis of each part of the cloud using the Cloud Phase RGB product from the Himawari satellite.
Enter here.
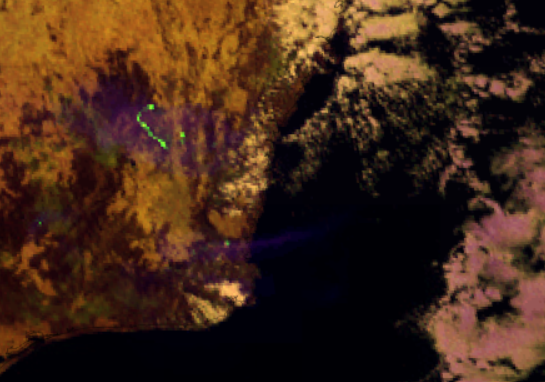
A collection of cases and colour interpretations derived from MTG proxy data from satellites such as GOES and Himawari.
Author(s): Marko Blaskovic
How to see and analyse fires using Cloud Phase RGB? What are the key channels in the RGB that help us do that?
Enter here.
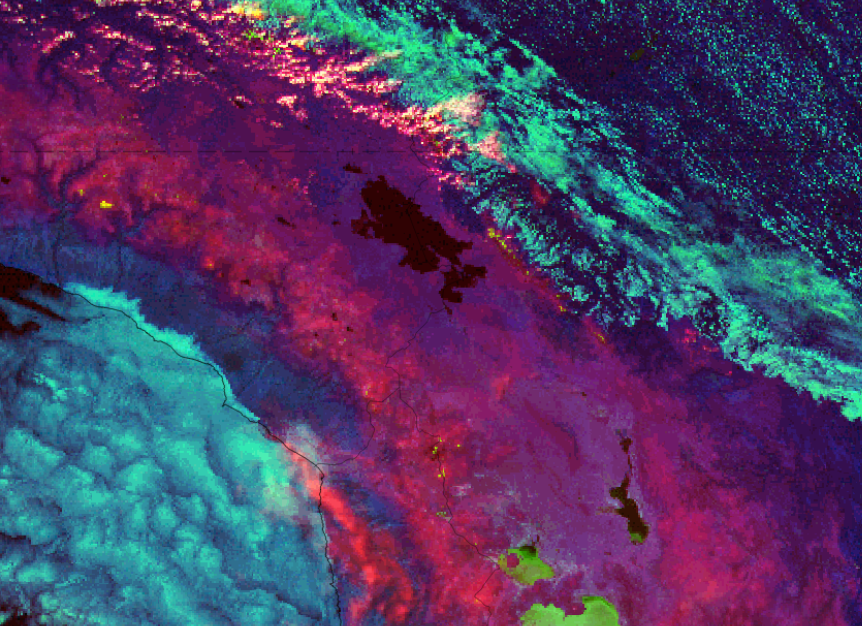
A collection of cases and colour interpretations derived from MTG proxy data from satellites such as GOES and Himawari.
Author(s): Marko Blaskovic
A case describing the differences between the two surface features using the Cloud Phase RGB and the Cloud Type RGB.
Enter here.
Boštjan Muri introduces LSA SAF vegetation and fire products through different showcases and presents a Jupyter notebook exercise on accessing and understanding the Fire Radiating Power (FRP) data.
The operational use of LSA SAF vegetation and Fire Radiative Power (FRP) satellite products derived from Meteosat observations is presented. Vegetation products are processed and analysed using Jupyter Notebooks, enabling reproducible workflows for data handling, visualisation and analysis. The examples demonstrate how processing of vegetation products supports vegetation monitoring and analysis for agrometeorology, forestry and environmental applications, linking satellite observations with operational services.
For wildfire monitoring, a Jupyter Notebook–based tutorial is presented, analysing fire activity using LSA SAF FRP products from the MSG/SEVIRI and MTG/FCI sensors. The tutorial demonstrates data access, preprocessing and statistical analysis of high-confidence FRP observations, including full-disc overviews, temporal aggregation, spatial mapping and inter-sensor comparison. Selected case studies illustrate detailed fire analysis and differences between the sensors. The provided Jupyter Notebook materials are suitable for both basic and more advanced users. You can find the Jupyter Notebook files in the Jupyter Notebook instructions.
Julian Meyer-Arnek, by using the wildfire example, explains how to access atmospheric data and analyse it with SpatioTemporal Asset Catalogue (STAC) and Jupyter Notebooks.
Trace gas column information derived from Metop/GOME-2 instruments provides comprehensive insight into fire episodes by analysing the resulting trace gas plume downwind of the fires. This demonstration focuses on the fast and simplified discovery and access to the AC SAF Level 3 trace gas information via state-of-the-art machine-to-machine interfaces (SpatioTemporal Asset Catalogue, STAC) and their time-series analysis using Jupyter Notebooks.
Download Jupyter Notebook and Instructions
Maria Putsay discusses convective clouds that form over wildfires, focusing on Pyrocumulonimbus clouds and their detection in satellite imagery.
Pyrocumulonimbus (pyro-Cb) clouds can form above wildfires. These are fire-aided or fire-caused convective clouds with considerable vertical development. Large amounts of smoke particles are injected into these clouds. The increased number of condensation nuclei causes extremely small ice crystals on the cloud tops. That is why the typical colors of these clouds vary in several RGBs. The cloud top color may help to identify pyro-Cb clouds, which might be dangerous by causing extreme low-level winds, and hence increasing fire spread.
Pedro Venâncio introduces the Portuguese Rural Fire Information System (SIFOR) and demonstrates how the GeoSIFOR WebGIS enables users to easily access, visualise and interpret available data.
SIFOR is an integrated application ecosystem designed to centralize and share technical information across Portugal’s Integrated Rural Fire Management System (SGIFR). Within this ecosystem, GeoSIFOR acts as a user-friendly Geographic Information Viewer (WebGIS) that allows users without specialized knowledge in GIS or remote sensing to easily leverage geographic and satellite data. Through its agile interface, non-expert users can access complex information, for instance, from the Copernicus Data Space Ecosystem (CDSE), Eumetsat, LSA-SAF, NASA, as well as satellite-derived products processed by other public entities such as DGT and IPMA.
Francesca Di Giuseppe discusses ECMWF fire prediction systems and the advantages of SPARKY, a new data-driven system for predicting fire activity and burned area.
Traditional fire danger indices estimate environmental conditions conducive to fire but do not directly predict when and where fires will occur. This presentation introduces a shift toward fire activity forecasting, using data-driven approaches that integrate weather, fuel conditions, and ignition sources. By leveraging machine learning and Earth observation data, these systems provide probabilistic forecasts of actual fire occurrence and spread. The approach improves early warning capabilities, reduces false alarms in fuel-limited regions, and offers actionable information for fire management, supporting more effective preparedness, response, and long-term risk mitigation strategies.