
Identify and interpret fields and derived products
Boštjan Muri introduces LSA SAF vegetation and fire products through different showcases and presents a Jupyter notebook exercise on accessing and understanding the Fire Radiating Power (FRP) data.
The operational use of LSA SAF vegetation and Fire Radiative Power (FRP) satellite products derived from Meteosat observations is presented. Vegetation products are processed and analysed using Jupyter Notebooks, enabling reproducible workflows for data handling, visualisation and analysis. The examples demonstrate how processing of vegetation products supports vegetation monitoring and analysis for agrometeorology, forestry and environmental applications, linking satellite observations with operational services.
For wildfire monitoring, a Jupyter Notebook–based tutorial is presented, analysing fire activity using LSA SAF FRP products from the MSG/SEVIRI and MTG/FCI sensors. The tutorial demonstrates data access, preprocessing and statistical analysis of high-confidence FRP observations, including full-disc overviews, temporal aggregation, spatial mapping and inter-sensor comparison. Selected case studies illustrate detailed fire analysis and differences between the sensors. The provided Jupyter Notebook materials are suitable for both basic and more advanced users. You can find the Jupyter Notebook files in the Jupyter Notebook instructions.
Julian Meyer-Arnek, by using the wildfire example, explains how to access atmospheric data and analyse it with SpatioTemporal Asset Catalogue (STAC) and Jupyter Notebooks.
Trace gas column information derived from Metop/GOME-2 instruments provides comprehensive insight into fire episodes by analysing the resulting trace gas plume downwind of the fires. This demonstration focuses on the fast and simplified discovery and access to the AC SAF Level 3 trace gas information via state-of-the-art machine-to-machine interfaces (SpatioTemporal Asset Catalogue, STAC) and their time-series analysis using Jupyter Notebooks.
Download Jupyter Notebook and Instructions
Maria Putsay discusses convective clouds that form over wildfires, focusing on Pyrocumulonimbus clouds and their detection in satellite imagery.
Pyrocumulonimbus (pyro-Cb) clouds can form above wildfires. These are fire-aided or fire-caused convective clouds with considerable vertical development. Large amounts of smoke particles are injected into these clouds. The increased number of condensation nuclei causes extremely small ice crystals on the cloud tops. That is why the typical colors of these clouds vary in several RGBs. The cloud top color may help to identify pyro-Cb clouds, which might be dangerous by causing extreme low-level winds, and hence increasing fire spread.
Pedro Venâncio introduces the Portuguese Rural Fire Information System (SIFOR) and demonstrates how the GeoSIFOR WebGIS enables users to easily access, visualise and interpret available data.
SIFOR is an integrated application ecosystem designed to centralize and share technical information across Portugal’s Integrated Rural Fire Management System (SGIFR). Within this ecosystem, GeoSIFOR acts as a user-friendly Geographic Information Viewer (WebGIS) that allows users without specialized knowledge in GIS or remote sensing to easily leverage geographic and satellite data. Through its agile interface, non-expert users can access complex information, for instance, from the Copernicus Data Space Ecosystem (CDSE), Eumetsat, LSA-SAF, NASA, as well as satellite-derived products processed by other public entities such as DGT and IPMA.
Francesca Di Giuseppe discusses ECMWF fire prediction systems and the advantages of SPARKY, a new data-driven system for predicting fire activity and burned area.
Traditional fire danger indices estimate environmental conditions conducive to fire but do not directly predict when and where fires will occur. This presentation introduces a shift toward fire activity forecasting, using data-driven approaches that integrate weather, fuel conditions, and ignition sources. By leveraging machine learning and Earth observation data, these systems provide probabilistic forecasts of actual fire occurrence and spread. The approach improves early warning capabilities, reduces false alarms in fuel-limited regions, and offers actionable information for fire management, supporting more effective preparedness, response, and long-term risk mitigation strategies.
Ivan Smiljanić presents the evolution of RGB composites used for fire detection, with a final focus on the MTG Day Land Cloud Fire RGB composite and its advantages.
The Day Land Cloud/Fire RGB (full name) is a composite designed to enhance the detection of surface features and clouds, in addition to wildfires. Compared to other fire-focused composites, it provides a more balanced depiction of smoke, vegetation, and burn scars in a single product, though with reduced ability to discriminate fire intensity or even cloud phase. It renders active fires more vividly in red while preserving a near-natural background appearance. It is particularly effective for integrated situational awareness rather than specialized analysis.
Rita Durão explains the FRP's potential as an early smoke indicator and shows the connection with higher air pollutant emissions.
The intensity of a wildfire can be assessed by integrating fire radiative power (FRP) measurements over time. Since FRP is proportional to the amount of burned biomass, higher FRP values are associated with more severe fires, with higher smoke levels and, consequently, higher air pollutant emissions. Thus, the goal of this work is to assess FRP's potential as an early smoke indicator, leveraging the very high-resolution MTG data (10-minute temporal resolution). PMx and CO emitted during the August 2025 wildfires in Iberia are analyzed to illustrate the relationship between air pollutant levels and fire intensity over the affected areas.
Emilio Chuvieco presents data sets and products generated by the ESA FireCCI programme.
The presentation is about the set of burned area products derived from the European Space Agency's Climate Change Programme. They include a Sentinel-3 SYN global product, generated from 2019 until present, at 300 m resolution; a Terra-MODIS-based 250 m product generated from 2001 to 2022, and a high-resolution global mosaic based on Sentinel-2 MSI images for 2023. All products have been statistically validated using higher resolution images and are used for different applications, including fire emissions and the impact of burning on tropical deforestation.
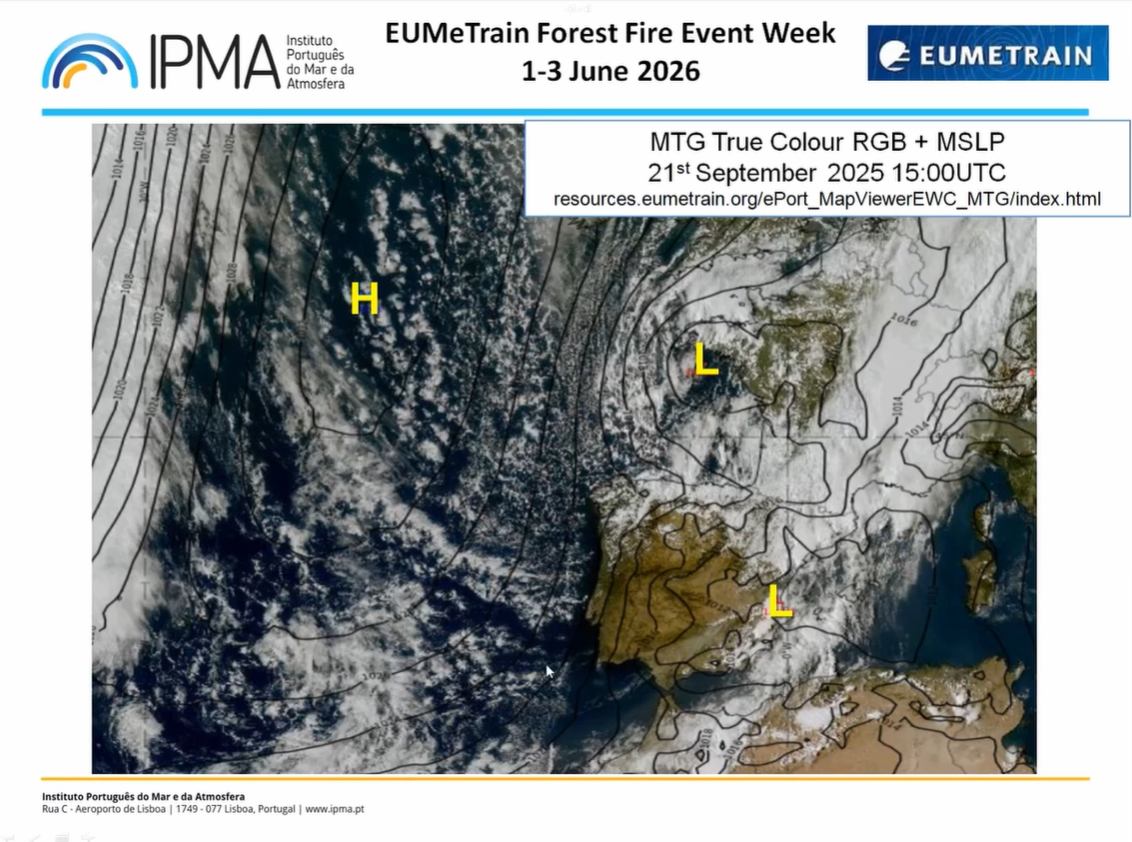
Bruno Café introduces satellite products used by operational forecasters for fire detection and monitoring, using the 2025 Portugal fire event as a case study.
This presentation explores the enhanced capabilities of the Flexible Combined Imager (FCI) sensor on board Meteosat-12 (MTG) for forest fire detection and monitoring. By leveraging better spectral, temporal, and spatial resolutions, we demonstrate how new RGB composites, specifically Fire Temperature and True Color RGBs, provide critical advantages in identifying hotspots, smoke plumes, and burn scars.
Sven-Erik Enno introduces the LI instrument and its use for fire detection, while Andrea Meraner provides a data analysis example of a fire related to lightning.
The Meteosat Third Generation (MTG) Lightning Imager (LI), declared operational on October 31, 2024, is a new European Instrument devoted to the real-time monitoring and characterization of lightning activity over Europe, Africa, the eastern part of South America, and a large portion of the Atlantic Ocean. This presentation will demonstrate LI's observational capabilities from hemispherical climatological statistics to local-scale forest fire events. In addition, we show examples of lightning-ignited fires as observed by LI and FCI, the multispectral imager onboard MTG.
Edouard Martins gives a brief introduction on the work of EUMETSAT and then focuses on monitoring thermal hotspots with Sentinel satellites.
EUMETSAT Central Facility (CF) is entrusted by the European Commission for the operational detection and monitoring of high thermal spots (wildfires, gas flares, volcanoes) from the Sentinel-3 (S3) satellites in Near Real Time (NRT), with emergency timeliness. The Copernicus S3 NRT Fire Radiative Power (FRP) observes global wildfires between 500 m and 1 km resolution, both at night and during the day. The public product is today under testing by the two Copernicus services dedicated to atmosphere monitoring and emergency management (CAMS and CEMS). Additionally, it is being completed by NRT quantification of pollutant observation from the Sentinel Constellation (S3 currently, S4 and S5 later on).
Anu-Maija Sundstrom talks about atmospheric composition data used to monitor emissions from forest fires.
This presentation provides an introduction to satellite-based observations of atmospheric emissions from fires provided by AC SAF. It highlights key satellite products used to detect and monitor fire-related pollution, including the Absorbing Aerosol Index from GOME-2 for identifying smoke plumes, carbon monoxide (CO) observations from IASI, and the potential use of other trace gases, including GOME-2 NO₂. Together, these measurements offer complementary insights into the composition, distribution, and evolution of fire emissions, supporting air quality monitoring.