
NWP skills for operational meteorologist
Listed here are other resources related to "NWP skills for operational meteorologist" tag:
Note: click on an image to open the Resource
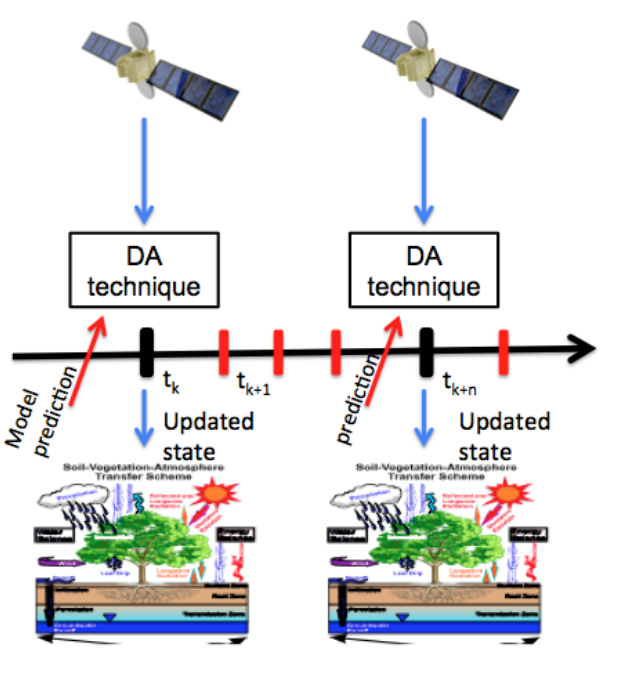
Simone Gabellani and Fabio Delogu describe how satellite soil moisture can be used in hydrological modelling trough data assimilation.
Length: 37+27 minutes.
The reliable estimation of hydrological variables in space and time is of fundamental importance in hydrology to improve the flood predictions and hydrological cycle description. Nowadays remotely sensed data can offer a chance to improve hydrological models especially in environments with scarce ground-based data. The presentation describes how satellite soil moisture can be used in hydrological modelling trough data assimilation.
Estibaliz Gascon presents the IFS ensemble forecasts from ECMWF that provides an instantaneous precipitation type output variable.
Length: 37 minutes.
One of the greatest difficulties facing forecasters during the cool season is the correct determination of precipitation type, especially with temperatures close to freezing point. There are numerous sources of uncertainty in precipitation type forecasts which is why mixed phases are not well predicted. These uncertainties are difficult to reduce but can potentially be quantified by the use of ensembles.
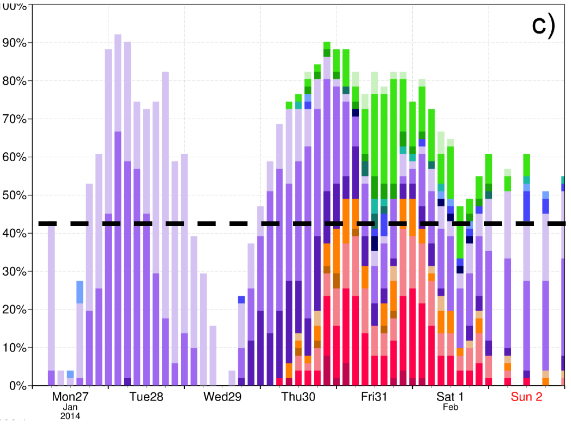
The Integrated Forecast System (IFS) ensemble forecasts (ENS) from ECMWF provide an instantaneous precipitation type (ptype) output variable that describes 6 types of precipitation at the surface: rain, freezing rain, snow, wet snow, sleet or ice pellets (plus dry). As part of ECMWF's contribution to the ANYWHERE European project, two new products were developed. These are the most probable precipitation type, shown on map format, and the instantaneous probabilities of different types, shown for a given site. The first of these shows which type is most probable whenever the probability of some precipitation is >50%. The second product depicts the temporal evolution of probabilities for a specific location in bar chart format, classified also according to three categories of instantaneous precipitation rate. These new instantaneous probabilistic products will be shown through an experiment reproducing the freezing rain case study in Slovenia in 2014.
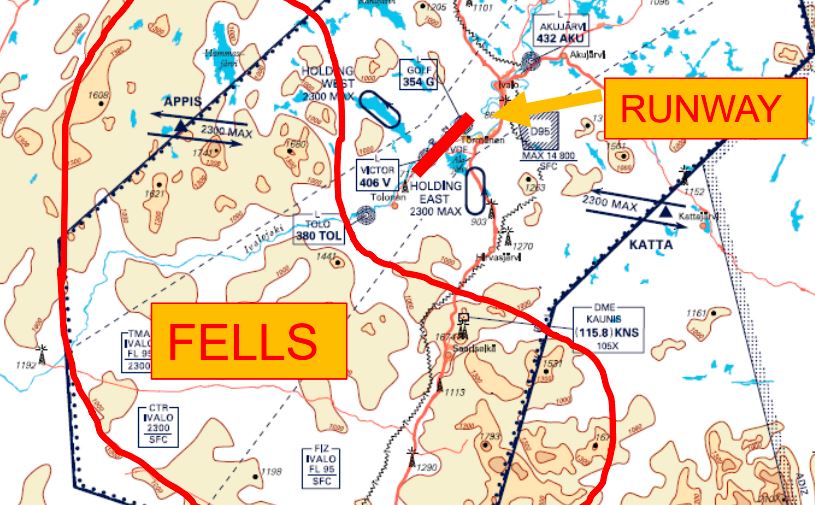
Elina Tuhkalainen treats the formation and dissipation of fog at airports in Finland.
Length: 35 min
Author: Elina Tuhkalainen (FMI)
In this presentation formation and dissipation of fog and stratus will be treated. The presenters will also address how these phenomena occur around the year and how they affect the services at the airports in Finland.
The presentation shows a possibility of turbulence diagnostics with aid of the Turbulence Kinetic Energy (TKE).
Length: 50 min
Author: André Simon, Péter Salavec (OMSZ)
Turbulence is a hazardous weather phenomenon for aviation and a challenge for a forecaster. It is typically a small-scale phenomenon and its direct observations and measurements are relatively sparse, except of the surface layer of the atmosphere. The presentation shows a possibility of turbulence diagnostics with aid of the Turbulence Kinetic Energy (TKE) calculated from a high-resolution non-hydrostatic model AROME. This parameter is calculated from a prognostic equation and it is only rarely applied as an end-product in operational forecasting. We studied the distribution of TKE in various meteorological situations, with focus on the Visual Flight Rules (VFR) conditions. Both advantages and limits of the TKE diagnostics are discussed. High attention is also given to forecasting of mountain waves, which can have both positive and negative impact on the flight. A development work based on this theory is in progress at the Unit of Aviation Meteorology resulting in new products for the mountain wave gliding branch of sport aviation.
Alexander Jann and Andreas Wirth present the new aviation products of ASII-NG (Next Generation).
Length: 30 min
Author: Alexander Jann, Andreas Wirth (ZAMG)
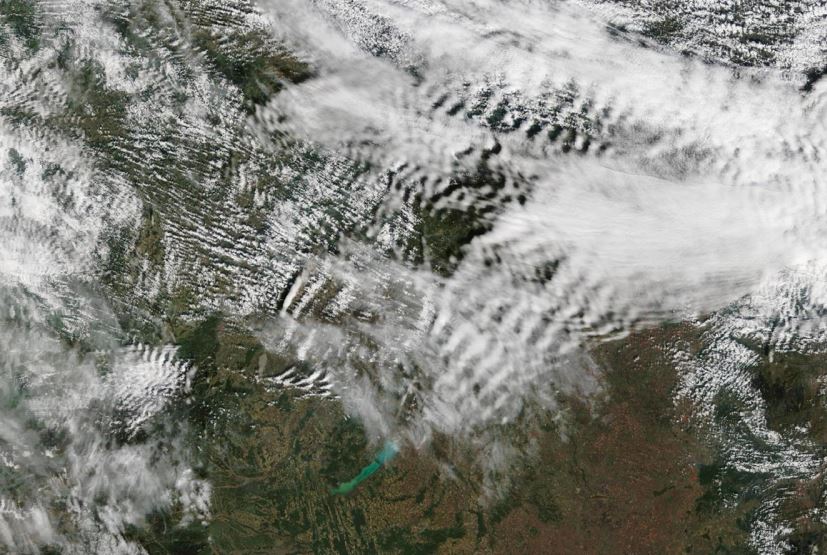
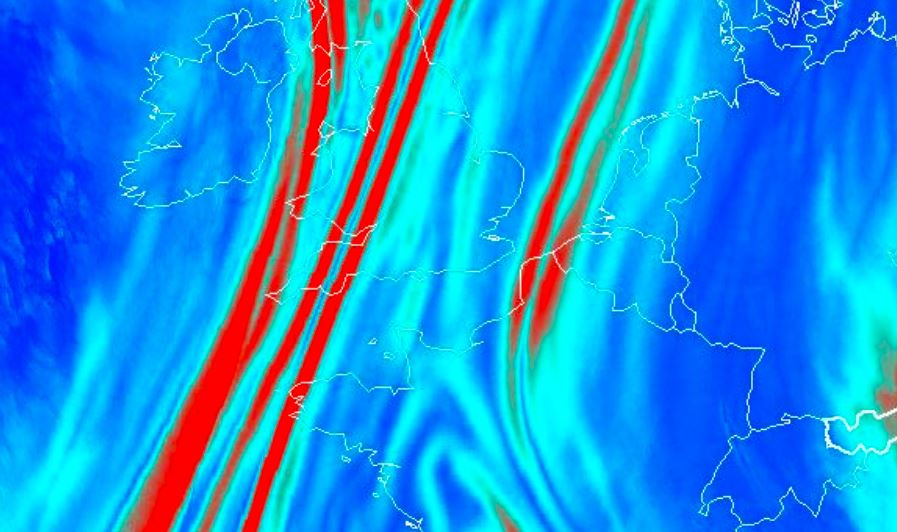
Two new satellite-derived products related to turbulence analysis have been developed recently in the frame of the Nowcasting-SAF. The first product (ASII-GW”Automatic Satellite Image Interpretation – Gravity Waves”) objectively detects grating patterns in the water vapor 7.3 imagery which point to the presence of gravity waves. The second product (ASII-TF “Automatic Satellite Image Interpretation – Tropopause Folding”) identifies the location of tropopause folds from satellite and NWP data. The algorithm is based on the logistic regression method.
In this presentation, we will talk about the selected algorithms and present cases from the official Nowcasting-SAF validation reports (to be released shortly) to illustrate the product performance.
Peter Schmitt analyses the different aspects of CAT and presents a CAT forecasting method.
Length: 40 min
Author: Peter Schmitt (DWD)
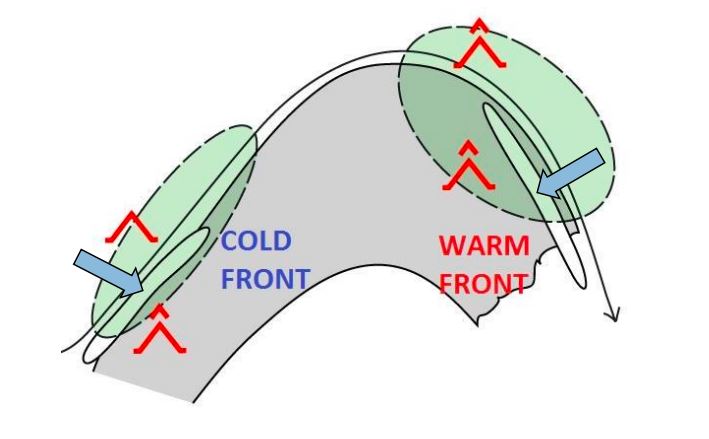
Clear air turbulence (CAT) is the term for medium- or high-level turbulence in regions with significant wind shear. CAT is an important factor for the aviation safety.
In the first part of the presentation, I will show you typical parts of CAT in relation with the 300 hPa geopotential analysis. Furthermore you get an overview to the correlation between CAT and characteristic cloud patterns in satellite images. In many cases satellite images provide the first clue or a confirmation for the presence auf CAT.
The second part is dedicated the forecast of CAT in Deutscher Wetterdienst (DWD) with the ICON model. DWD has been applying a forecast method based on Eddy Dissipation Rate (EDR). This real property of atmospheric turbulence is the main sink term of Turbulent Kinetic Energy. In a case study you will see the typical working process in practice with consideration of the model output, typical cloud pattern in satellite image and the use of the conceptual model and the structure of geopotential field.

Ab Maas shows which items are of main importance for balloon forecast e.g. accurate wind forecasts, starting and dying out of thermals and convection.
Length: 60 min
Author: Ab Maas (former KNMI)
Aviation meteorology is a wide field in terms of forecasting and forecasting product. Not only is there a big difference between the civil aviation part and General Aviation (GA), but also in GA there are a lot of specific customers who needs specific forecasts; VFR forecasts for small planes, gliding, paragliding, ultra-lights, ballooning etc.
Ballooning forecasts can also differ, e.g. the commercial balloonists need other forecasts than balloonists in competitions and championships and gas balloons can fly in weather circumstances where it is impossible for hot air balloons.
In the presentation it will be shown which items are of main importance for balloon forecast e.g. accurate wind forecasts, starting and dying out of thermals and convection. And also how surface observations, radio soundings, satellite and radar can be of help.
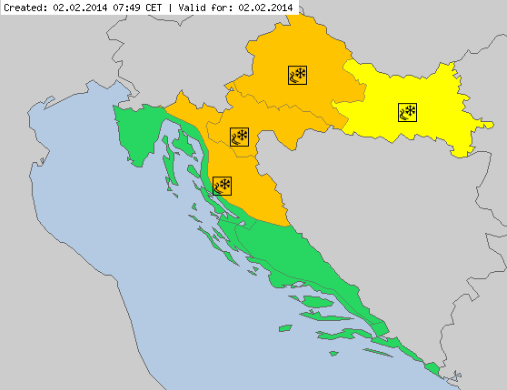
Lovro Kalin focusses on the prediction of freezing rain as an essential factor in road weather forecast.
Length: 26 minutes.
Freezing rain is a relatively complex phenomenon, with rare occurrence but often related to serious damages and threats. With only few tools available, it has always been a strong challenge for the operational forecasters - in terms of appearance, intensity and impacts. Croatia - as well as Slovenia and Hungary - experienced an extreme and disastrous event in winter 2014, with several hundreds million Euro damage, and temporal collapse of the traffic and energy system.
This paper presents recent developments and experiences in freezing rain operational forecasting. A major tool used recently is the new 'precipitation type' product provided by ECMWF, and so far with overall very good performance. It is accompanied by other diagnostic tools defined in the Croatian Hydrological and Meteorological Service. Several recent cases will be presented, and experiences and forecast performance will be discussed.
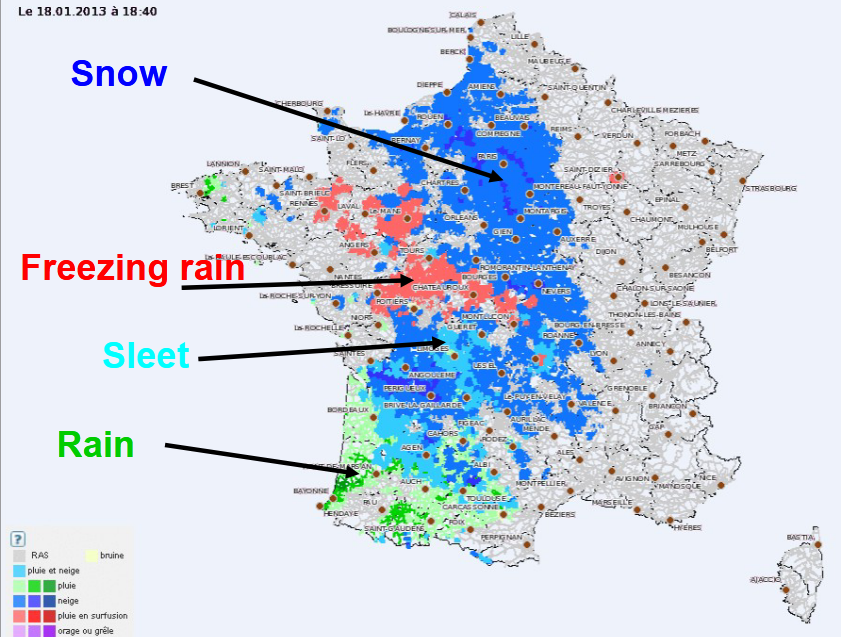
Three different approaches to forecast road weather at Meteo-France are presented.
Length: 36 minutes.
During winter, snow or ice presence on the road might have serious consequences on road traffic and security and many efforts were done for several years to develop decision-making tools for road management in winter. For this purpose, Météo-France uses, in an operational way a specific system dedicated to the road weatherforecast.
The first one, OPTIMA is a high-frequency (5 min) nowcasting system providing 1 hour forecasting and based on data fusion approach. It is dedicated to real time and short range anticipation of road impacting phenomenon. It was specially developed to work at the road network resolution (5km).
The data OPTIMA uses for the forecast process:
- Radar observation and nowcasting
- Surface observation network and road weather stations observations from customers
- Best available weather forecast (i.e. expertized by human forecasters)
- Specific road weather forecast
As an input for this decision-making tool, Météo-France uses numerical road models, which permit to simulate the behavior of a road under the influence of atmospheric conditions and the behavior of the snow on the road. Since 2012, road models are forced by human expertized atmospheric forecast instead of a direct coupling with numerical weather prediction models. Thissystems, called PEIR (Expertise Predictions for ISBA-Route), are the basis of road conditions forecasting products for French road managers.
Since the beginning of operational road weather forecast in Météo-France, all the products were based on deterministic forecasts, however since 2018/2019 winter, a new approach is tested, based on ensemble forecast.
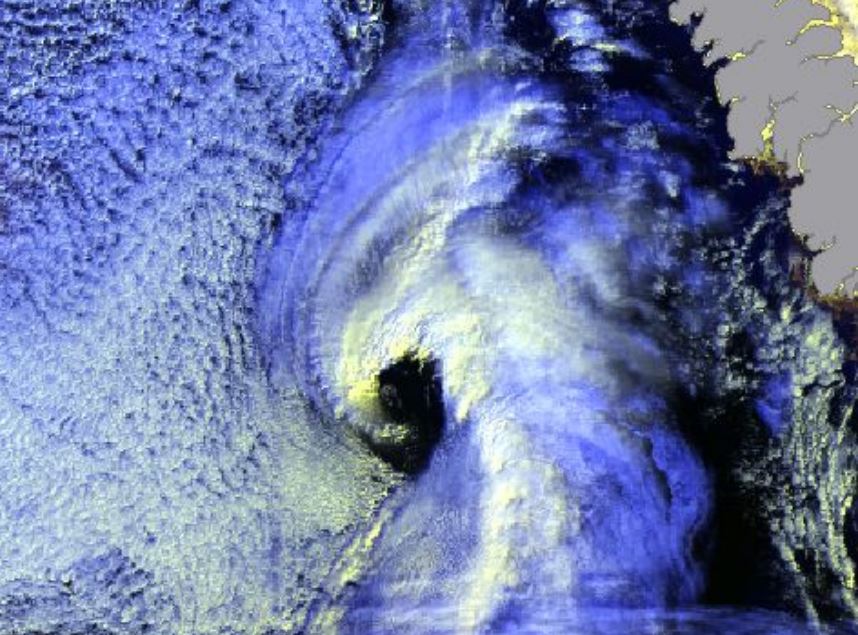
Gunnar Noer presents facts on Polar Lows, how they are forecasted, and gives examples of interpretation of satellite imagery.
Length: 55 min
Author: Gunnar Noer (MetNo)
Polar Lows can be seen as small Arctic hurricanes, and they have a severe impact on shipping and coastal communities in Scandinavia. They are most common in the Barents Sea and the Norwegian Sea, but are also known to occur in the central North Sea and surrounding coastal areas. Polar lows are the most intense type of wintery convection weather phenomenon in this area. Thus, a familiarity with Polar Lows will also increase our ability to forecast the more common snow shower events in the winter season. This talk will present some facts on Polar Lows, how they are forecasted, and give examples of interpretation of satellite imagery.
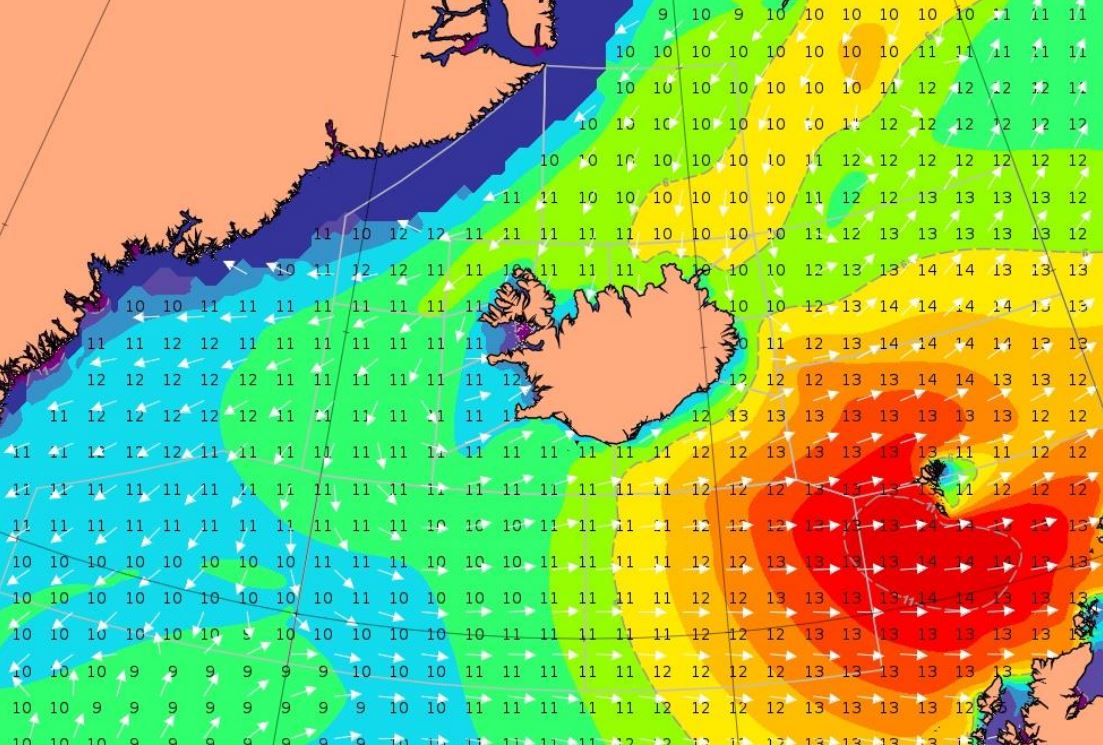
Björn Einarsson analyzes a storm moving south-east of Iceland.
Length: 30 min
Author: Björn Einarsson
Case 1. Between April 2. and April 4. 2018, gale to storm force winds from the west propagated from Cape Farewell, the southernmost point of Greenland over 1000 nautical miles across the Atlantic towards and past the Faroes Islands with high waves. This type of eastward wind/wave field propagation south of Iceland happens few times a year with varying intensity. Case 2. A showcase of the westerly Greenland tip jet creating large waves – but looking at the forecasted winds and waves versus observations, they seem contradictory, making the forecaster think twice.
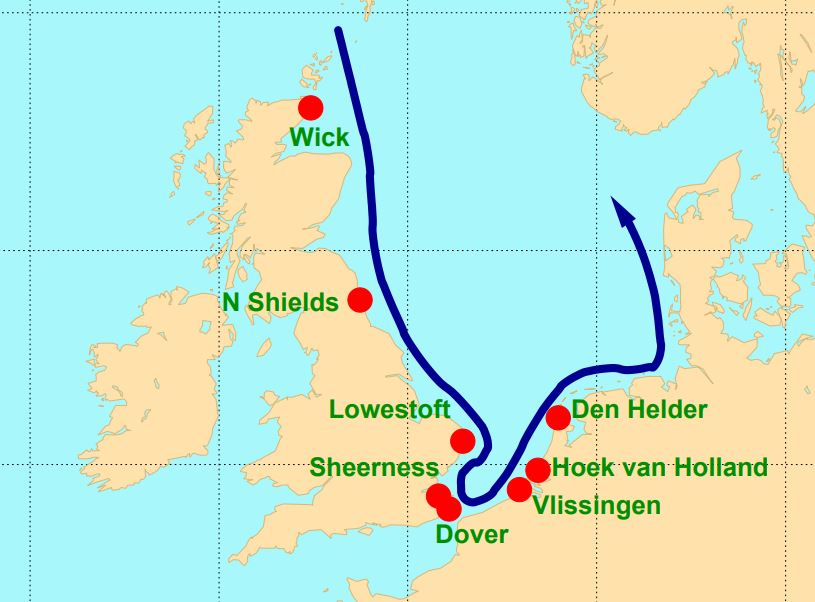
Hans De Vries focusses in his presentation on the situation in The Netherlands, where storm surge forecasts are generated by WMCN and KNMI.
Length: 45 min
Author: Hans de Vries (KNMI)
Several countries along the North Sea have densely populated areas and major political and economic activities close to the coast - places that are vulnerable to storm surges. To protect these areas coastal defence requires continuous attention. Several storm surge barriers have been constructed over the last decades that can be closed if the water level rises too high. Examples are the Thames Barrier in London and the Maeslantkering near Rotterdam. To alert local authorities and to operate the movable barriers efficiently, good and timely storm surge forecasts are essential. These forecasts make use of state-of-the-art meteorological forecasts and techniques like ensemble forecasting. This presentation will focus on the situation in The Netherlands, where storm surge forecasts are generated in close cooperation between the Water Management Centre Netherlands (WMCN) of Rijkswaterstaat and the Royal Netherlands Meteorological Institute (KNMI).