
NWP skills for operational meteorologist
Listed here are other resources related to "NWP skills for operational meteorologist" tag:
Note: click on an image to open the Resource
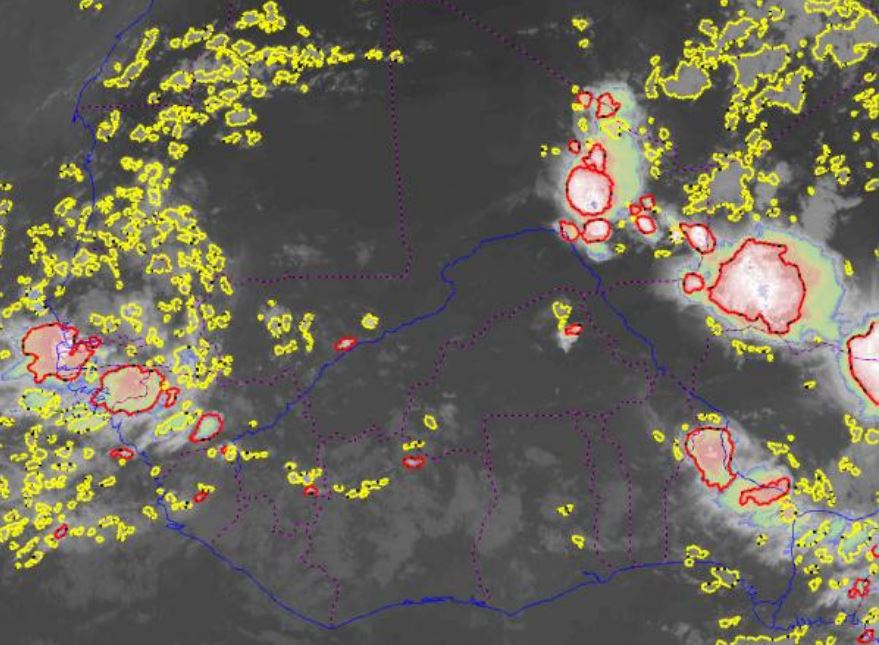
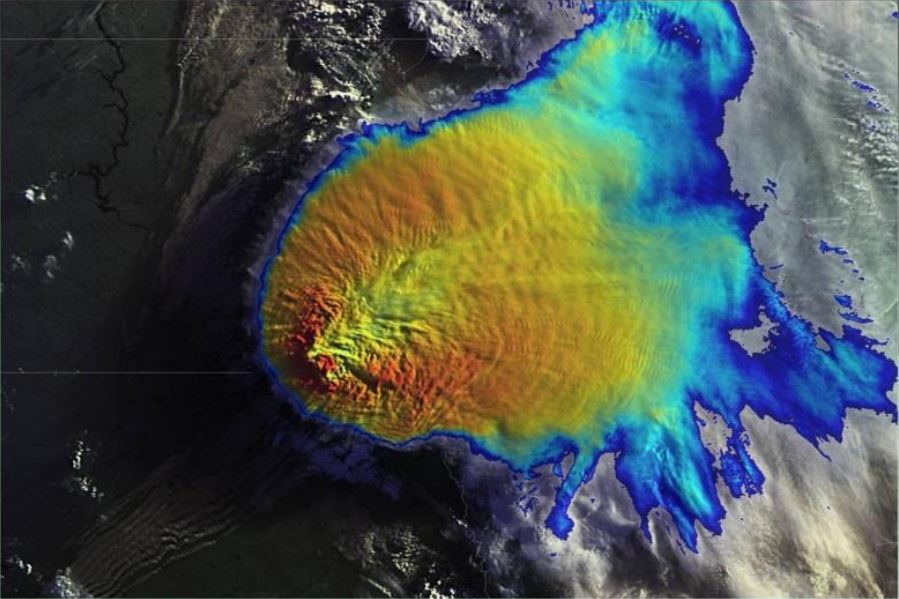
Jean-Marc Moisselin gives a presentation on the RDT product of the NowCasting SAF.
Length: 30 min
Author: Jean-Marc Moisselin (Meteo France)
The Rapidly Developing Thunderstorm product provides in object-mode information about significant convective systems. Various attributes describe the convective system: cloud-top temperature and height, overshooting tops, morphological attributes. The product uses the satellite brightness temperature of various channels and optional data like NWP data, lightning data and other NWCSAF products. A nowcast of convective systems is developed for 2016.
A new NWCSAF product (Convection Initiation – the probability of a cloudy pixel to become a thunderstorm) will be developed for 2016.
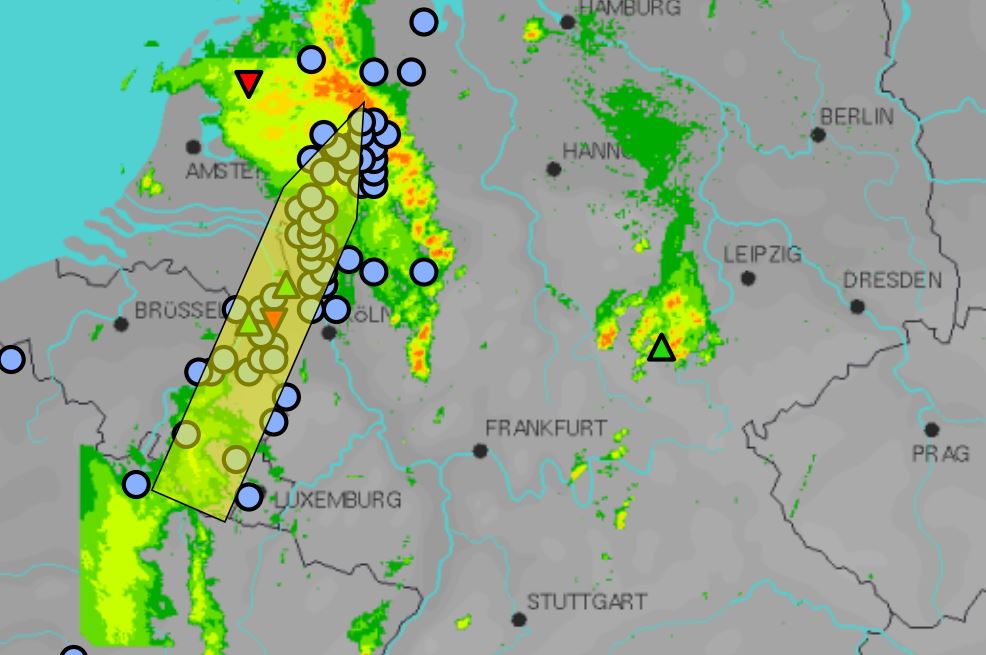
Christoph Gatzen gives an overview of cold-season derechos that occurred across Central Europe between 1997 and 2014.
Length: 30 min
Author: Christoph Gatzen (MeteoGroup)
The presentation gives an overview of cold-season derechos that occurred across Central Europe between 1997 and 2014. The environmental conditions leading to persistent, intense thunderstorms and associated long-track high wind events are analyzed using reanalysis data and proximity soundings. A focus is the development of deep moist convection in initially stable air masses due to synoptic-scale processes.
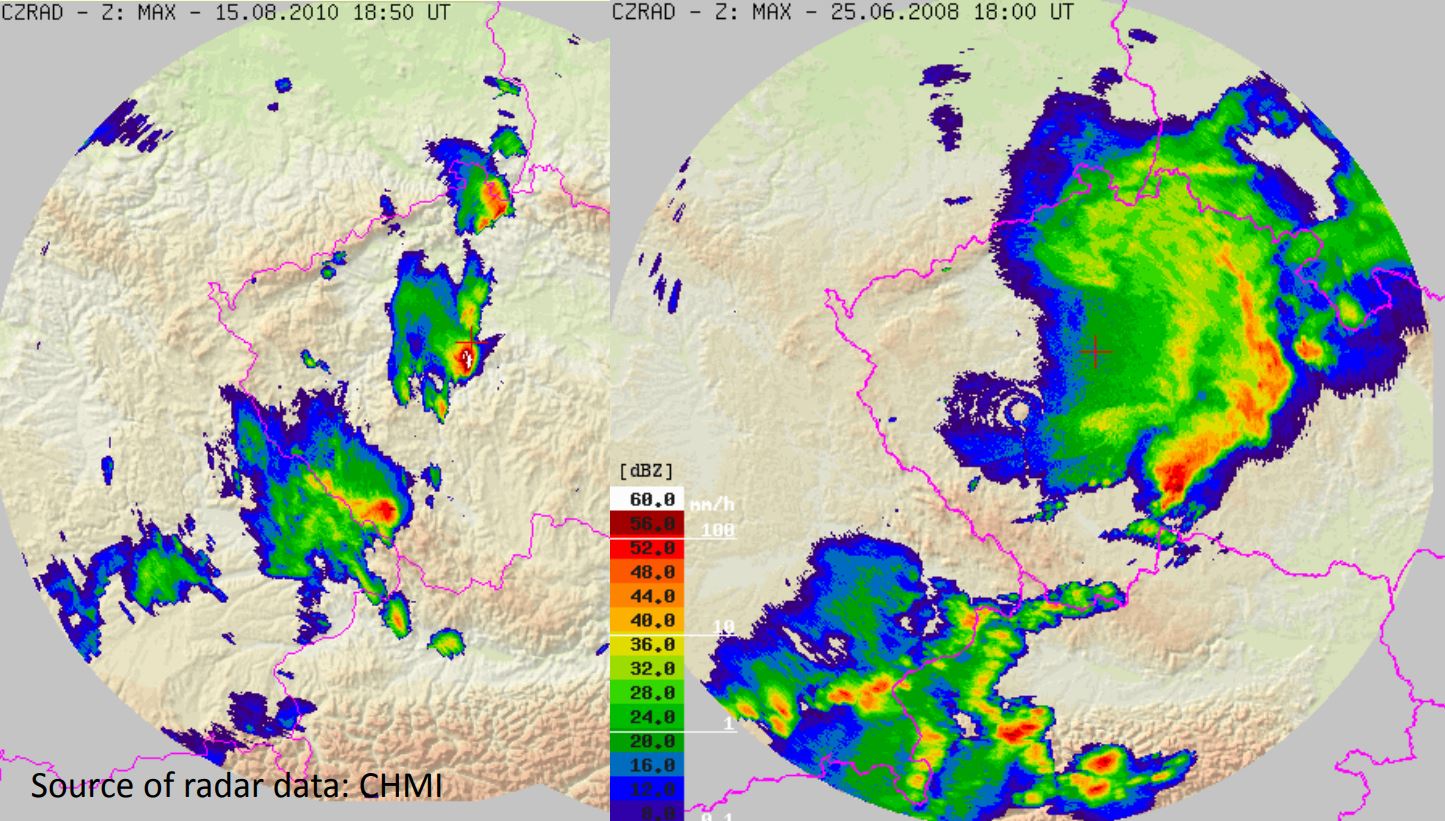
Tomas Pucik presents a study of the environments of non-severe and severe thunderstorms in Central Europe.
Length: 30 min
Author: Tomaš Pučik (ESSL)
The environments of non-severe and severe thunderstorms in Central Europe were studied using 16421 proximity soundings acquired in the period from December 2007 to December 2013. In this presentation, we will concentrate on different sounding-derived parameters and how their values change with the increasing severity of thunderstorm-related hazards (large hail, severe wind gusts, tornadoes, excessive precipitation). For example, we show that probability of these hazards as a function of CAPE and 0-6 km bulk shear is different for each hazard. We also present implications for forecasters, such as that area of parameter space with the highest probability of particular hazard may not collocate with the area where it is most frequent.
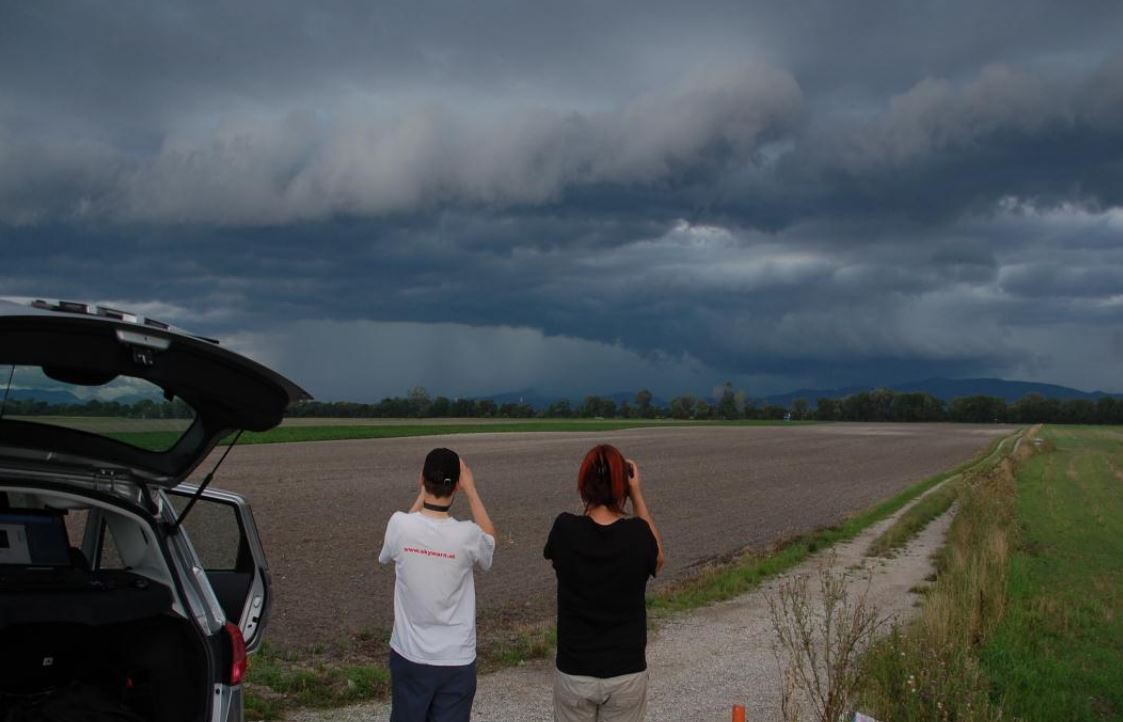
Thomas Krennert presents the Trusted Spotter Network Austria (TSN).
Length: 30 min
Author: Thomas Krennert (ZAMG)
TSN-Trusted Spotter Network Austria (www.zamg.ac.at/tsn_en) was established to build up a reliable network between storm - spotters and chasers, operational forecasters and scientists. TSN in its current state constitutes the collaboration between the Austrian meteorological service ZAMG (www.zamg.ac.at), SKYWARN AUSTRIA with its various partner organizations and the European Severe Storms Laboratory ESSL with its EUROPEAN SEVERE WEATHER DATABASE ESWD. One aim of this collaboration was a standardization of severe weather reports from the partners according to ESWD standards. We want to introduce the Trusted Spotter Network Austria and its MO, also the performance of ESWD reports from Austria relating to heavy rain, severe wind gusts, hail and other parameters will be shown in our presentation.

Liliane Hofer presents alpine pumping as a major mechanism for convection related to orography.
Length: 30 min
Author: Liliane Hofer (ZAMG)
Mountainous regions tend to be the starting point for convective developments due to their elevated heat sources, the topographic amplifying factor or their role as a flow obstacle. In this presentation different synoptic situations and the consequent convection will be analyzed in the Alpine region on the hand of case studies.
Georg Pistotnik talks about the role of vertical wind shear in storm organization.
Length: 30 min
Author: Georg Pistotnik (ZAMG)
Next to sufficient instability, strong vertical wind shear is the main driver that promotes thunderstorms to organize into multicells, supercells or lines, which are more probable to attain a longer lifetime and to produce severe weather phenomena like hail or wind gusts. The role of vertical wind shear in storm organization is explained in this presentation, and selected case studies illustrate how favorable conditions for severe storms can evolve either by large-scale processes or, more challenging for forecasters, by local modifications of the wind systems and associated temperature and humidity changes.
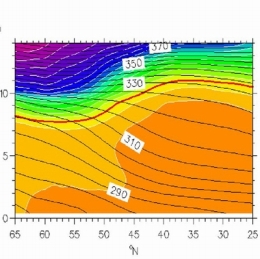
In meteorology vertical cross-sections are used because they give additional information compared to the information gained from the analysis on horizontal levels.
Not immediately related to satellite meteorology but often presented in the EUMeTrain material are cross sections. In meteorology vertical cross-sections are used because they give additional information compared to the information gained from the analysis on horizontal levels. The basics on cross sections and what can be derived are discussed and tested in the CAL module.
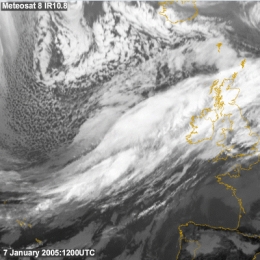
This training Module will present you with examples and exercises on the monitoring of NWP models using satellite imagery.
Numerical Weather Prediction (NWP) is a fundamental part of the modern forecasting. The importance of NWP in the forecasting process is so obvious that we often forget the restrictions and limitations of NWP. Models do have errors, even a lot of them. Even with ever improving performance the NWP models still have many problems in predicting many weather elements precisely.
It is of extreme importance that the forecaster can be able to evaluate the performance of NWP in a daily operational environment, and not be misled by the NWP output.
This module will concentrate on one aspect in model error correction: the subjective monitoring the NWP output with the help of satellite images. The purpose of the module is to help forecaster to use selected satellite products for a quick analysis of how the NWP model is able to catch the features in the weather chart.
The target users for this module are operational forecasters and developers. The pre-requisites for completing this module are general knowledge of meteorology, some experience in forecasting and a basic knowledge of the satellite images and image techniques.

This module offers an introduction in forecast verification.
This module is designed both for users of verification results, who wish to understand what the results really mean, and those who wish to dabble in verification methodology themselves.
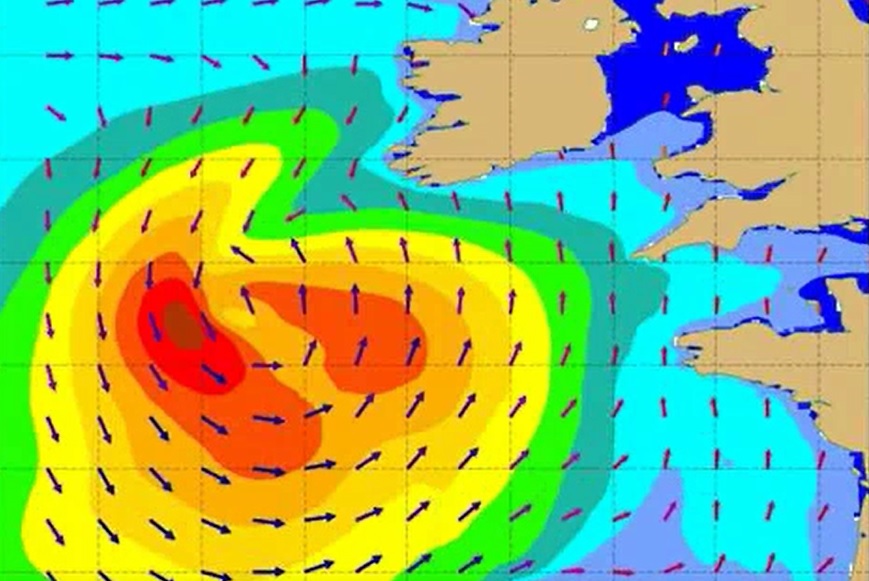
This lecture introduces the wave model products, eg. wave height and mean propagation direction, wave spectrum analysis, long swell forecasts, etc.
Length: 55 min
Author: Jean Bidlot (ECMWF)
Starting from the basics, this lecture introduces the students to wave model products (eg. wave height and mean propagation direction), wave spectrum analysis, long swell forecasts, extreme forecast index etc. Since these outputs (alongside data from the bouys) are the basic material marine forecasters have for forecasting and nowcasting waves in seas and especially in oceans, explaining the positive and negative sides of model outputs is very important for understanding and thus correctly using the products marine forecasters use.
Jean Christophe Calvet talks about the assimilation of H-SAF soil moisture products into models.
Length: 28 minutes.
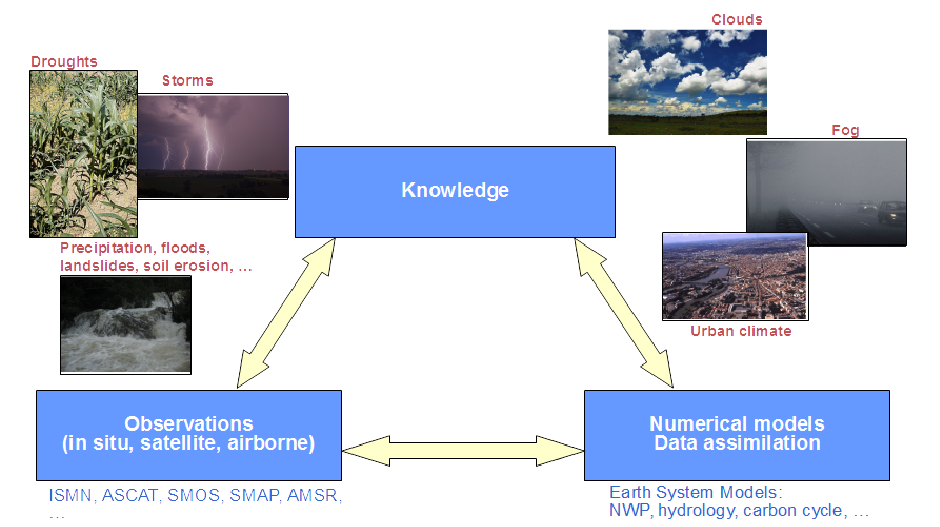
In situ and satellite-derived soil moisture observations are needed to better understand and simulate land surface processes. This has been the subject of active research for more than two decades. The transfer to operations in weather forecast, hydrometeorological, and drought monitoring applications also implies the integration of satellite-derived observations into models. Examples of the use of soil moisture observations, simulations, and data assimilation are presented.
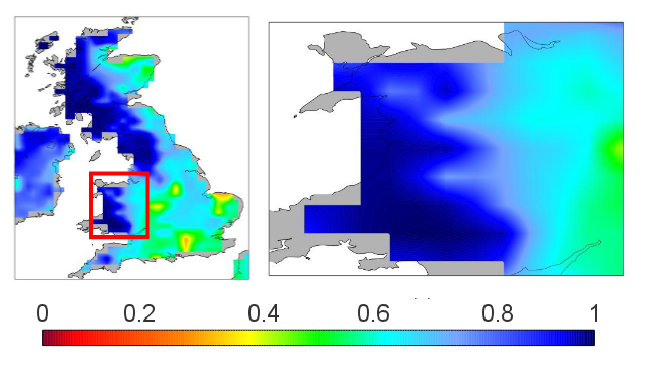
David Fairbairn discusses the theory behind the near-real-time and data record RZSM products.
Length: 25 minutes.
ECMWF provides the core root-zone soil moisture (SM) products for H SAF through an Extended Kalman filter assimilation system, running independently of the NWP system. Space borne scatterometer-derived surface SM observations are assimilated into the root-zone (0-1 m) SM of the H-TESSEL land surface model. In this presentation, the theory behind the near-real-time and data record products is discussed.