
Identify surface features
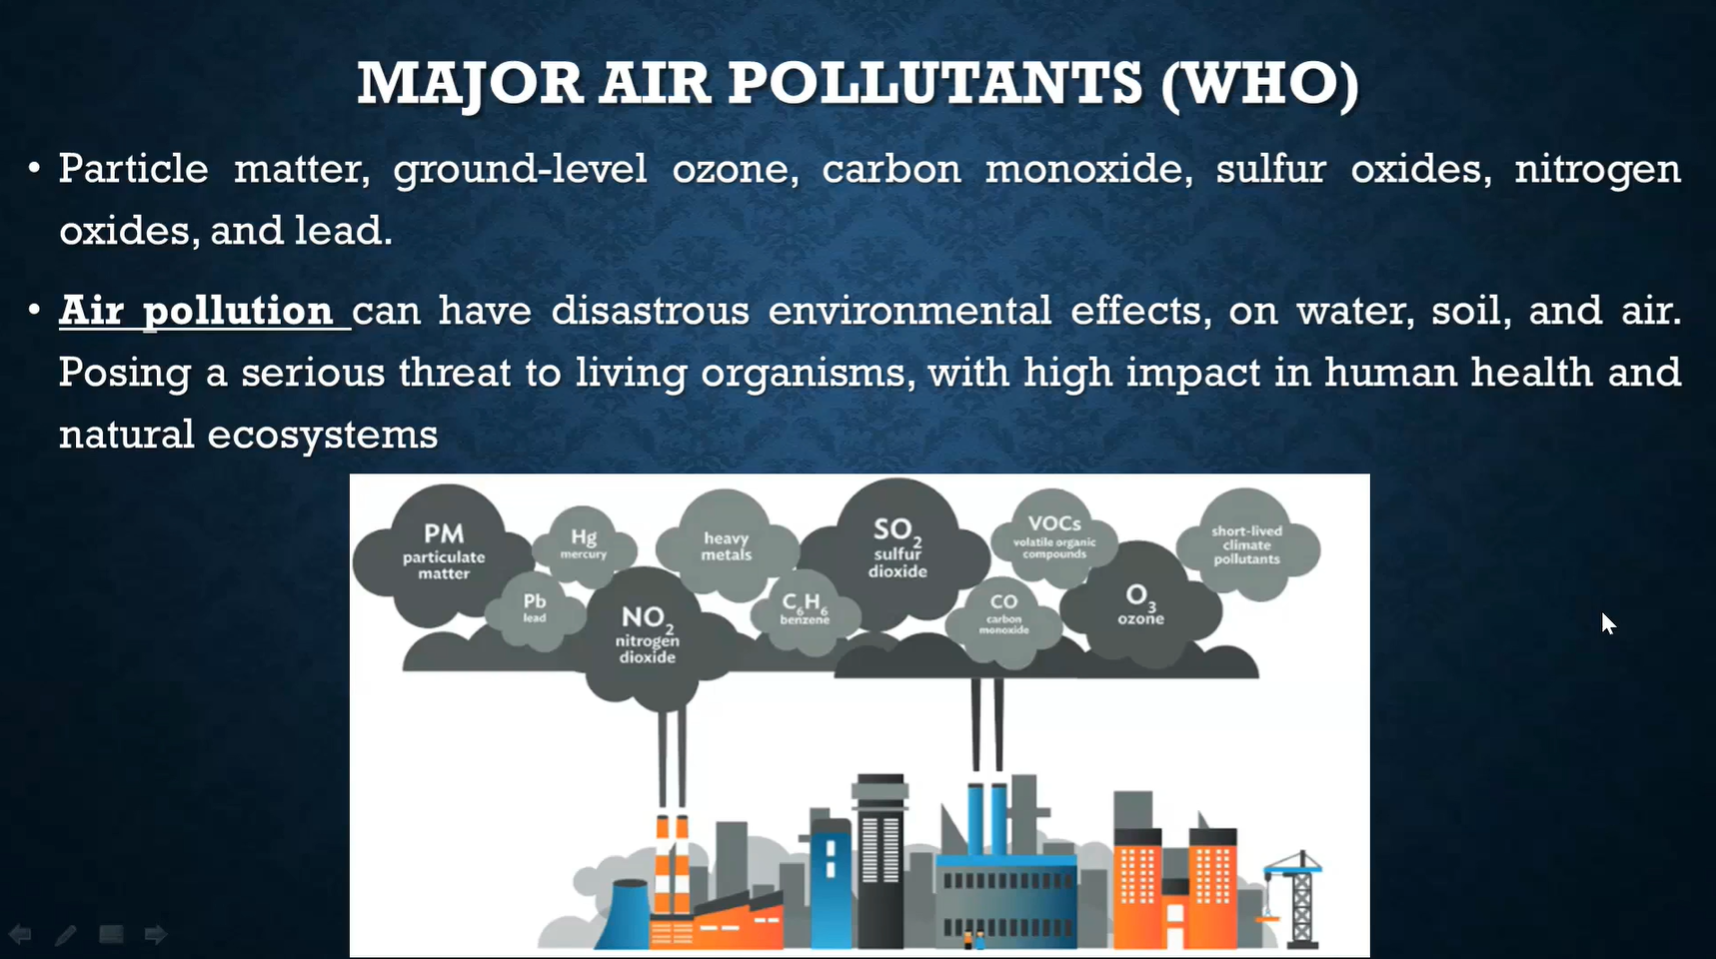
Ana Russo and Rita Durão talk about heatwave impact on air quality, pollutants and evaluation of air quality.
Heatwaves often lead to low air quality levels. Very high to extreme temperatures combined with stagnant air conditions increase air pollutants concentrations, such as tropospheric ozone. This effect might be emphasized when drought conditions also occur, which contributes to increasing fire danger and decreasing air quality levels too. Air pollution impacts on health are consequently an important issue, together with the drawbacks on ecosystems. This lecture will provide insights into the detection, monitoring, and evaluation of air quality impacts, using among others, remote sensing products.
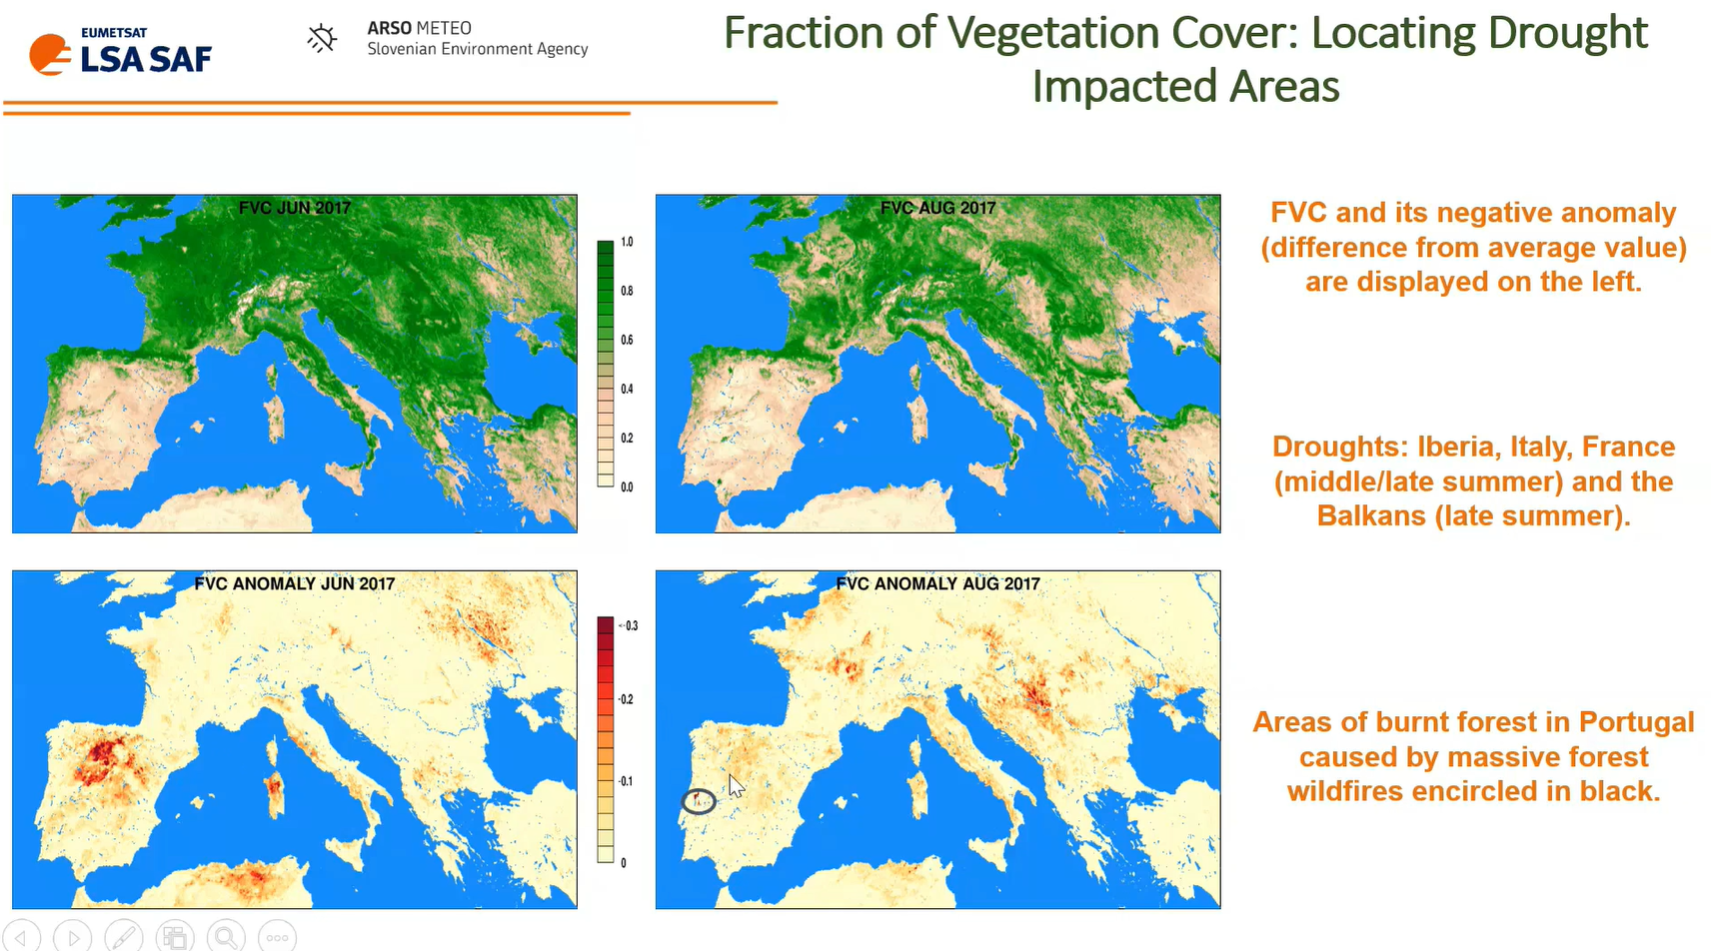
Bostjan Muri talks about using LSA SAF data and vegetation anomalies for drought monitoring.
In this presentation, we explore numerous real world applications of the use of LSA SAF data. Our focus is identifying heatwaves and droughts based on satellite data. Vegetation anomalies can be particularly helpful for drought monitoring. These show cases are selected in order to highlight the benefits of specific applications using LSA SAF data and its added-value when compared with other existing sources of observations (either satellite or meteorological stations) as well as model output.
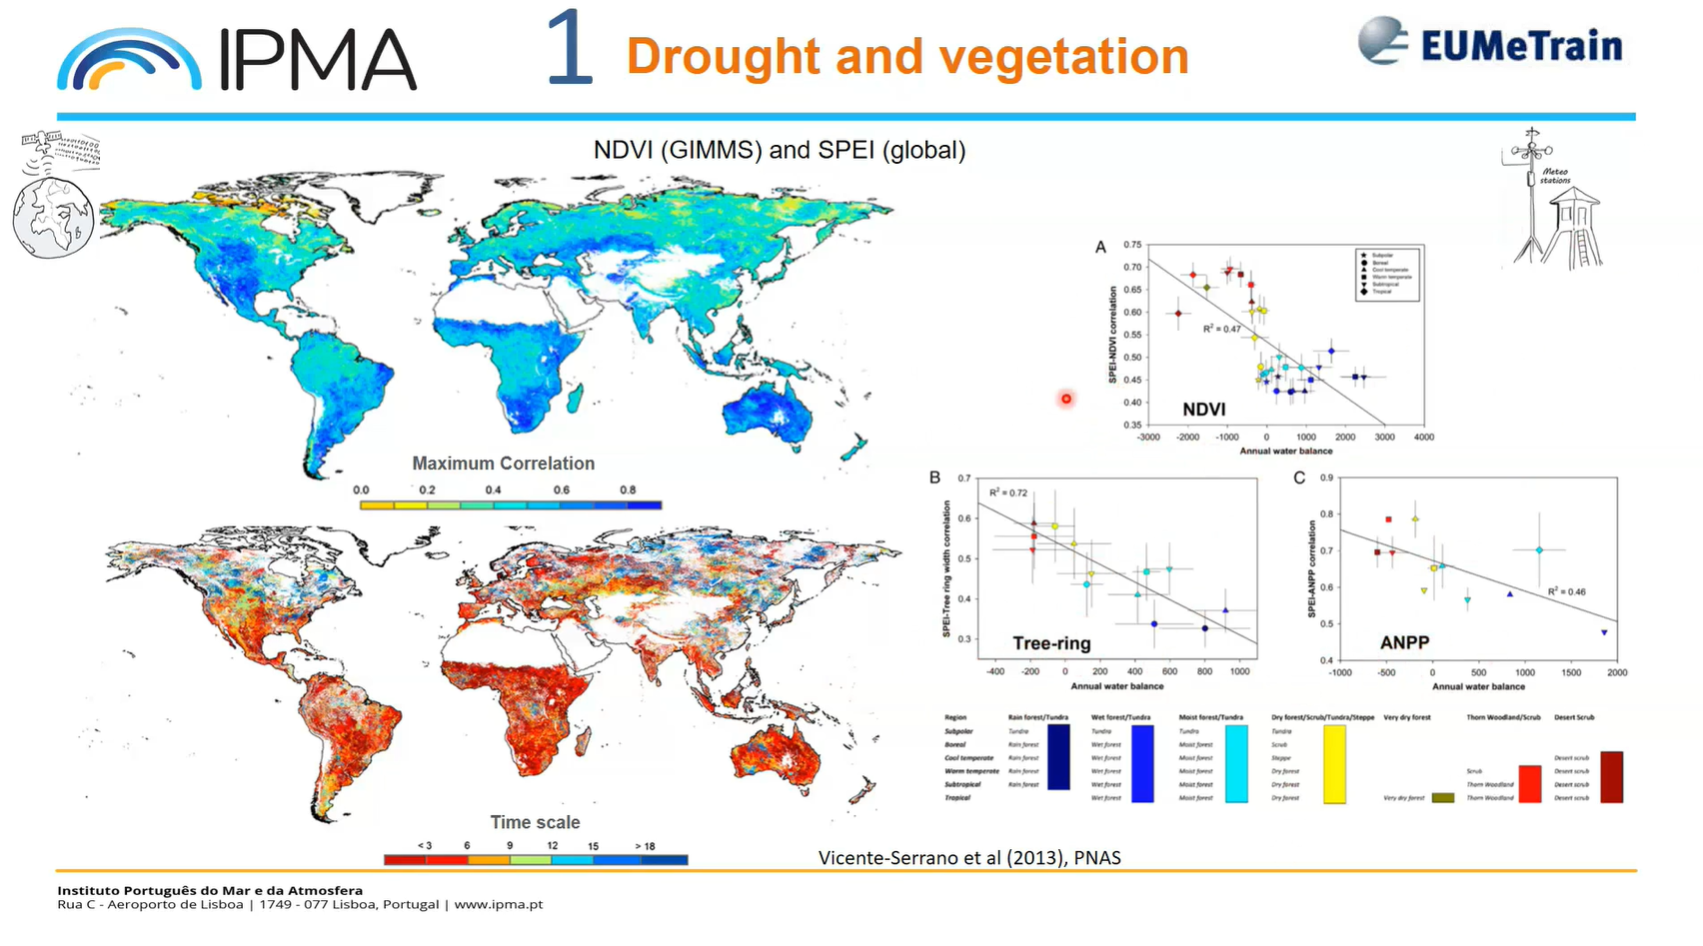
Célia Gouveia presents about heatwave and drought impacts on crops and vegetation.
The frequency and intensity of extreme hot and dry events have increased worldwide, particularly over the past couple of decades. The interaction between co-occurring drought and hot conditions is often particularly damaging to vegetation and crop's health and may cause crop failure. This lecture will provide insights on the impacts of compounded and separated dry and hot extremes on vegetation activity, and crop production and yield. Examples of the detection, monitoring and evaluation of such impacts using remote sensing products will be shown.
Beatriz Martinez shows how climate data records analysis can be used to monitor drought affected areas.
The scientific community requires consistent long-term data records with well-characterized uncertainty and suitable for modelling terrestrial ecosystems changes as consequence of current climate impact at global scales. The vegetation climate data records (CDRs) of FAPAR (LSA-426) and FVC (LSA-422) are freely available within the EUMESAT LSA SAF (http://lsa-saf.eumetsat.int). These CDRs offer more than fifteen years (2005- present) of homogeneous and continuous 10-day time series for climate and environmental applications. The main goal of this lecture is to present a few examples CDRs analysis to monitor and characterize areas mainly affected by severe drought events. Moreover, the potential in the assessment of ecosystem response to rainfall deficit events is also presented using the last operational product included in the VEGA portfolio, the 10-day gross primary production (GPP; MGPP LSA-411). The robustness of this product is evaluated at both site and regional scales across the MSG disk using eddy covariance (EC) GPP measurements and Earth Observing (EO)-based GPP products, respectively, over a short period of three years.
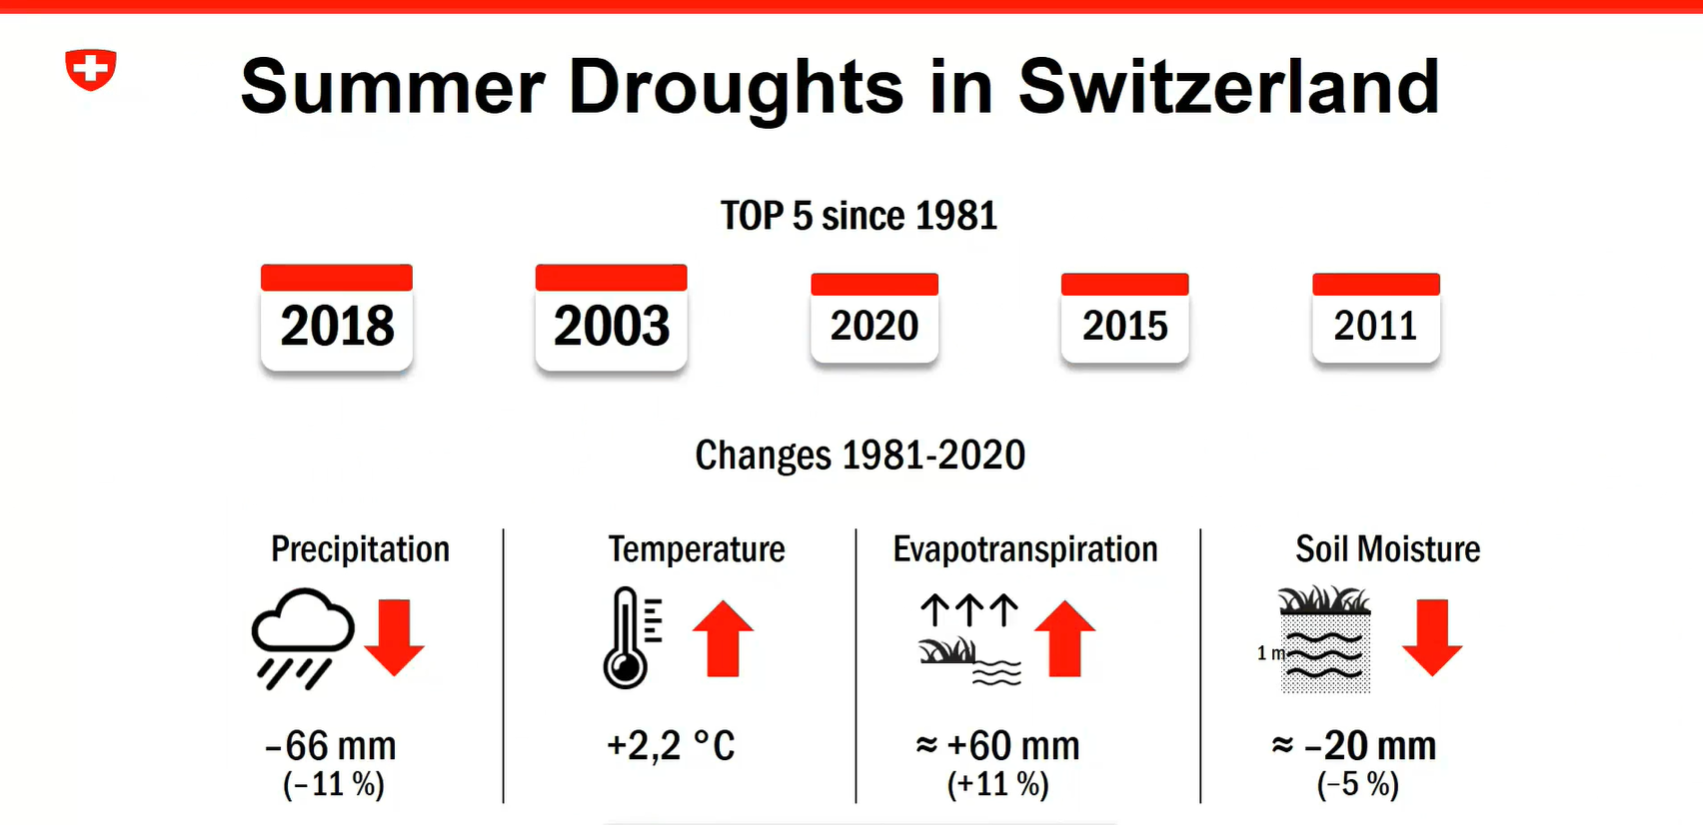
Anke Duguay-Tetzlaff and Vincent Humphrey present about the recent Swiss drought monitoring project and use of EUMETSAT satellite data for drought monitoring.
The Swiss government has started a drought monitoring project in 2023. The goal is to set an operational drought monitoring and warning system in the upcoming years. In a pre-study we have analyzed the potential of EUMETSAT satellite data for climatological drought monitoring in Switzerland. We will present possibilities and shortcomings of the different analyzed soil moisture, land surface temperature and evaporation data and provide an outlook on how we plan to integrate EUMETSAT data in the system.
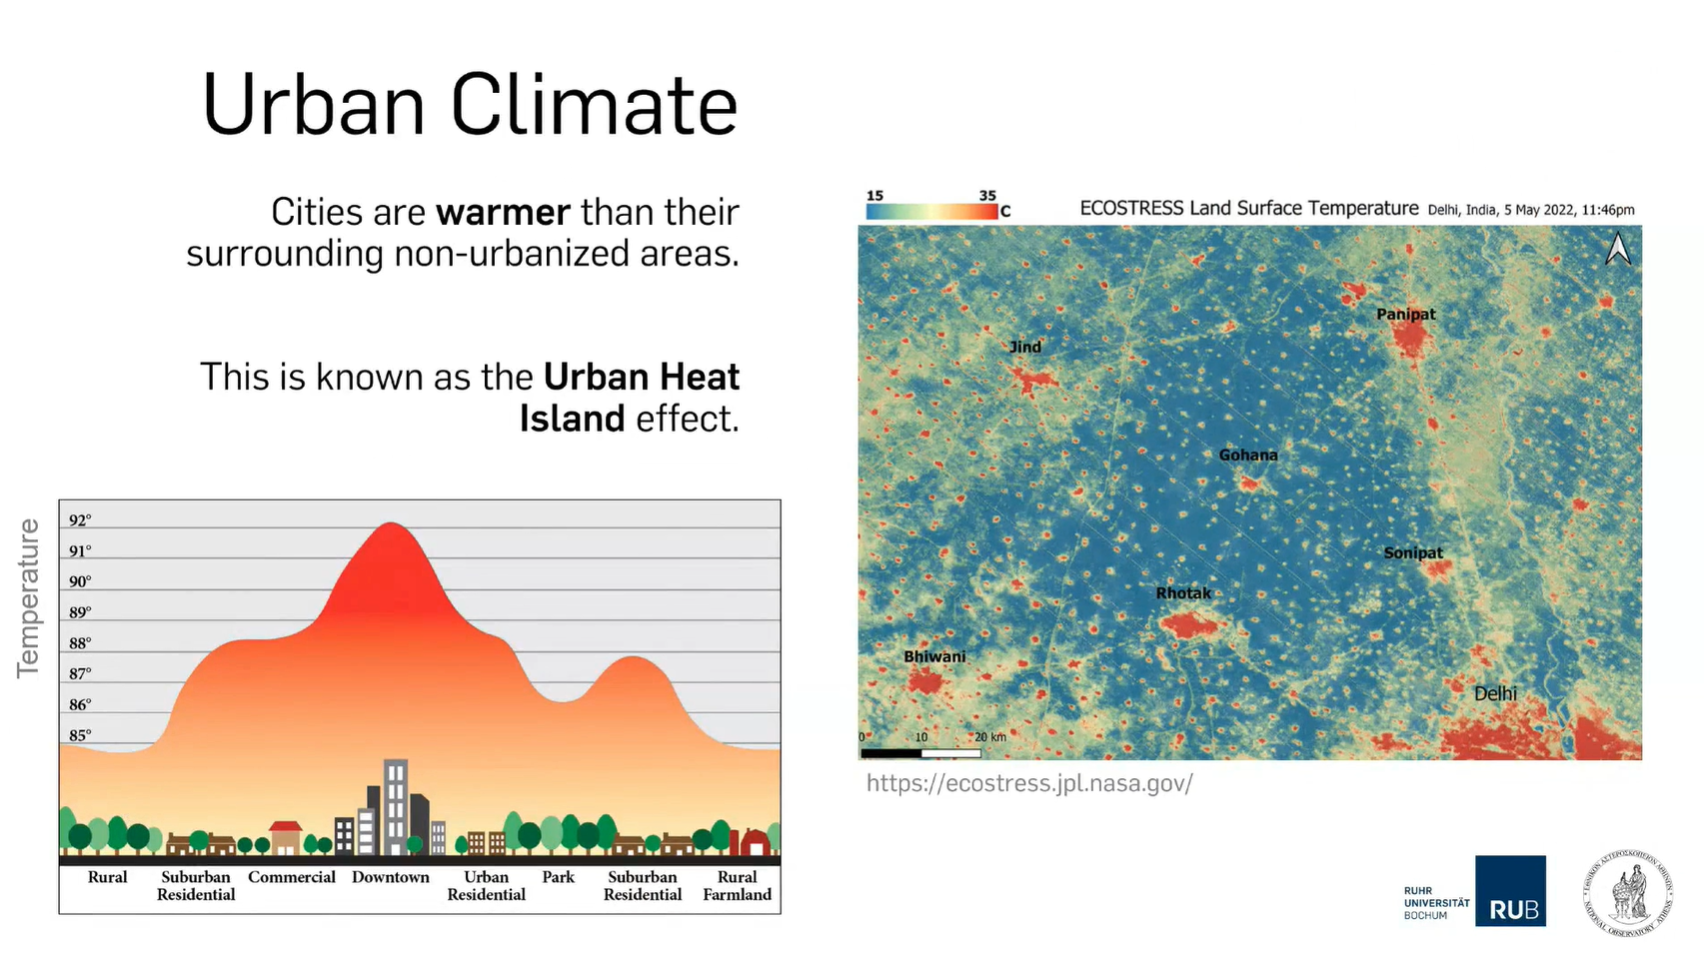
Panagiotis Sismanidis provides insight into urban heat islands including its drivers and impacts.
Cities are generally warmer than their surroundings. This phenomenon is known as the Urban Heat Island (UHI) and is one of the clearest examples of human-induced climate modification. UHIs increase the cooling energy demand, aggravate the feeling of thermal discomfort, and influence air quality. In this talk we will discuss the drivers and impacts of UHIs and showcase how to characterize the urban landscape in Local Climate Zones. We will also discuss the discrepancies between remotely-sensed land surface temperatures (LST) and near-surface air temperatures when studying the urban climate.
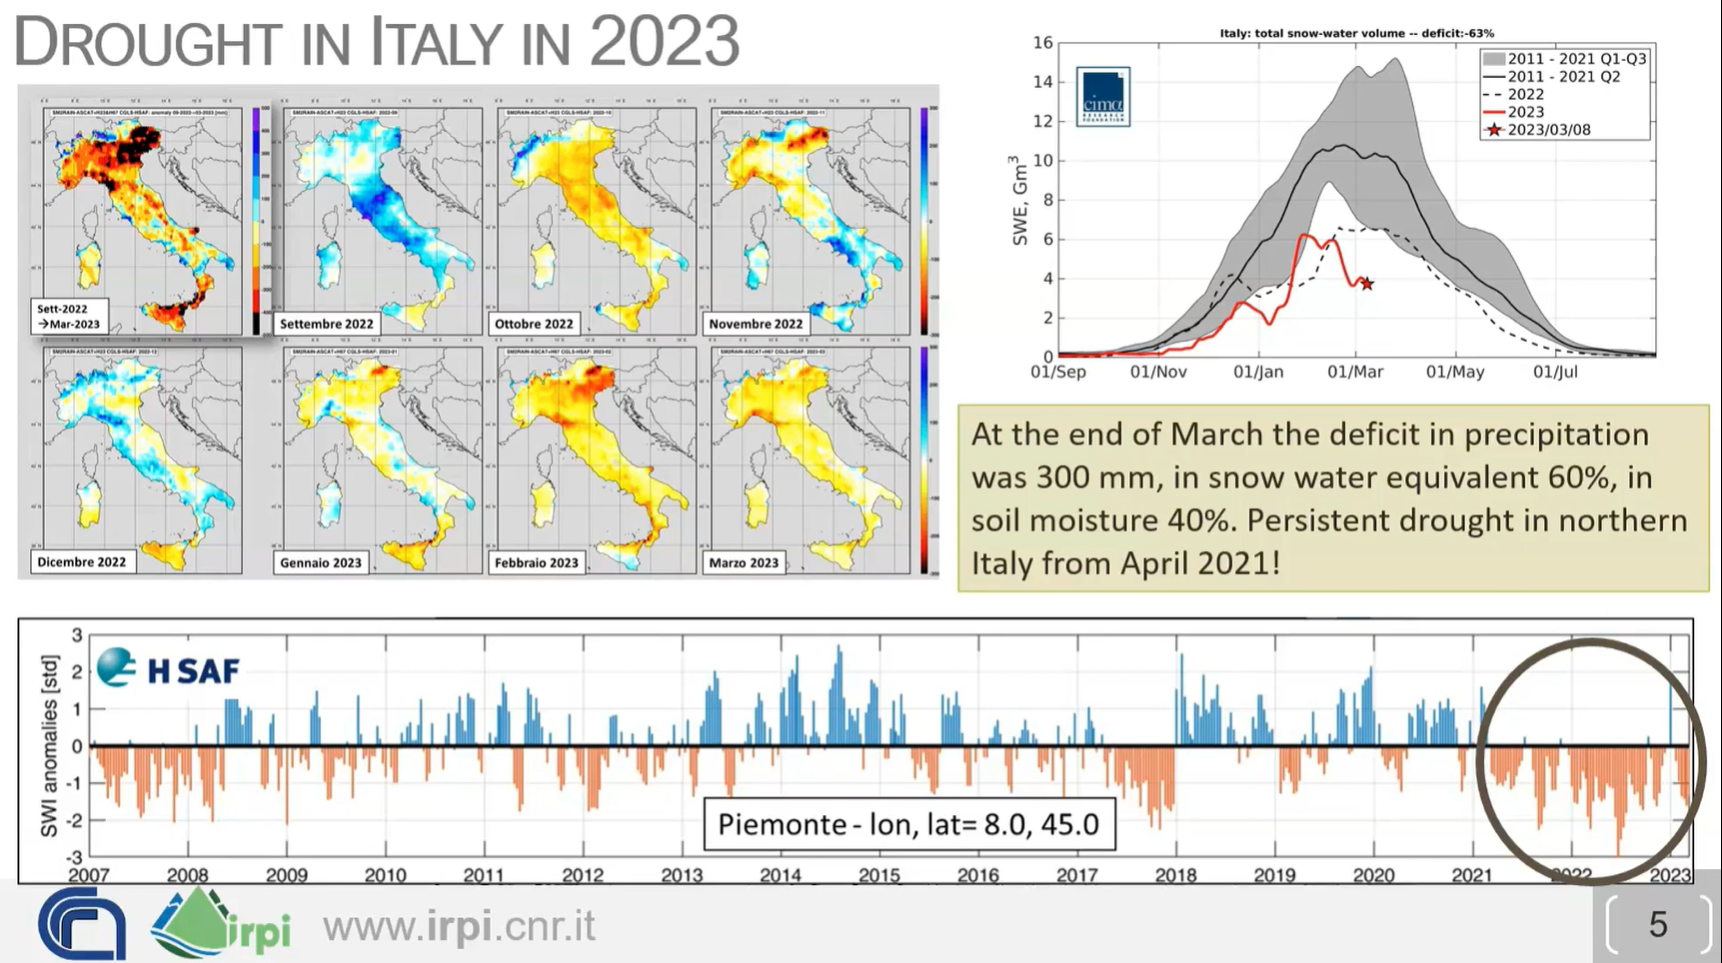
Luca Brocca shows how to combine multiple satellite derived variables to monitor drought.
How do we monitor drought? Is it enough to use only precipitation data and calculate the SPI (Standardized Precipitation Index)? New satellite-derived products (precipitation, evaporation, soil moisture and snow) offer additional ways to monitor drought in space and time, to assess WHERE the water is (surface soil, root zone soil, snowpack), and thus to know WHEN the water will be available. Real-world case studies will be analyzed together with the participants, also using an interactive platform (https://explorer.dte-hydro.adamplatform.eu/). The objectives of the lecture are: (1) to assess drought risk based on (new) satellite observations, and (2) to translate drought risk information into real-world decisions for water resources management (e.g., reservoir management, irrigation, hydropower generation).
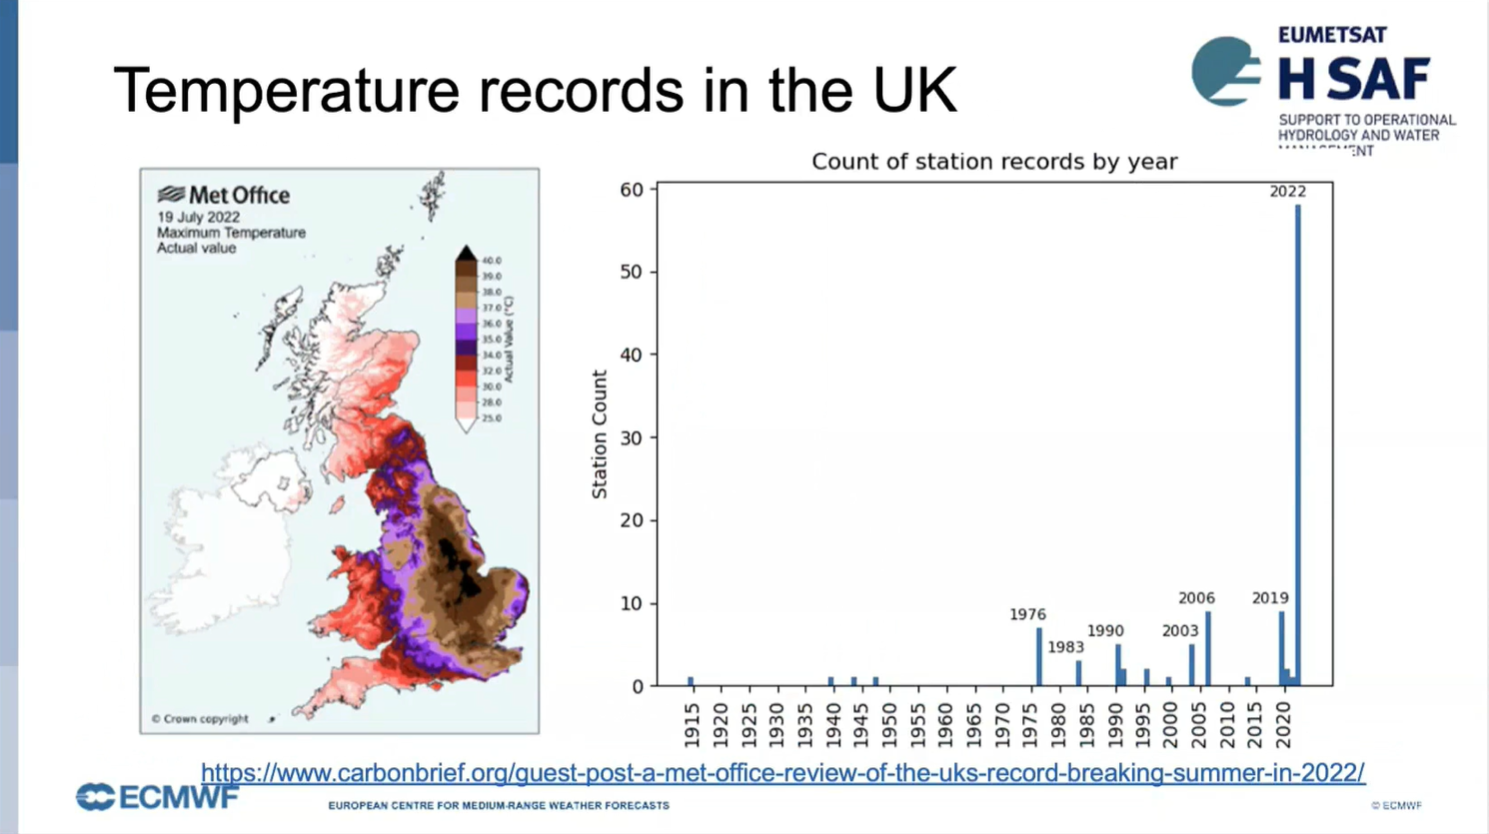
David Fairbairn talks about soil moisture and drought monitoring and using H SAF datasets.
H SAF soil moisture (SM) products are derived from ASCAT C-band backscatter measurements. In this presentation we compare the near-real-time products with long-term data records in order to demonstrate the exceptional severity and extent of recent droughts, including the 2022 summer drought over Europe.
João Martins talks about using Land Surface Temperature (LST) in heatwave monitoring using LSA SAF datasets.
Heat and water stress leave clear signatures on land surface variables that can be monitored from space. The LSA SAF has been providing satellite datasets and products that allow the characterization of the surface energy budget and the monitoring of vegetation growth and stress. We will show that combining information on the surface temperature diurnal cycle and on vegetation state provides a different perspective on the spatial extent and time evolution of droughts and heatwaves, and reveals underlying soil vegetation-atmosphere feedbacks.
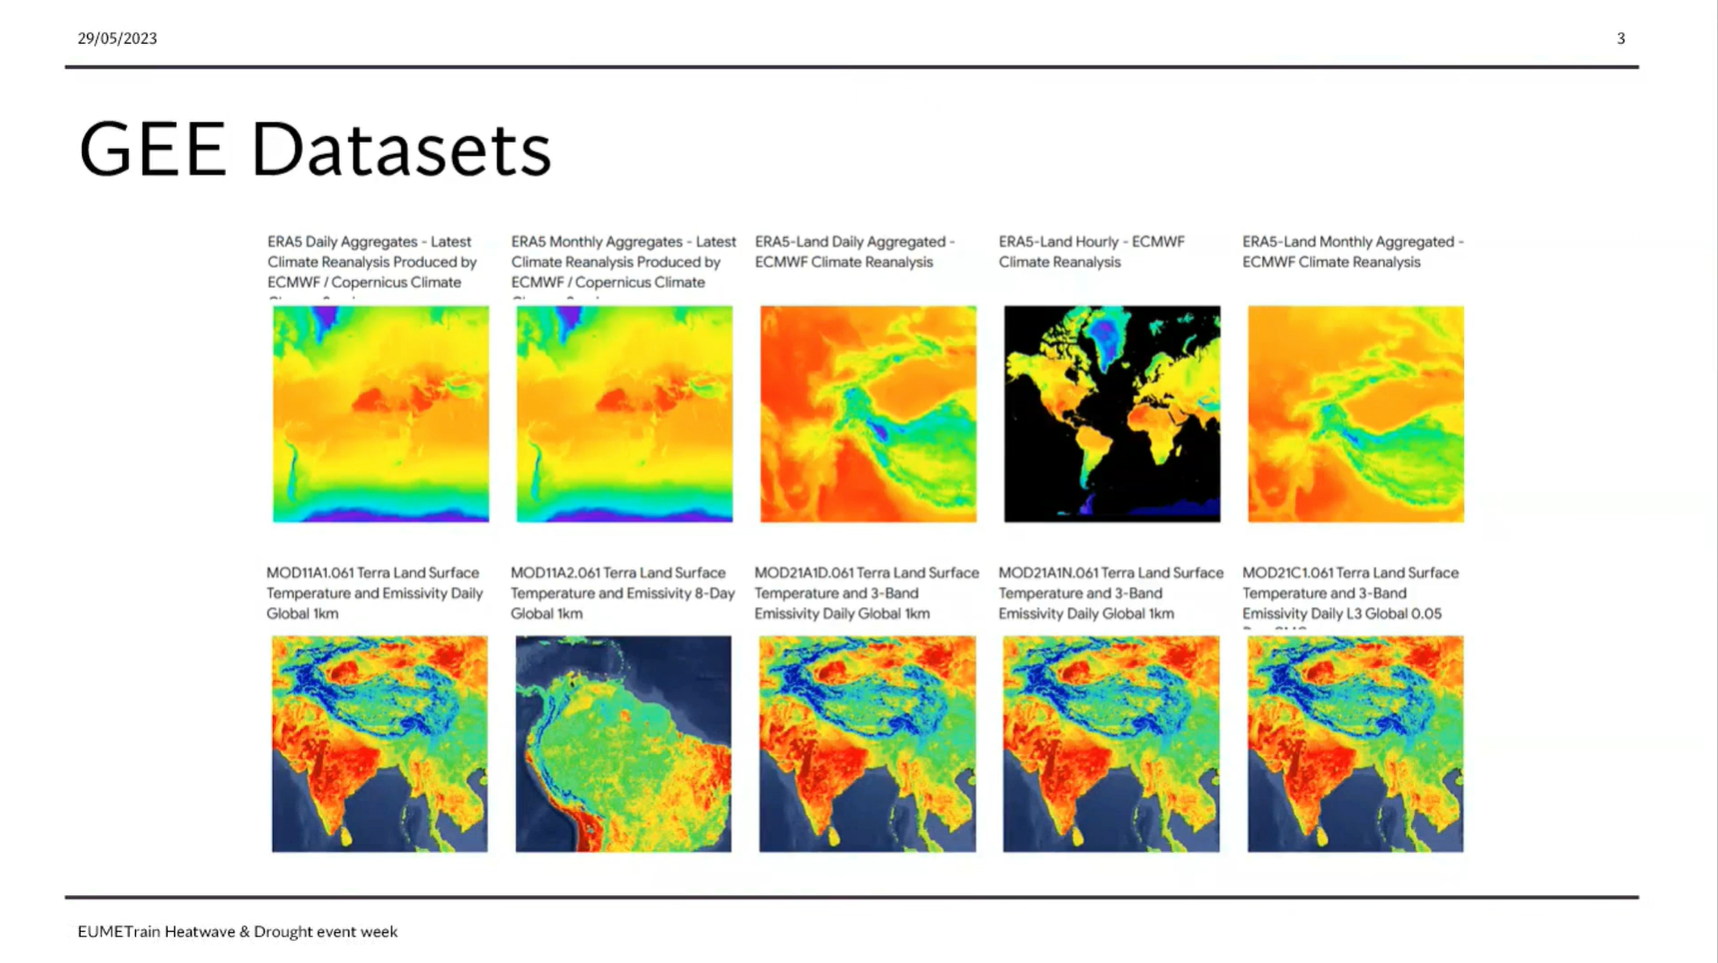
Sofia Ermida showcases the use of Google Earth Engine in Heatwaves and Drought monitoring
The Google Earth Engine (GEE) is a powerful tool for researchers providing easy access to a large array of environmental datasets, particularly from remote sensing, and the computational resources to analyzed them. Here we present an overview of the capabilities and datasets of the GEE useful for the study of heatwaves and droughts and provide some examples of applications.
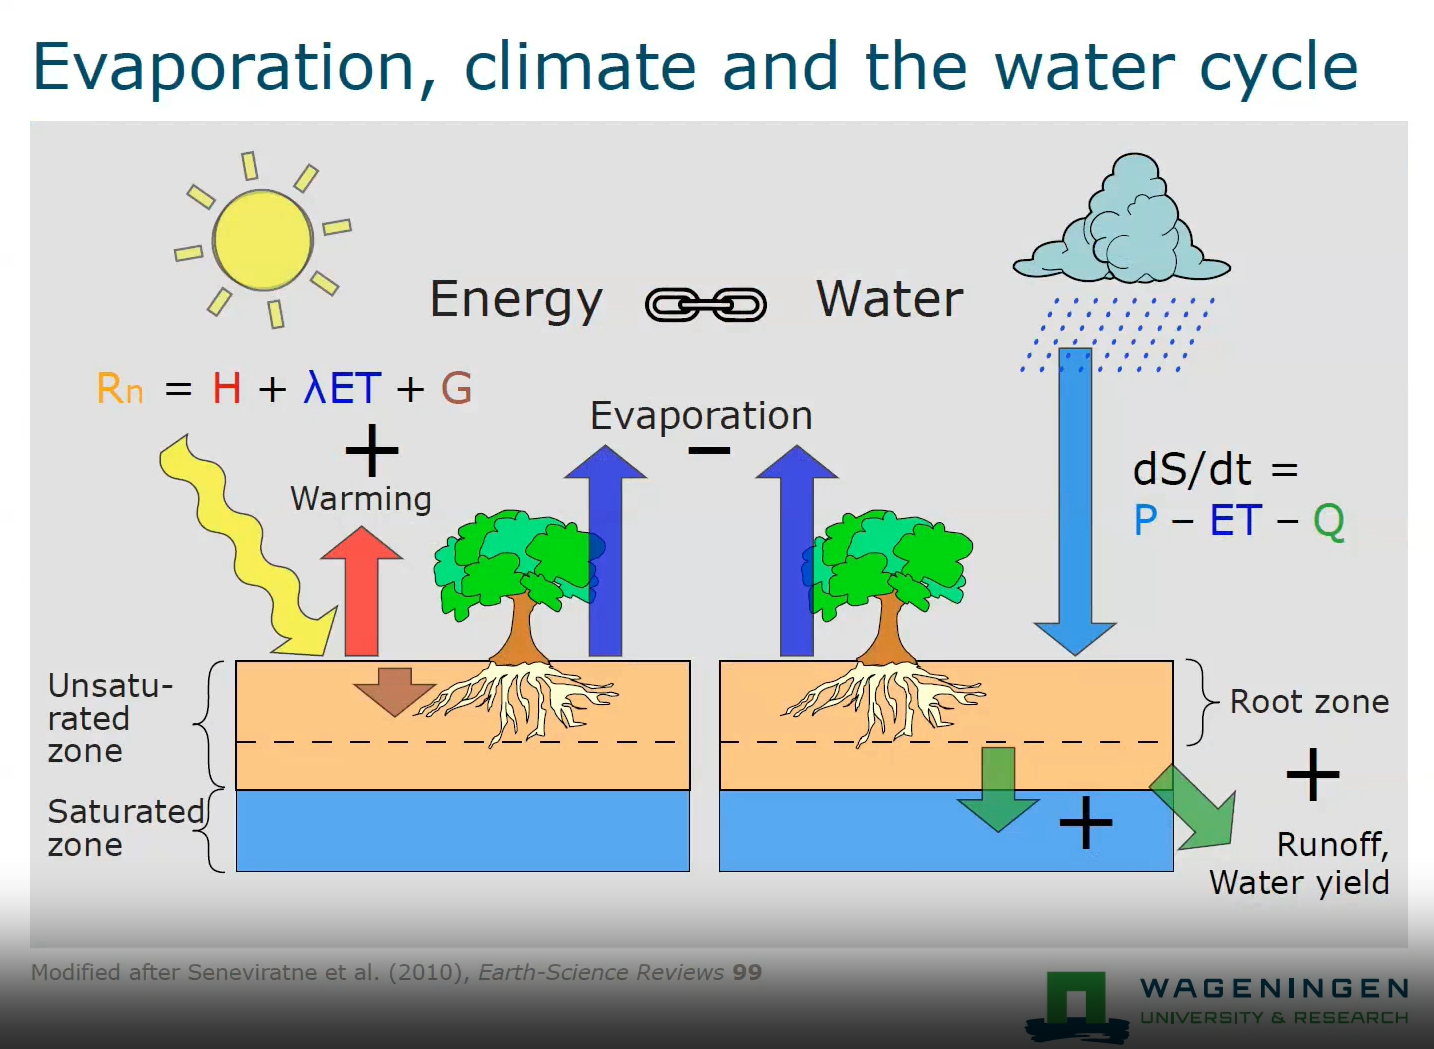
Ryan Teuling talks about soil moisture and land surface energy balance.
Heatwaves and droughts are often strongly linked due to the increased sensible heat fluxes at the land surface warming the atmosphere above. In this talk, I will discuss how soil moisture depletion changes the land surface energy balance, and how the evolution of changes in the land surface energy balance is different for different land cover types (i.e., forest and short vegetation). The use of high-resolution satellite soil moisture data for drought monitoring is also discussed.
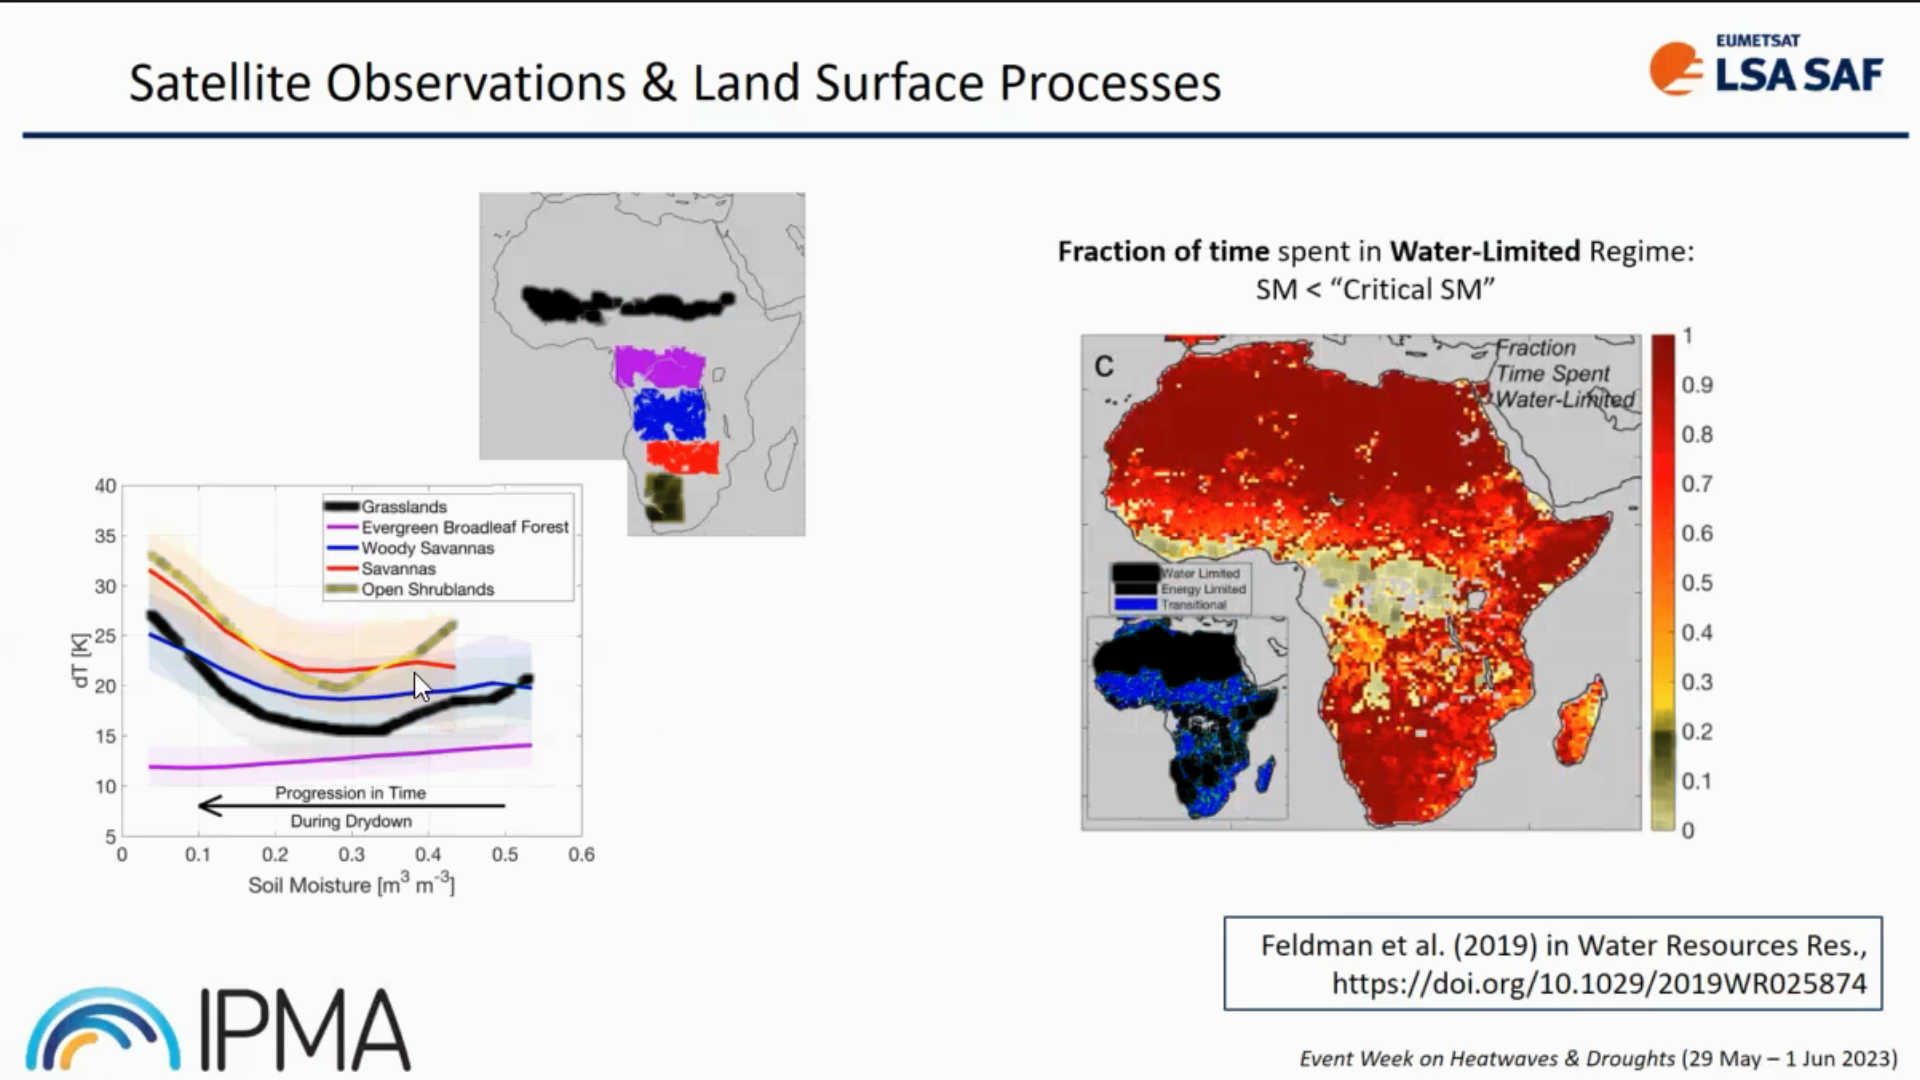
Isabel Trigo provides insight into LSA SAF datasets and its usage.
Heat and water stress leave clear signatures on land surface variables that can be monitored from space. The LSA SAF has been providing satellite datasets and products that allow the characterization of the surface energy budget and the monitoring of vegetation growth and stress. We will show that the combination of information on the surface temperature diurnal cycle and on vegetation state provides a different perspective on the spatial extent and time evolution of droughts and heatwaves, and reveals underlying soil vegetation-atmosphere feedbacks.