
Satellite skills and knowledge for operational meteorologist
Listed here are other resources related to Satellite skills and knowledge for operational meteorologist tag:
Note: click on an image to open the Resource
Sheldon Kusselson talks about microwave sensors aboard operational polar orbiters.
Length: 30 min
Author: Sheldon Kusselson (former NOAA/NESDIS)
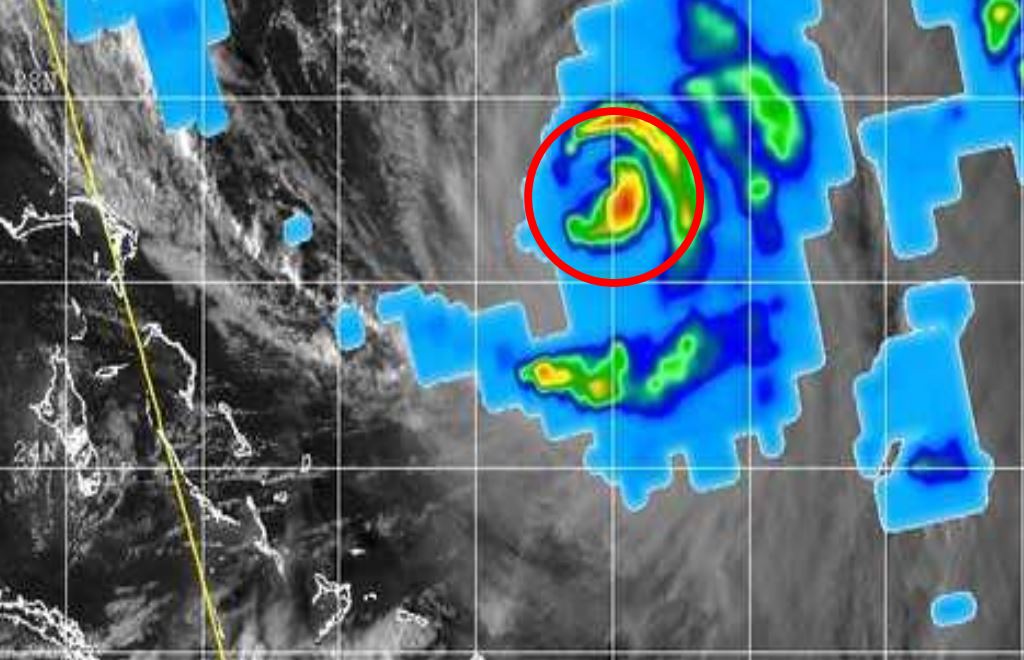
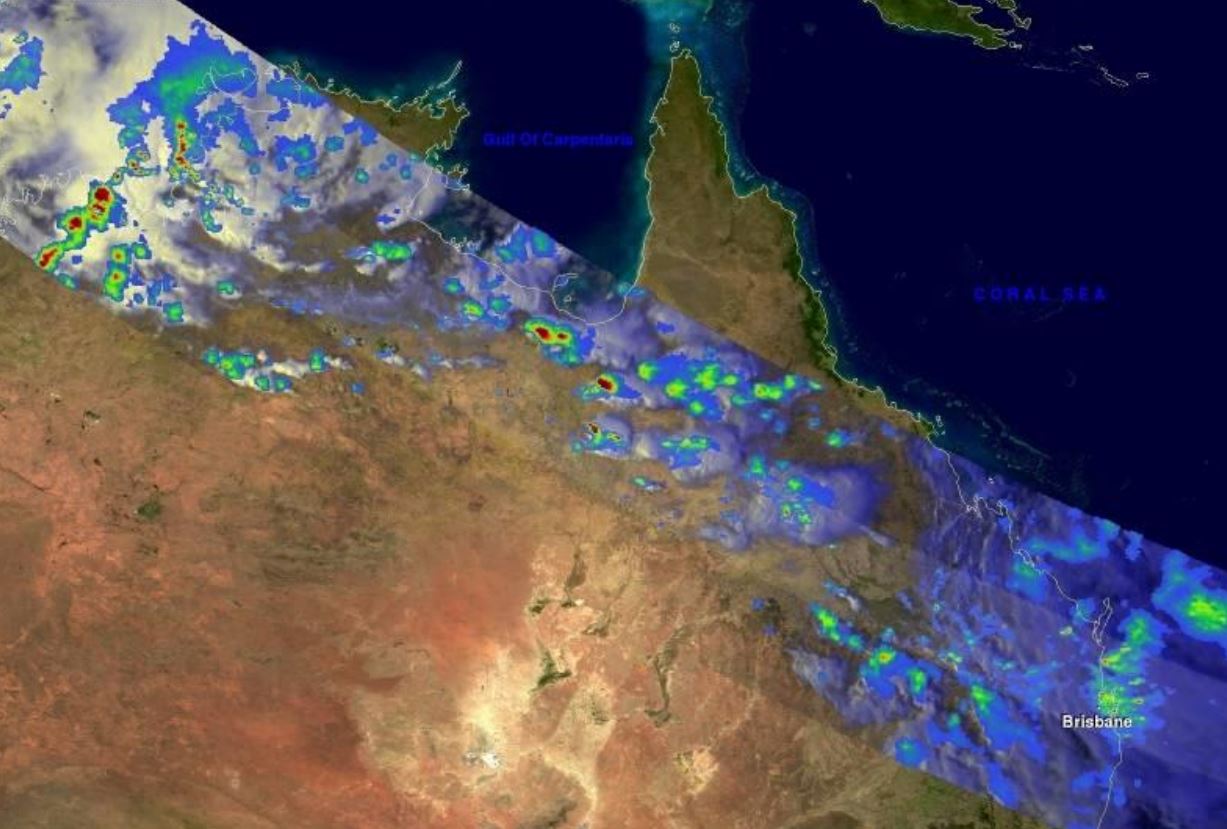
Polar-orbiting microwave sensor generated rain rate estimates are the most accurate satellite-derived estimates of rainfall because of their direct relationship between liquid and ice hydrometeors and surface precipitation. People may find that surprising because the timeliness, latency and spatial resolution are inferior to geostationary satellite rain estimates. But the primary advantage that microwave sensors aboard operational polar orbiters have over geostationary satellites is the ability to see through the clouds and capture what is below the cloud tops. The current operational polar-orbiting satellite sensors aboard the DMSP (SSMI/S sensor) and NOAA/METOP/S-NPP satellites (AMSU/MHS and ATMS sensors) that generate instantaneous areal average microwave rain rates will be presented and explained, along with the recent development of combining these measurements into a Blended Rain Rate Product and an additional blended product called QMORPH. In the future polar-orbiting microwave rain rates will be used as a calibration of the next generation of geostationary satellite-derived rain estimates. A few recent case studies of the best use of operational microwave rain rates will also be shown, as well as those from more research oriented missions, such as GCOM (AMSR-2 sensor) and GPM (GPI sensors) that are also used in operations.
Vincenzo Levizzani provides a brief overview of the basic physical principles underlying satellite precipitation estimation methods.
Length: 46 min
Author: Vincenzo Levizzani (CNR - ISAC)
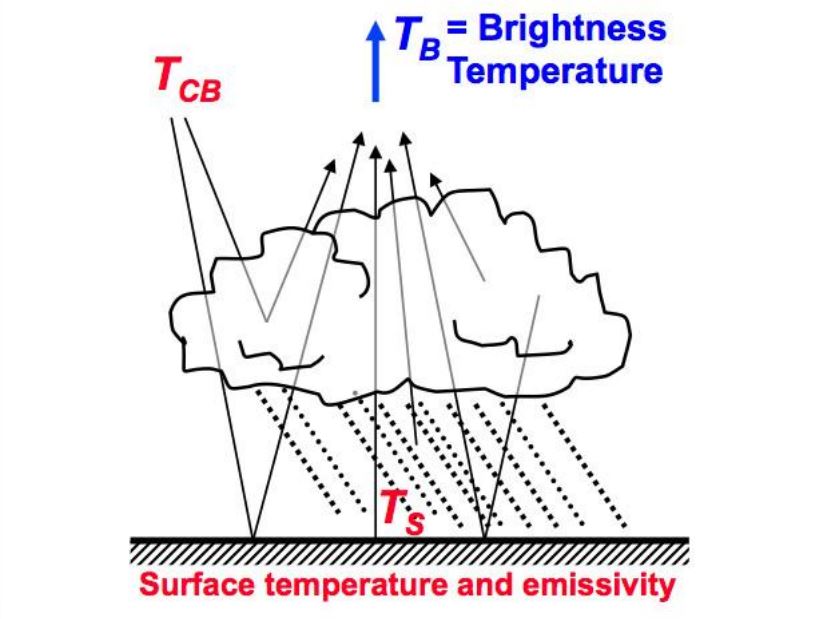
The estimation of precipitation from space was attempted almost at the beginning of the satellite meteorology era by establishing a somewhat loose link between visible and infrared imagery of cloud tops and precipitation intensity at the ground. Since the early days estimation methods have qualitatively and quantitatively evolved with the advent of passive microwave sensors first and precipitation and cloud radars more recently. The purpose of the lecture is to provide a necessarily brief overview of the basic physical principles underlying satellite precipitation estimation methods trying to make the audience aware of what the sensors actually “measure” (radiation properties) and how these measurements are converted into precipitation intensity. All the methods, either based on “passive” or “active” sensing, are necessarily indirect and thus a clear understanding of the physics of radiation and of cloud hydrometeors is needed for the correct use of the products. In fact, such understanding helps in identifying the limitations of the existing precipitation products, which are too often used improperly or taken for granted. The lecture will try to pave the way to the in depth lectures of the other instructors on more specific topics of the discipline.
Gail Skofronick Jackson presents the Global Precipitation Measurement (GPM) mission.
Length: 45 min
Author: Gail Skofronick Jackson (NASA)
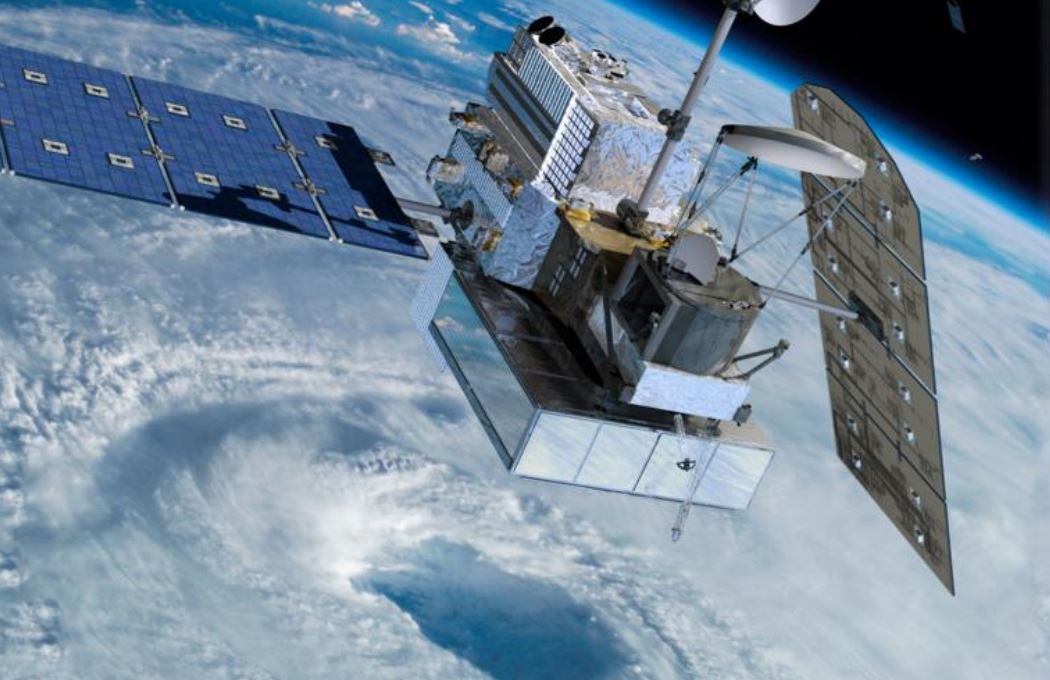
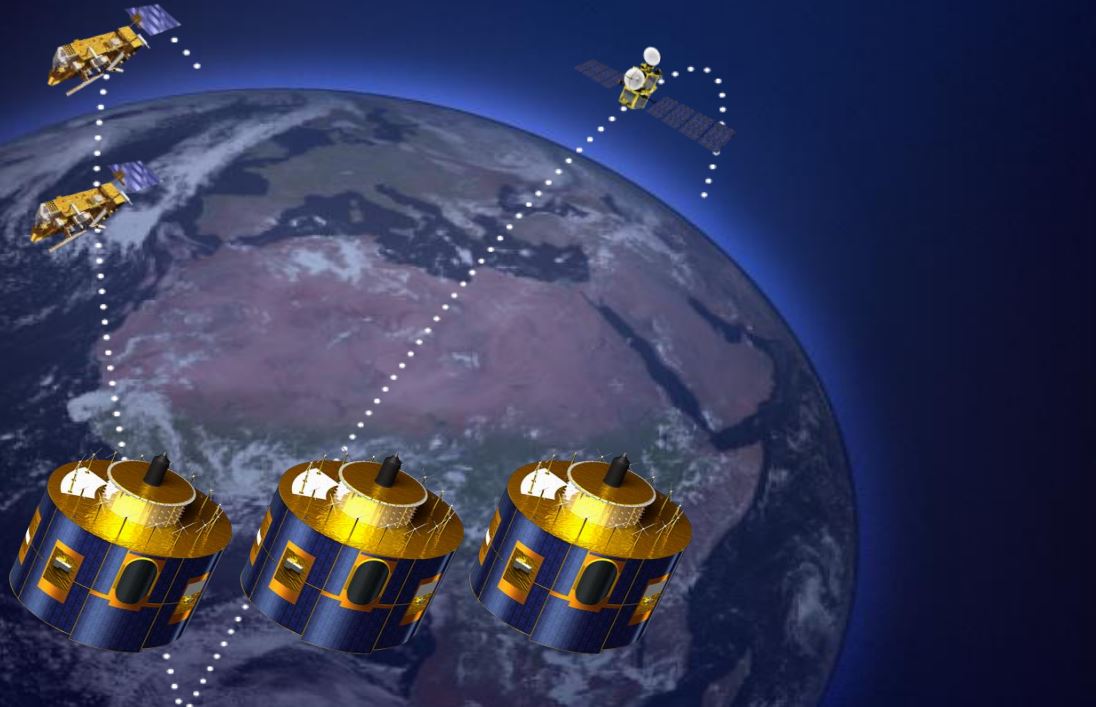
The Global Precipitation Measurement (GPM) mission is an international network of satellites that provide next-generation global observations of rain and snow. The GPM concept centers on the deployment of a GPM Core Observatory satellite (launched Feb 2014), which is a joint NASA/JAXA partnership. The GPM Core Observatory operates an advanced radar and radiometer system to measure precipitation from space and serves as a reference standard to unify precipitation measurements from a constellation of research and operational satellites.GPM has a unique role in providing datasets for science and societal applications related to the Earth's water cycle at both regional and global scales and over long time periods if one includes the 17-year record of precipitation from the Tropical Rainfall Measuring Mission (TRMM) along with the expected 10 years from GPM. GPM is a mission with both scientific and application goals and as such has both high-quality research data products and near real-time (NRT) data products. The NRT products are released 1-6 hours after data collection and are important for operational users and weather related disaster applications. Some products are every 30 minutes and at a 0.1deg by 0.1deg (~10km by 10km) footprint. The research products are used for scientific research and climatology and weather/climate models. During this lecture information will be presented on how the satellite instruments work, the retrievals algorithms perform, the data is used for scientific investigations and societal applications such as floods, landslides, cyclones, and how to obtain GPM datasets.
Rob Roebeling presents the concept and the applicability of the method developed at KNMI to calculate precipitation occurrence and intensity from cloud physical properties retrieved from passive imager satellite data onboard geostationary satellites.
Length: 30 min
Author: Rob Roebeling (EUMETSAT)
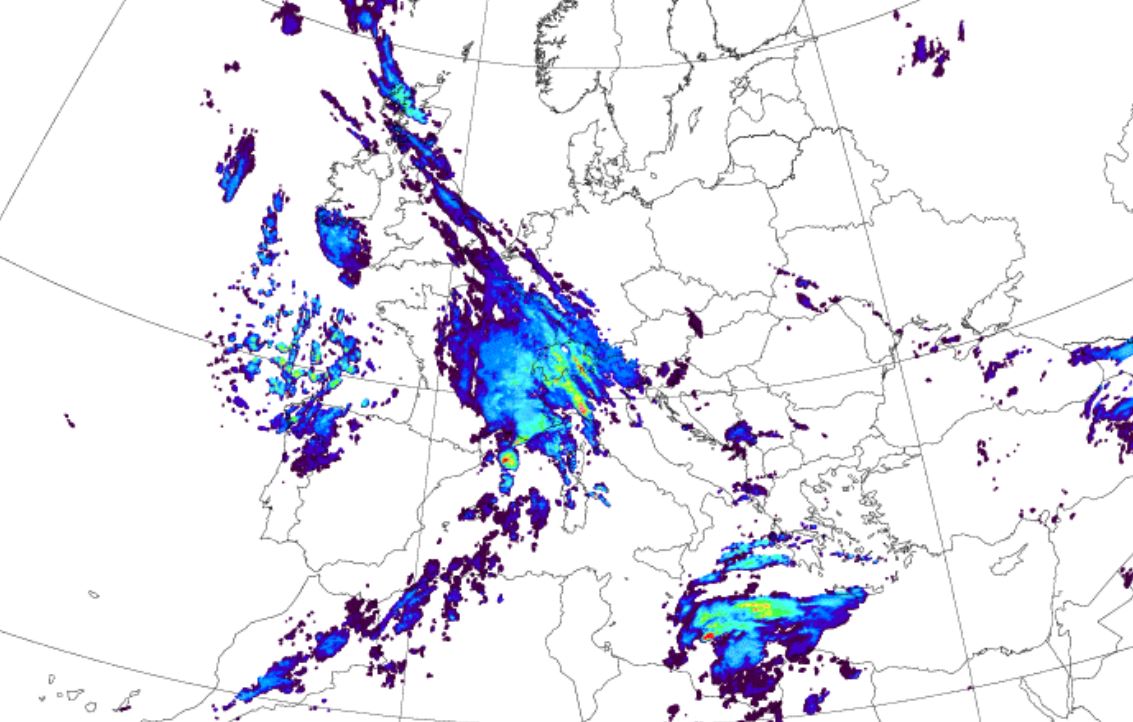
This lecture presents the concept, the validity, and the applicability, of the method developed at the Royal Netherlands Meteorological Institute (KNMI) to calculate precipitation occurrence and intensity from cloud physical properties retrieved from passive imager satellite data onboard geostationary satellites.
A brief introduction will be given on the concept of the cloud physical properties retrievals and the precipitation retrievals, as well as an underpinning why cloud physical properties are pre-eminently suitable for quantitative precipitation retrievals. The validity of the precipitation retrievals will be demonstrated for Europe (and Africa), using weather radar and gridded rain-gauge data to perform a triple-collocation statistical evaluation. For this evaluation, the precipitation retrievals are derived using the Spinning Enhanced Visible and Infrared Imager (SEVIRI) onboard Meteosat Second Generation satellites, the weather radar data are obtained from the common European integrated weather radar system, and the gridded rain gauge observations are obtained from the Global Precipitation Climatology Centre (GPCC) and/or the European Climate Assessment and Data set (ECA&D). The spatial and temporal dependence of the respective errors are presented and discussed.
The results suggest that the gridded rain-gauge datasets agree very well with the precipitation retrievals from SEVIRI, while they agree weakly with the weather radar observations. Part of these differences is caused by the fact that the weather radar products are based on different radars and algorithms, whereas the precipitation retrievals from SEVIRI have the advantage to be based on a single instrument. Since observations from single weather radar can be used to determine temporal variations in precipitation it is concluded that these observations are best suited for studying the diurnal or seasonal variations at a local scale.
The lecture will conclude with some examples for using the precipitation retrievals from SEVIRI for specific weather and climate applications.
Marie Doutriaux-Boucher explains the operational Multi-Sensor Precipitation Estimate (MPE) product.
Length: 30 min
Author: Marie Doutriaux-Boucher (EUMETSAT)
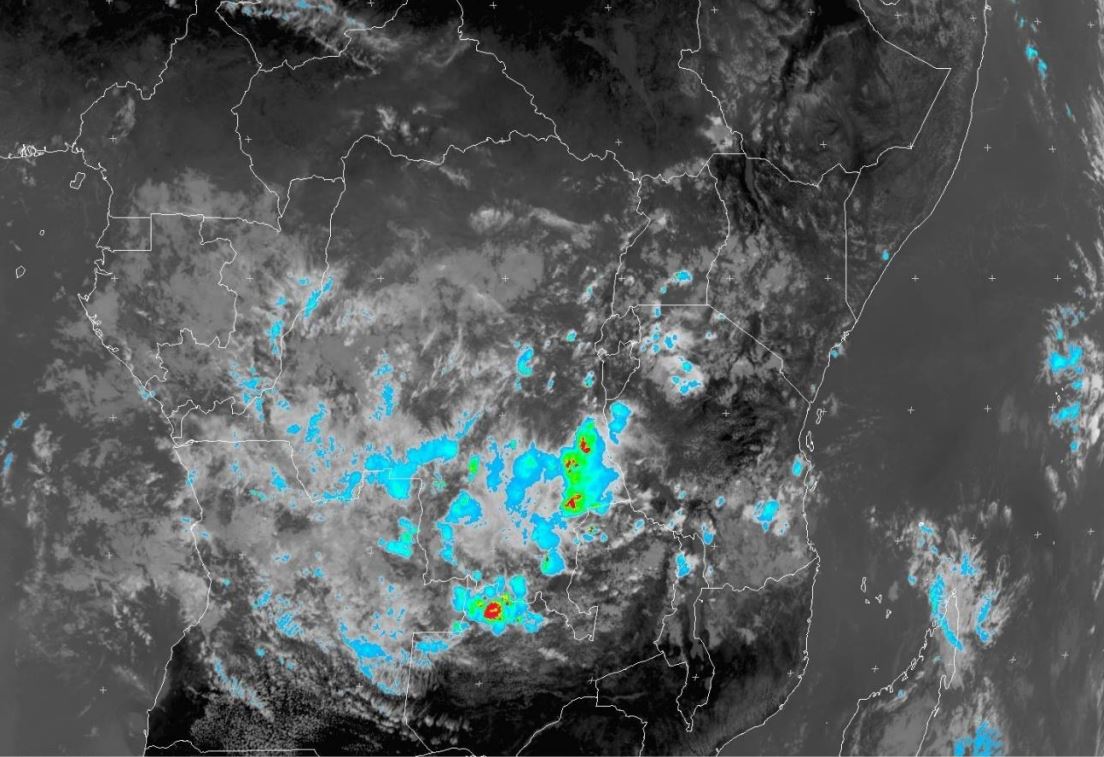
Since 2004, EUMETSAT is deriving the Multi-Sensor Precipitation Estimate (MPE) product operationally. The MPE product retrieval is based on a blending technique that uses microwave information from SSMI-S instrument onboard DMSP-F16 polar satellite and infrared information from the Spinning Enhanced Visible and Infra Red Imager (SEVIRI) instrument onboard MSG geostationary satellites. It consists of a rain rate given every 15 minutes at MSG pixel resolution (3x3km2). Although the retrieval is not a state-of-the-art technique, the product has proven to be quite robust and valuable for deep convective precipitation detection. This presentation will present the MPE product and show some example of potential improvements for future SEVIRI precipitation product.
Federico Porcu gives an overview on the Hydro-SAF precipitation products.
Length: 49 min
Author: Federico Porcu (University of Bologna)
The Satellite Application Facility for supporting operational hydrology and water management (H-SAF), established in 2005 as part of the EUMETSAT SAF network, is designed to provide the user community with new satellite-derived products from existing and future satellites with sufficient time and space resolution to satisfy the needs of operational hydrology. Three hydrological variables are considered(soil moisture, snow at the ground and precipitation) and a number of related parameters are made available to the user community, with a quantitative description of their accuracy.
Precipitation products are derived from algorithms based on different satellite data (active and passive microwave, visible/infra-red) and approaches (artificial neural network, Bayesian statistics, pattern recognition) to provide the most advanced set of precipitation product over Europe, and, in the next future, over Africa. The use of H-SAF precipitation products to study the severe meteorological events occurred in Italy in the autumn 2014 showed their potential as additional tools in monitoring heavy rainfall, especially in cases when conventional, ground-based instruments are not able to fully describe the precipitation pattern and intensity.
Anke Thoss provides an overview on PPS rain retrieval methods.
Length: 30 min
Author: Anke Thoss (SMHI)
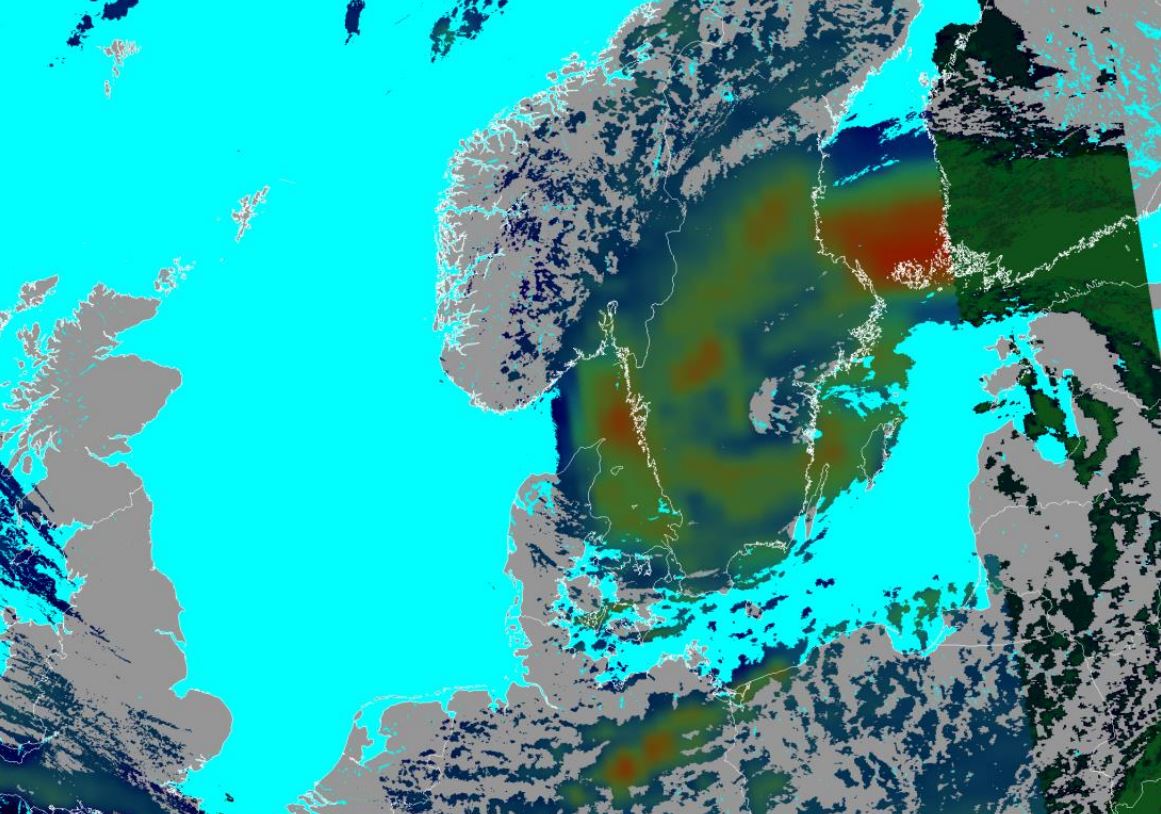
Anke Thoss starts her presentation with some thoughts on satellite derived rain rates and rain probabilities from LEO and GEO satellites. She points out that satellite derived rainfall products are especially helpful in regions without radar coverage. The precipitating cloud product is presented with an outline of the product algorithm. She demonstrates the product which is visualized in RGB colours reflecting the likelihood of instantaneous precipitation classes. A product validation based on version 2008 (product unchanged since then) is presented. The presentation ends with a look into the future, the MetOp second generation and its impact on the precipitation product.
Izidor Pelajic focuses on NWC-SAF precipitation products derived from EUMETSAT MSG SEVIRI satellite data with the aid of numerical weather predictions from ECMWF and/or ALADIN models.
Length: 30 min
Author: Izidor Pelajic (DHMZ)
EUMETSAT satellite derived or satellite-NWP combined precipitation estimators like Multi-Sensor Precipitation Estimate (MPE) and Nowcasting SAF Convective Rainfall Rate (PGE05 CRR) or Cloud Physical Properties Convective Rainfall Rate (PGE14 CRPh) are best used for precipitation diagnostic and analysis in convective environment. Full benefit of those products is best demonstrated in the regions with none or poor meteorological radars coverage. As with any satellite derived estimator/product, there are both benefits and limitations.
Here we will focus on Nowcasting SAF precipitation products derived from EUMETSAT MSG SEVIRI BS satellite data with the aid of numerical weather predictions from ECMWF and/or ALADIN models. Those products are being used operationally at DHMZ.
Remi Roca explains the functioning of the retrievals and emphases on the characterization of the errors and uncertainties associated with the satellite products.
Length: 30 min
Author: Remi Roca (OMP / LEGOS)
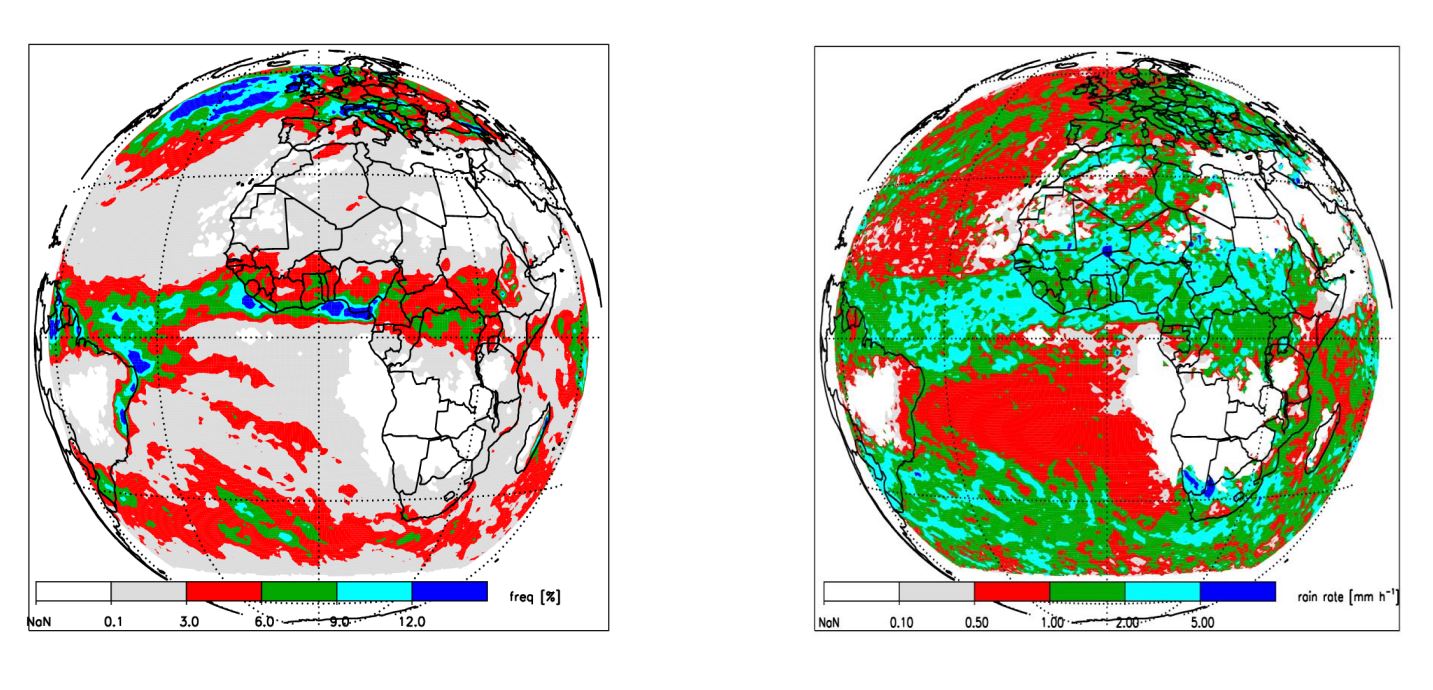
In this lecture, I will focus on the rainfall in the tropical regions and I will present the multi-platforms precipitation products that are available. I will explain the functioning of the retrievals and will put the emphasis on the characterization of the errors and uncertainties associated with the satellite products. Time will be devoted to the introduction of the passive microwave Global Precipitation Measurements constellation with emphasis on the Megha-Tropiques mission. An effort will be made to showcase what the end user can expect from the products developed in many centers worldwide with examples from various validation campaigns. I will end the lecture with a brief presentation of the activity and available resources of the International Precipitation Working Group from WMO/CGMS.
Jochen Grandell introduces the new LI instrument on MTG.
Length: 30 min
Author: Jochen Grandell (EUMETSAT)
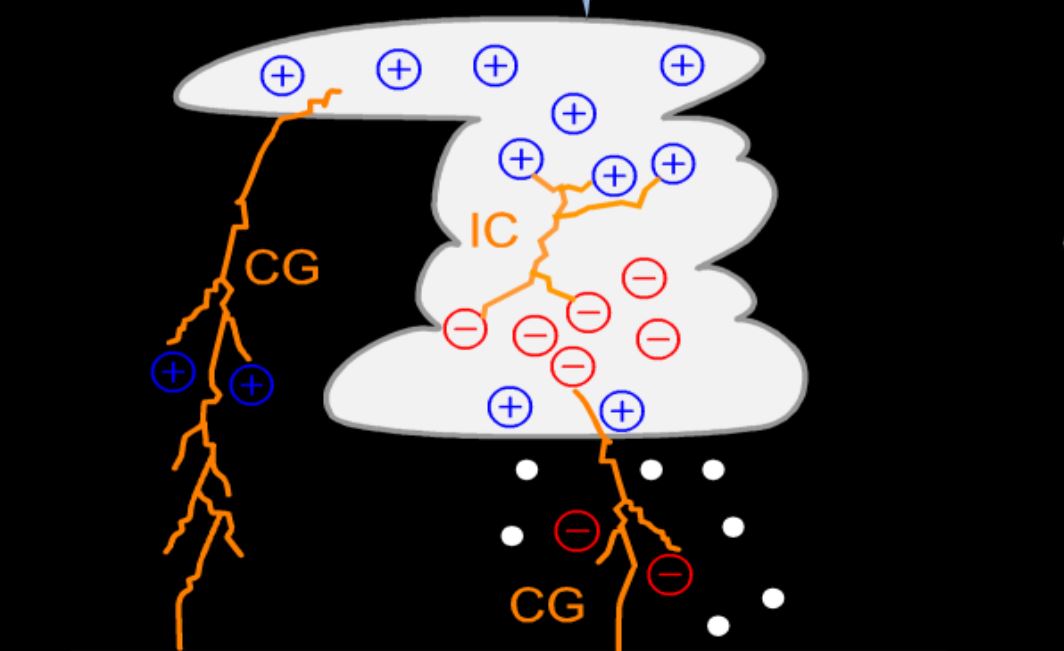
The Meteosat Third Generation Imaging satellite will include in addition to the Flexible Combined Imager (FCI), which is a continuation of the imaging mission, a Lightning Imager (LI) which is a completely new mission. The MTG LI will complement existing ground based capabilities for the detection and location of lightning with information on cloud-to-ground (CG) and cloud-to-cloud or intracloud (CC/IC) discharges, i.e. total lightning. The presentation will cover the background for lightning detection from space, including the detection and processing principles, and will concentrate on the meteorological products from the lightning imager. These include lightning flashes as well as accumulated lightning products.
Geoffrey Stano gives a presentation on total lightning observations from ground-based lightning mapping arrays.
Length: 30 min
Author: Geoffrey Stano (NASA SPoRT)
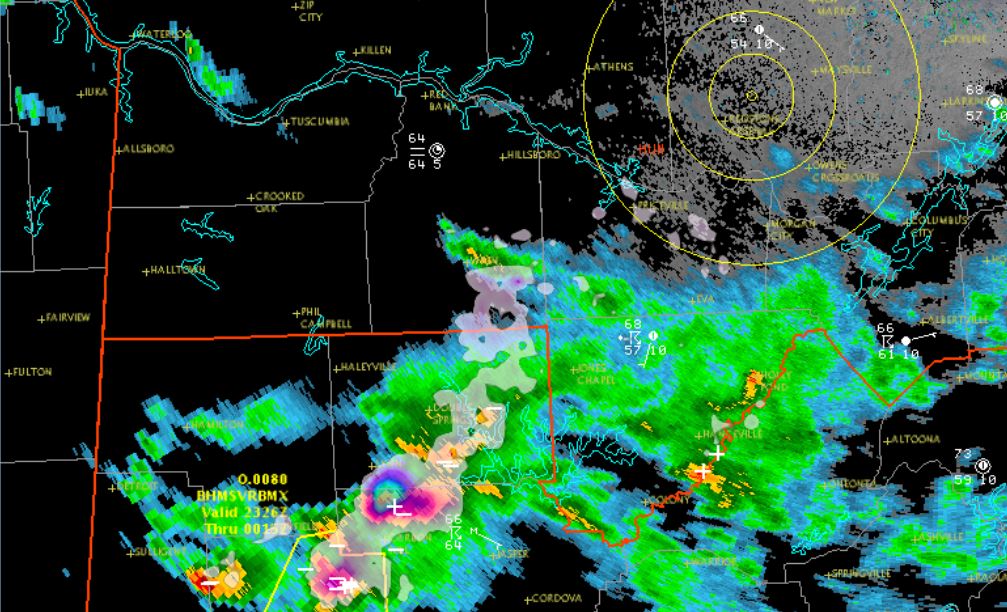
NASA’s Short-term Prediction Research and Transition (SPoRT) center has been a leader in transitioning total lightning observations from ground-based lightning mapping arrays (LMAs) to operational forecasters. This effort began in 2003 with a single, NASA-owned LMA and has since expanded to include multiple LMAs focusing on warning decision support, lightning safety, and aviation forecast needs. This presentation will cover SPoRT’s total lightning activities, focusing on operational applications both with the LMAs directly and in preparation for the GOES-R Geostationary Lightning Mapper.
Izidor Pelajic gives a presentation on the evaluation of precipitation products from the NWC-SAF.
Length: 30 min
Author: Izidor Pelajić (DHMZ)
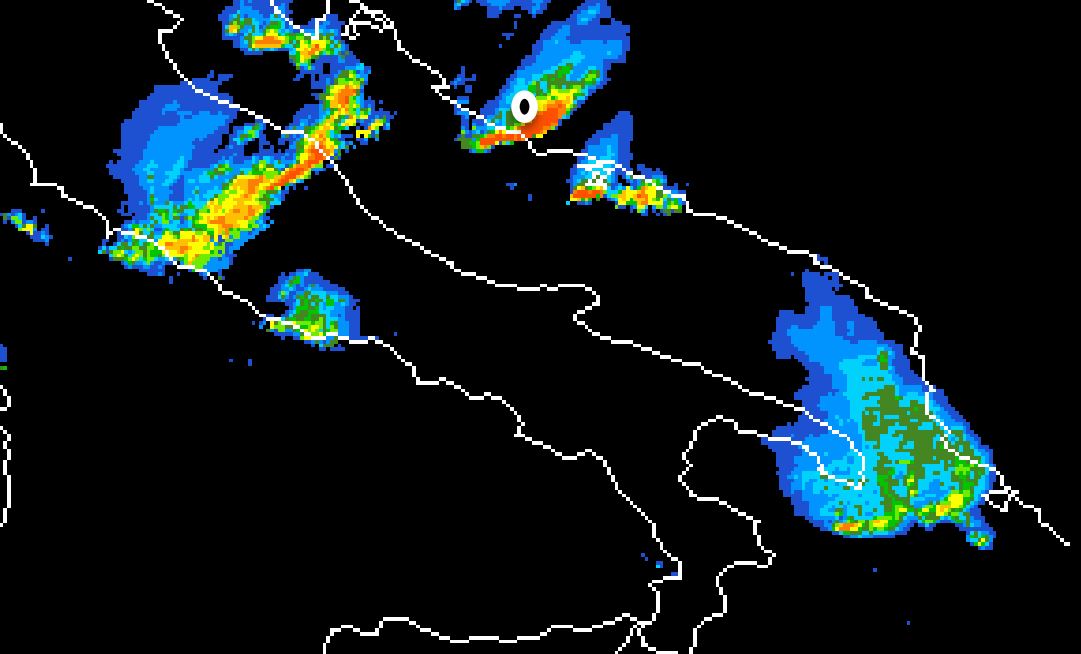
Croatian Adriatic coast is one of the rainiest areas in Europe. Large parts of the coast are not covered by the Croatian Radar network. The Croatian Weather Service (DHMZ) uses data from the NWC-SAF precipitation products to complement Radar data. Results from a validation campaign, using Radar and rain gauge data, will be shown in this presentation.