
Weather
Katarina Katušić talks about Croatian Met Service work principles and schedules, case study and satellite products used during operational shift work.
The Weather and Marine Analysis and Forecasting Sector is a part of the Croatian Meteorological and Hydrological Service (DHMZ), and it is in charge of weather forecasts and warnings for the public and numerous companies. Over the years, we have gone through many challenges. Quite recently, during the lockdown, the earthquake severely damaged our headquarters, and even with those difficulties the work did not stop. We also prepare and present weather forecasts for national television. Furthermore, this presentation will cover the usage of weather satellite products in daily operational work.
Lecture slides
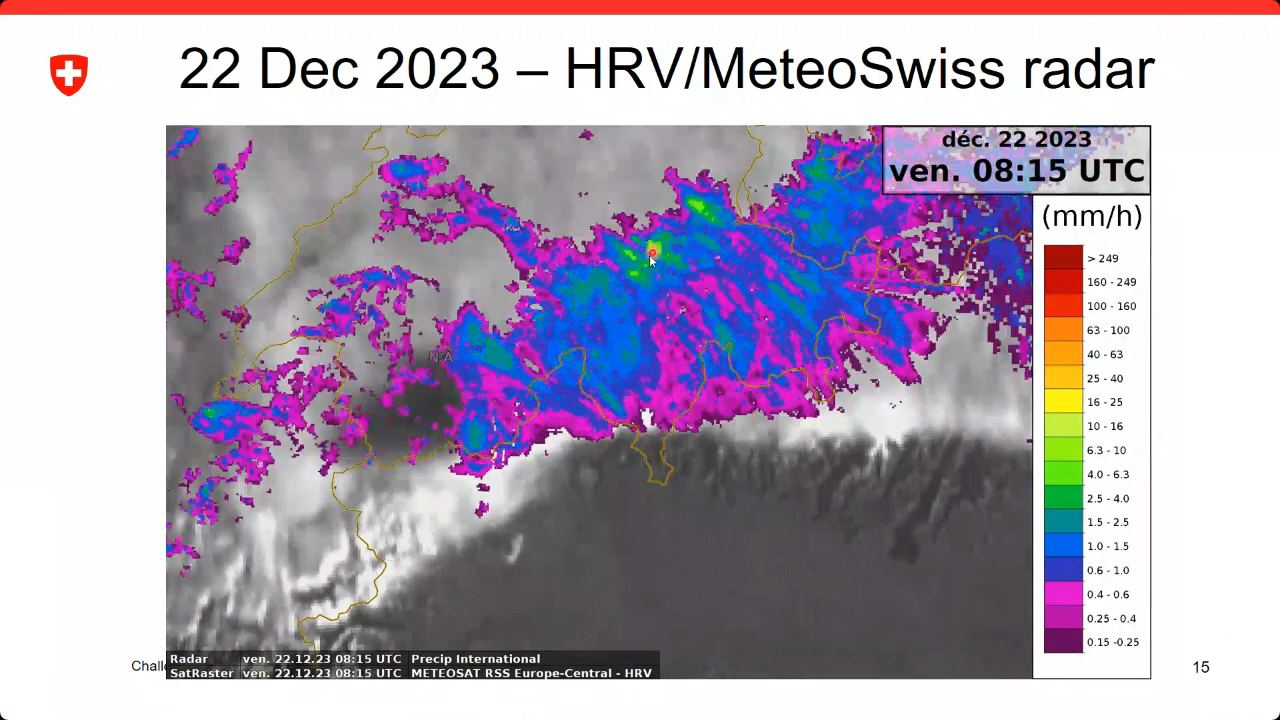
Marco Stoll shows the importance of mountain waves in aviation forecasting.
Meteorological information is crucial for flight safety and efficiency. Mountain waves are an example of a potentially hazardous phenomenon for aviation that meteorological watch offices need to monitor and forecast. The typical appearance of the phenomenon in satellite imagery is illustrated, thereby making use of various MSG channels and RGB products. The difficult task of quantifying vertical speeds and estimating the degree of turbulence associated with breaking waves is discussed with the aid of NWP cross sections.
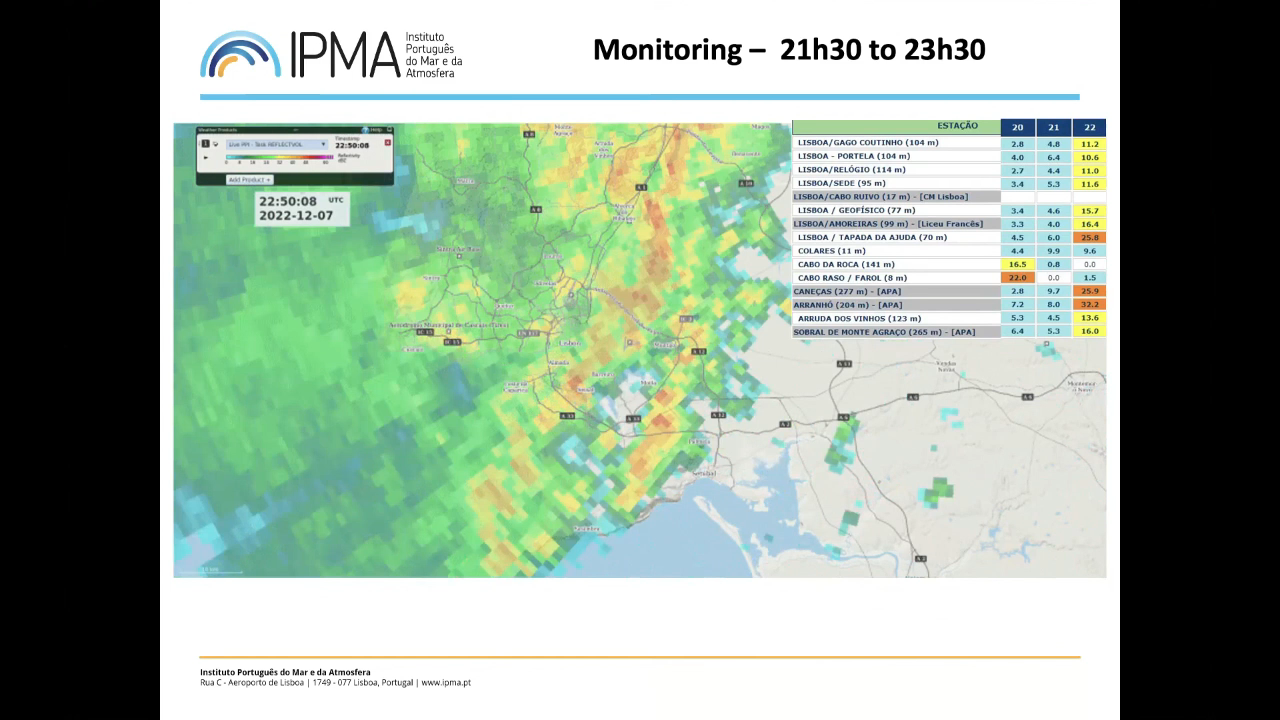
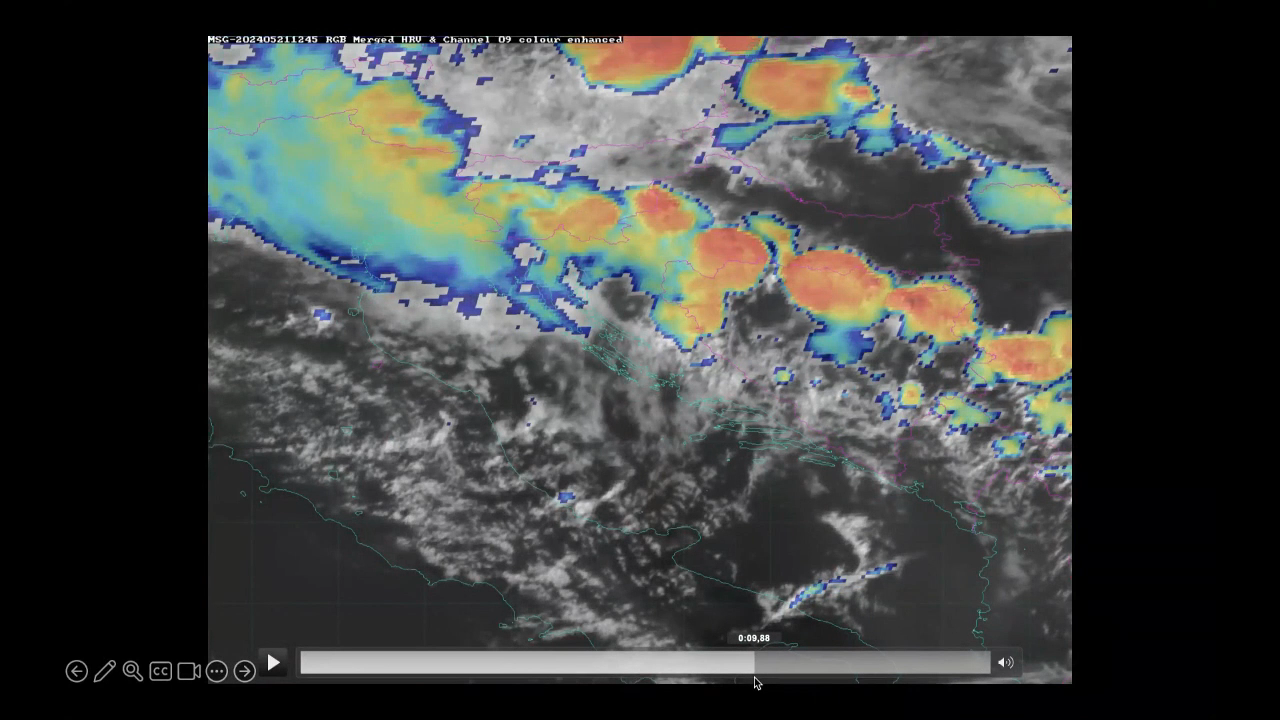
Jorge Ponte shows the challenges of being a forecaster, issuing warnings and discusses extreme precipitation event that affected Lisbon.
Extreme rainfall events in December 2022 caused significant losses in Lisbon, Portugal. This presentation examines these events to discuss whether it was possible (or not) to make a better forecast and issue earlier warnings. By analyzing various numerical model products from the preceding days alongside real-time monitoring data (satellite, radar, stations), the presentation will explore the operational forecaster's decision-making process during extreme weather situations.
Lecture slides
On 1 February 2024 H SAF held a webinar on the new Moodle e-learning platform.
On 1 February 2024 H SAF held a webinar on the new Moodle e-learning platform. Details about the platform were presented as well as case studies on soil moisture, snow and precipitation.
Go to webinar
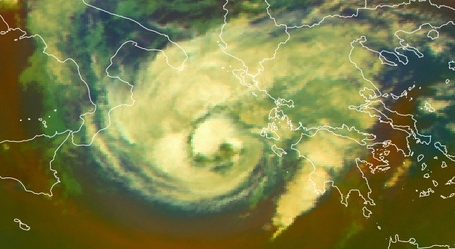
A new conceptual model on Mediterranean hurricanes - "Medicanes".
Medicanes are rare, intense and destructive warm-core cyclones occasionally generated in Mediterranean Basin.
Compared with tropical cyclones, medicanes are weaker and smaller in size, with diameters under 300 km, while the diameter of a hurricane is larger than 1000 km. Hurricanes move in general from east to west due to easterly winds, while medicanes generally (but not always) move from west to east due to the mid-latitude westerlies.
Medicanes mostly occur in the western Mediterranean and in the region extending from the Ionian Sea to the North African coast. There is strong variability from year to year without any significant trends.
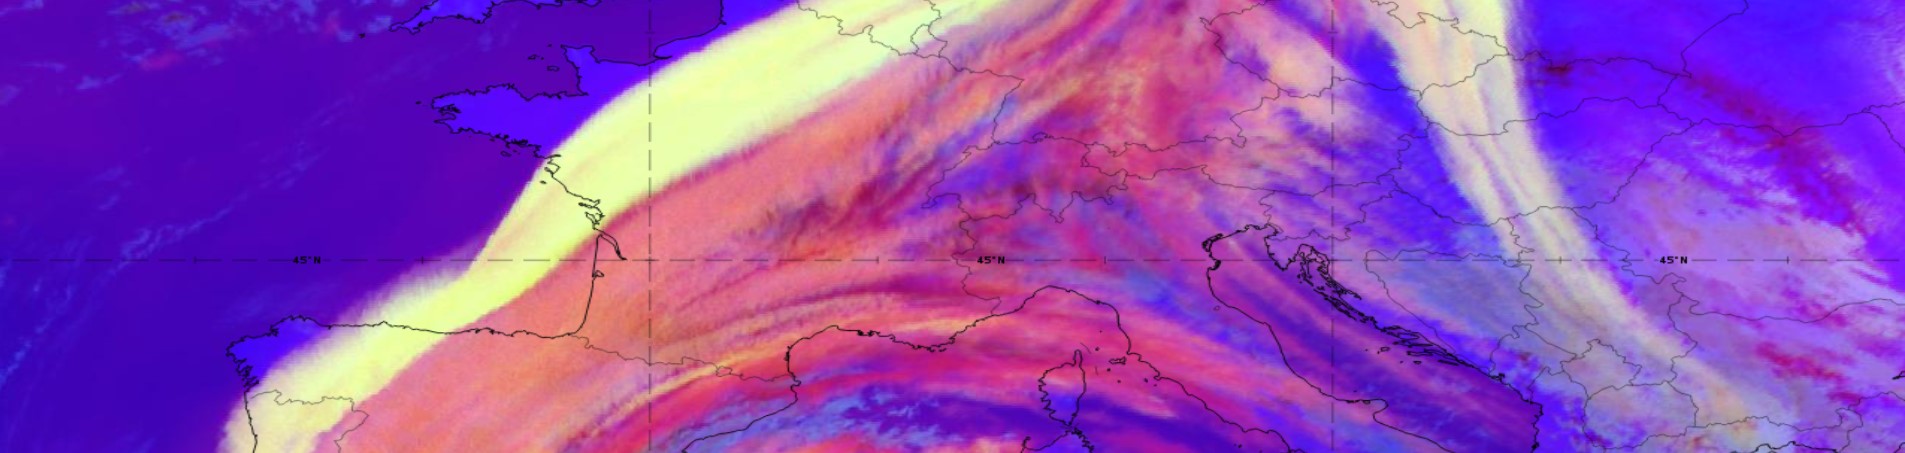
A conceptual model on DIBS: A special kind of Cirrus clouds formed by dust
The strongest influence of DIBS, and especially of dusty cirrus, on surface weather is mainly the reduced solar radiation reaching the ground as dust particles act as condensation nuclei and form clouds where otherwise no clouds would have been present. As current numerical weather prediction models do not accurately account for microphysical cloud formation processes caused by the additional dust at higher atmospheric levels, predicted maximum temperatures often have a considerable bias towards higher values.
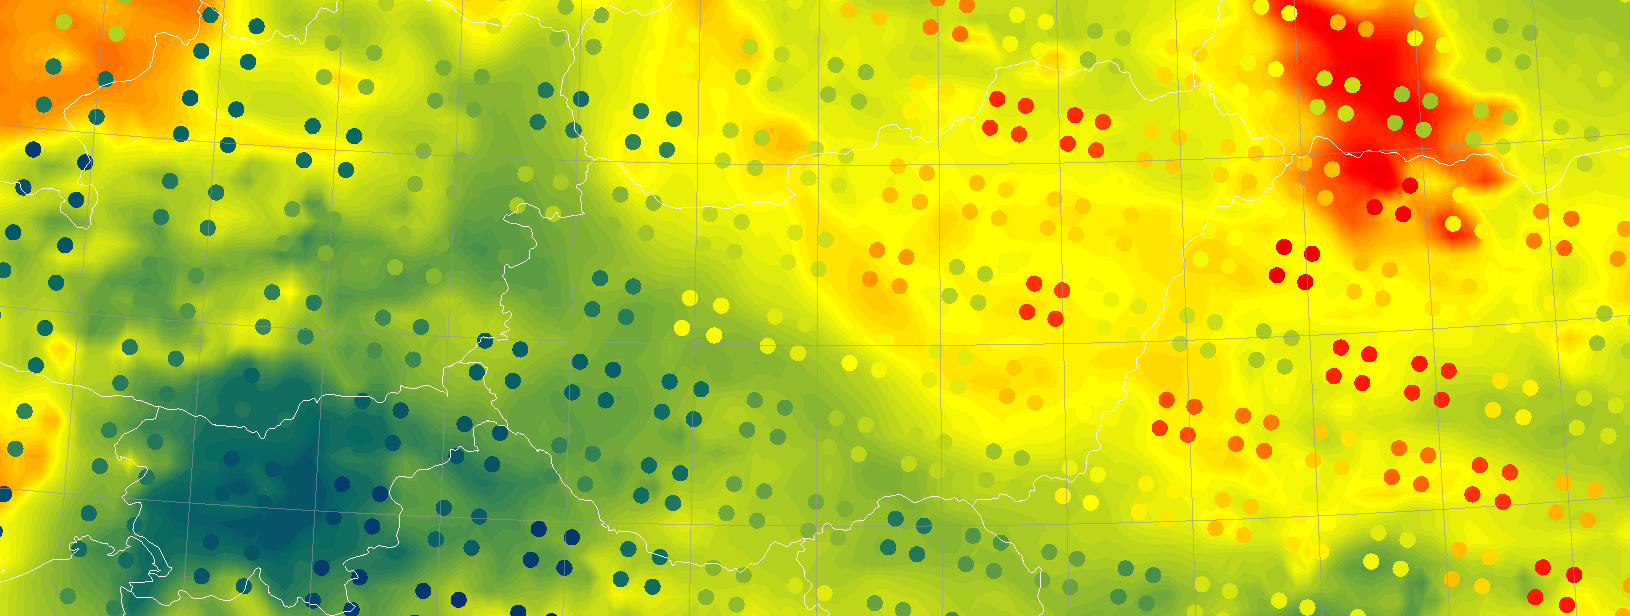
Case Study of the pre-convective environment of 19th May 2021 using IASI sounder data.
This Case Study of the pre-convective environment of 19th May 2021 using IASI sounder data focuses on exploring how the use of IASI retrievals added additional value to the forecast of the incoming storm over Hungary.
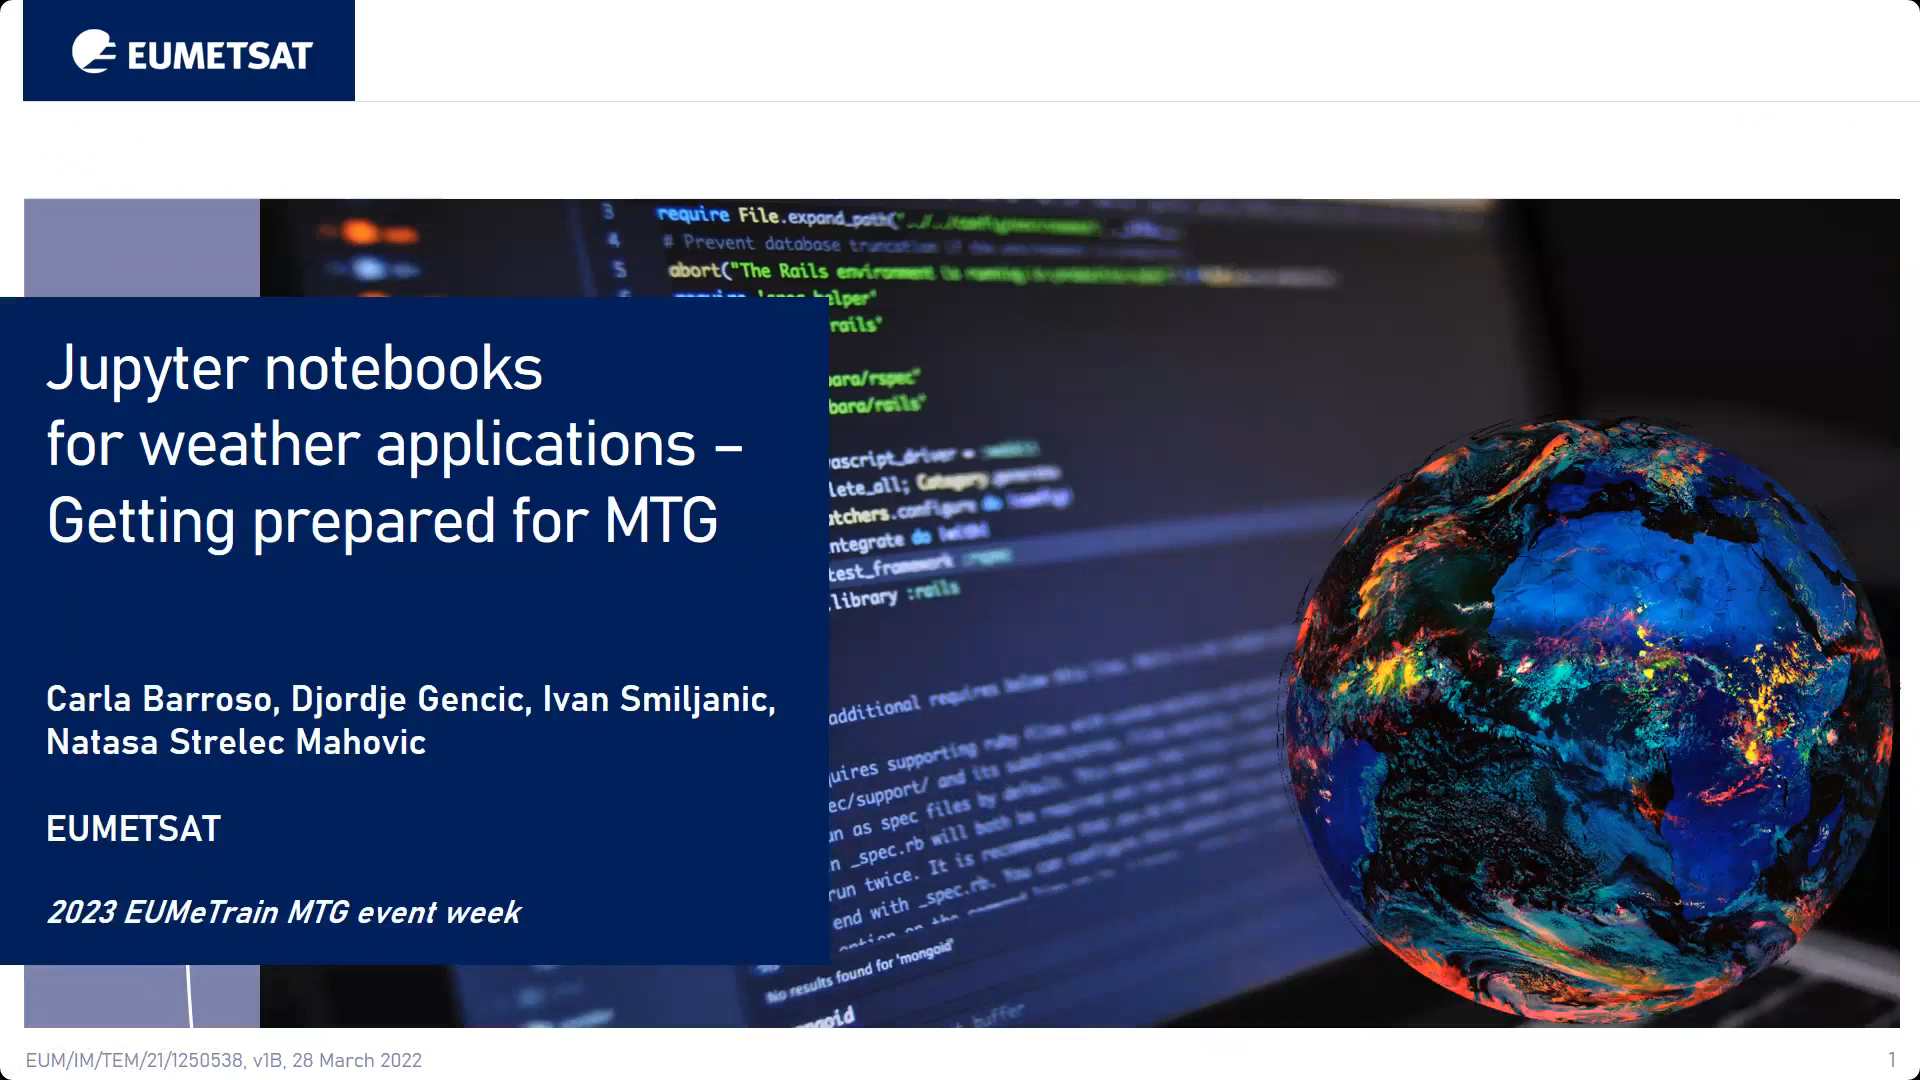
Carla Barroso talks about the EUMETSAT Jupyter Notebooks for MTG and how to use them.
To prepare users for the data from the MTG (Meteosat Third Generation) mission instruments, in particular the Flexible Combined Imager (FCI) and the Lightning Imager (LI), EUMETSAT has developed a series of Jupyter notebooks designed to demonstrate the capabilities of MTG instruments for weather applications. Some of these notebooks use proxy data from sources such as MODIS and GLM to allow users to familiarise themselves with the expected capabilities of MTG instruments, and there is a specific notebook focused on familiarising users with the FCI data format. These notebooks are available in the EUMETSAT GitLab repository https://gitlab.eumetsat.int/.
Lecture slides
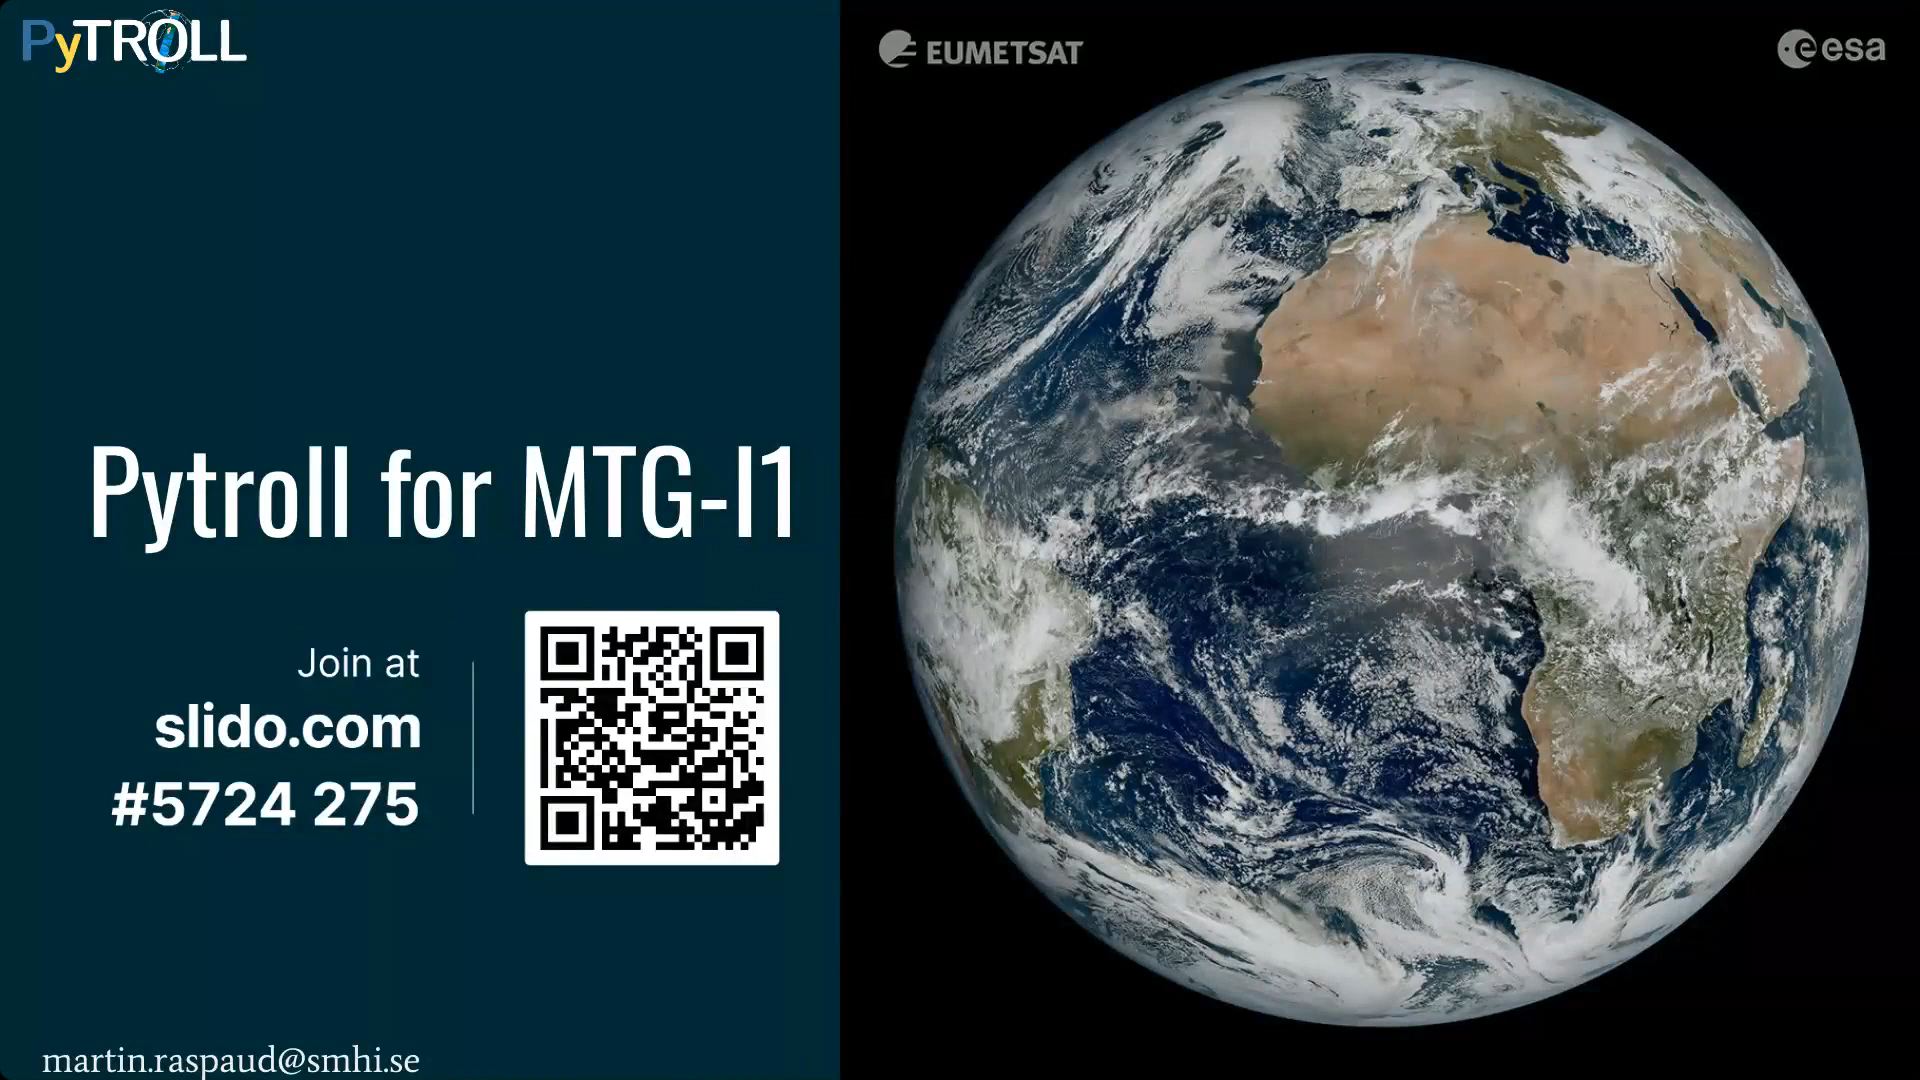
Martin Raspaud dives into what Pytroll is, how to use it and how to contribute to the project.
Developed jointly by professional software developers and experts in the remote sensing field, pytroll is a collection of free and open source python library for working with remotely sensed earth-observation data. MTG-I1, with its novel instruments, brings new information at a higher temporal and spatial resolution. While this is a challenge for data exploitation, the Pytroll team has been working hard to support the new data formats to allow working seamlessly with the new data and providing it with standard tools, both when working locally or in the cloud. Having EUMETSAT experts involved ensures state-of-the-art quality of the data. In this presentation, we will show how pytroll works and how it can be used for the exploitation of the MTG-I1 data as a seamless continuation of SEVIRI, both in operations and research.
Erdem Erdi discusses the technical aspects of the new MTG data.
MTG satellites will revolutionize the weather forecasting and nowcasting abilities over Europe by not only improving the legacy sensors but also introducing new ones. However, the data volume to be received and processed by the end-users will be much higher in order of magnitude with regards to the current MSG satellite data. In this presentation, the main access methods to the near real-time MTG data will be covered along with data format highlights.
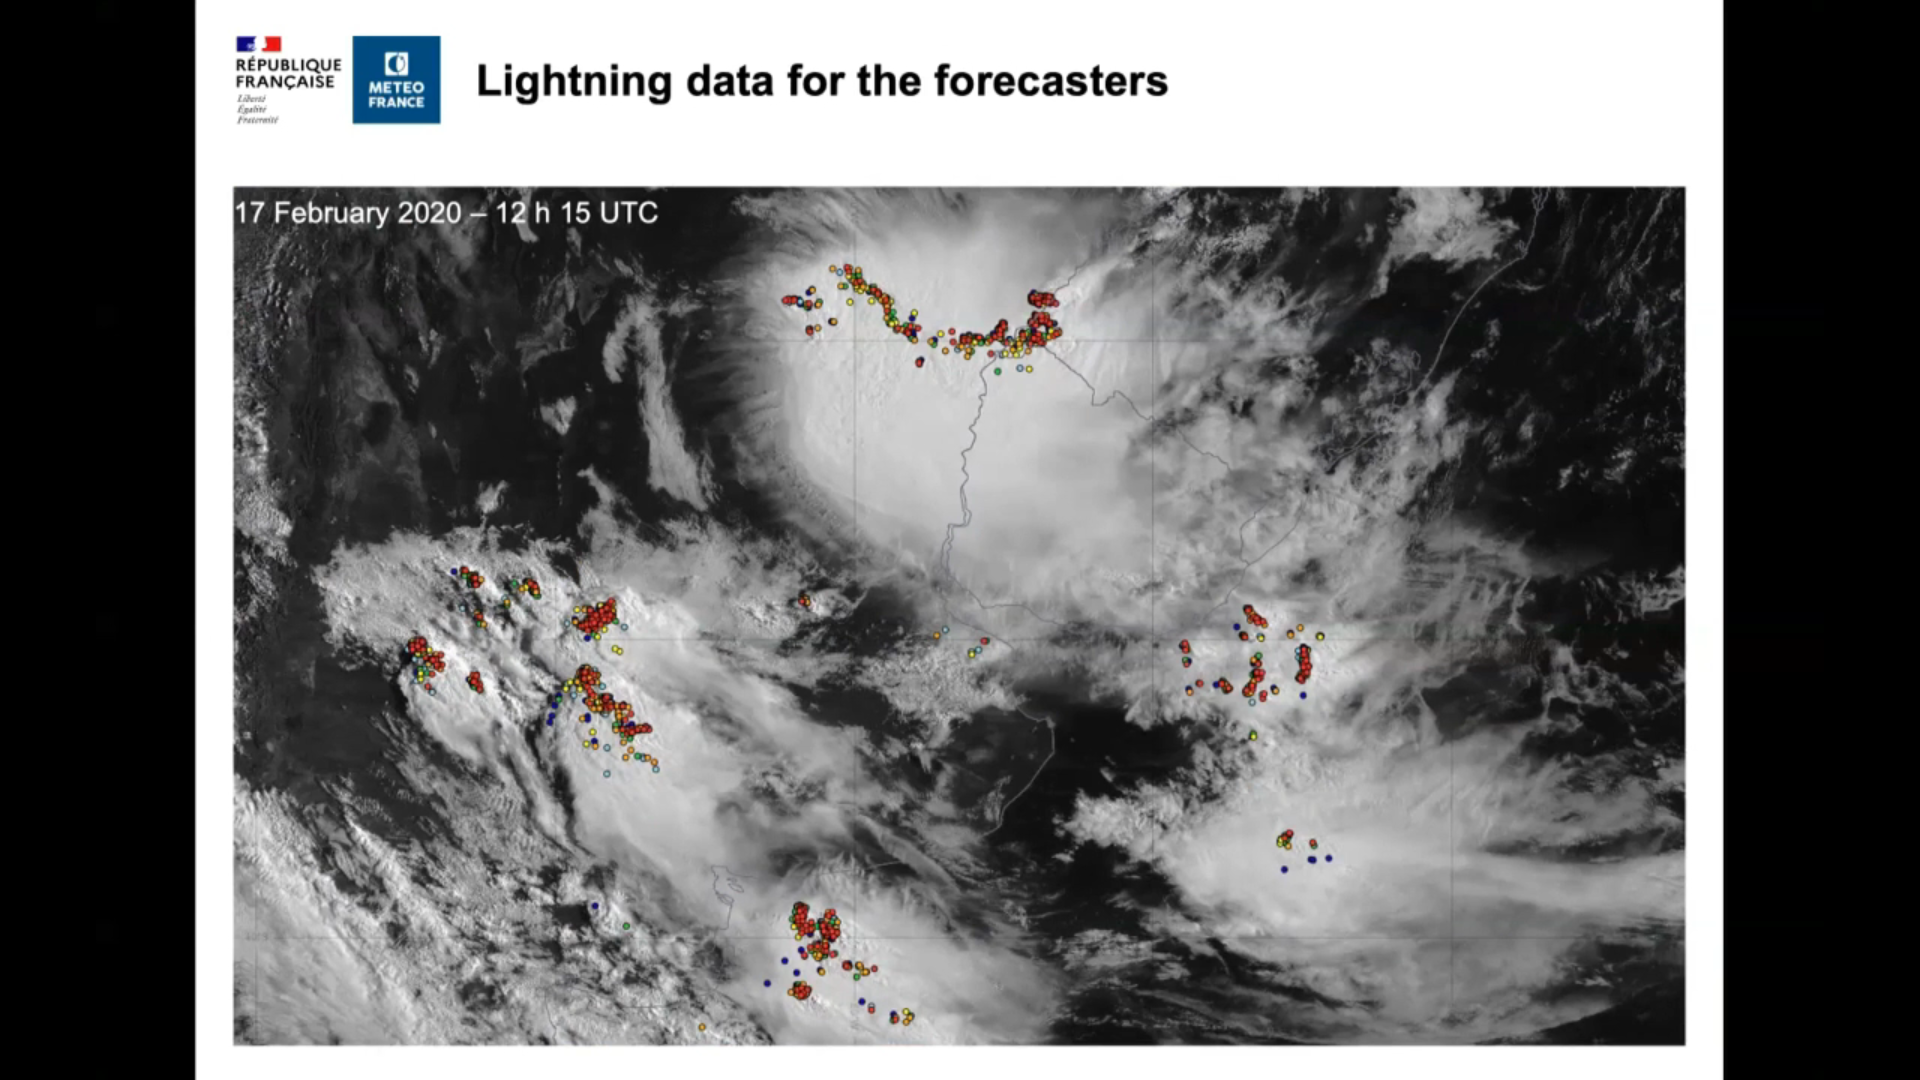
Sylvain Le Moal talks about use of lightning data at Meteo France.
Meteo-France already has experience processing data for French overseas territories from next-generation satellites currently in operation, such as United States’ geostationary satellites. The Goes series weather satellites (Goes-16, -17 and -18), and the on-board Geostationary Lightning Mapper (GLM), have now been operational for several years. The GLM detects and maps total lightning – in-cloud, cloud-to-cloud, and cloudto-ground – continuously over the Americas and adjacent ocean regions. The performance of the GLM, the application and use of its data can be produced for forecasters, medias, and numerical weather prediction models.
Jos de Laat talks about the way KNMI applies GLM data.
About five years ago KNMI started its first exploratory steps towards working with American NOAA/GOESGLM data. Originally initiated as a way to prepare for the MTG-LI mission, the activities naturally developed, expanded while perspectives broadened. I will discuss this path from the first exploratory steps all the way to where we currently are and the – sometimes unexpected – spin-off activities. These include:
• volcano: early warning, KNMI GEOWEB and the BES dashboard
• operational monitoring: data exploration/handling/visualization
• near-real-time probabilistic lightning prediction: artificial intelligence
• airport: auto-METAR
• network activities
As KNMI is very much a hybrid institute build around operational weather forecasting on the one hand and scientific geophysical research on the other hand there are some interesting observations and lessons I have learned that I will share at the end of the presentation.