
Identify surface features
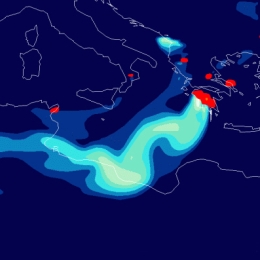
Presentation during the event week on Warning in October 2010.
Presentation by the LSA SAF by Carla Barroso on the Fire Radiative Power product which was developed and is used by IM (Portugal) assessing the risk of forest fires.
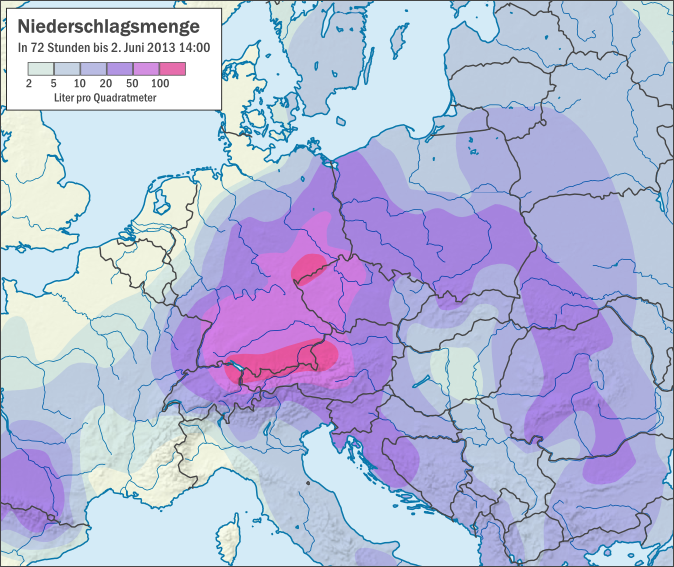
This case study is analysing floods that occurred in central Europe during the period of June 2013.
The case study is analyzing floods in central Europe during the period of June 2013. The case starts with the development of a trough over central Europe on 22 May, seven days before the floods. From 29 May on, the trough intensified the rainy weather, causing southern and southeastern Germany to experience continuous rain over several days. Altogether the countries of Germany, Poland, Czech Republic and Austria were seriously affected by floods and the damages in Bavaria (Germany) only were estimated to 1.3 billion euros.
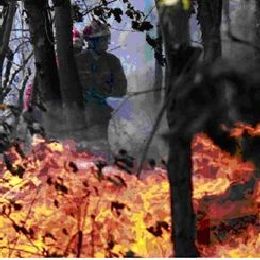
From 20 August to 2 September 2013 the Caramulo Mountains in central Portugal experienced a series of three large and devastating forest fire events.
From 20 August to 2 September 2013 the Caramulo Mountains in central Portugal experienced a series of three large and devastating forest fire events that caused a total burned area of about 9415.5 ha and 6 casualties. The Caramulo fires had overwhelming ecological, social and economic consequences that will be felt for several years. They were the result of a complex combination of variables from human factors to adverse meteorological and topographic conditions. This case study will address these variables of the Caramulo fires, which lead to environmental disaster.
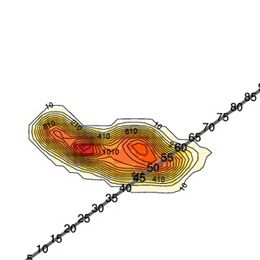
The case study treats a series of wildfire that rage across Madeira Island.
In early August 2016, a series of wildfires raged across Madeira Island, in the North Atlantic Ocean, prompting the evacuation of more than one thousand people, destroying about 105 homes as well as a five-star hotel in Funchal, the main city in Madeira, and causing the death of 4 people. Flights at Madeira airport were disrupted due to the smoke. The fires caused ca. 60 million euros in losses. An area of ca. 3000 hectares was burned. This case study investigates the synoptic background that lead to this natural disaster.
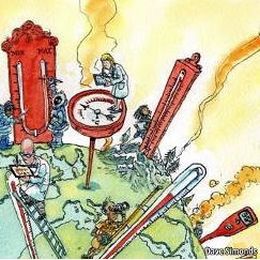
The purpose of this tutorial is to give an introduction into the topic of land surface temperature retrieval.
In this module we focus on the land and clarify the meaning of Land Surface Temperature (LST), a parameter often confused with air temperature, aerodynamic temperature or soil temperature. The term "Land Surface Temperature" is widely used by distinct research communities such as those of climate, numerical modelling or boundary layer studies while referring to different physical meanings. We take a deep look at LST by considering how this temperature can be obtained from satellite measurements and how it compares to other temperatures.
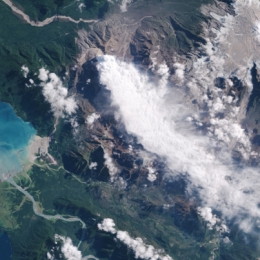
The training module aims at giving an overall view on the use of satellite data, particularly that provided by Meteorological satellites, for monitoring vegetation cover and properties.
The distribution of vegetation, its properties and state, is of major importance for a wide range of applications, namely; environmental management, natural Hazards monitoring, agriculture and forestry, climate change studies and numerical weather forecast models.
Changes in the landcover either caused by changes in land use, climate change or natural hazards (like forest fires or droughts, for instance) may have a huge social and economic impact. An example of this was the severe drought that stroke Eastern Africa in 2009, causing crops to shrink and threatening millions of people with starvation.
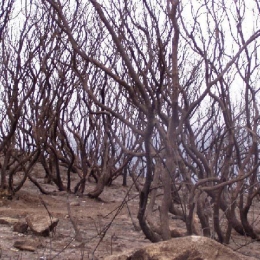
Every summer forest fires make it to the headlines. This training module will explain all the meteorlogical aspects associated to forest fires give you a wide range of products.
The past decade forest fires have received much media attention due to the impact it has in environmental terms. This CAL is mainly for forecasters that deal with forest fires. However, the module may be used by others dealing with forest fires like, civil protection agents, fireman or forecasters.
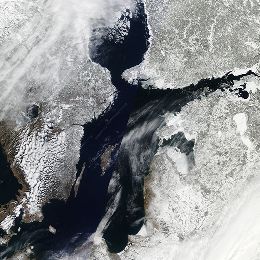
In this module you will learn how snow cover and snow water equivalent are determined by satellite instruments and how this data can be applied for regional climate studies.
Snow cover is an important climate variable on both local and global scales. It affects the planetary radiation budget through high albedo values. It influences the hydrological cycle globally and locally, and for many locations it is an important source of water. In this module you will learn how snow cover and snow water equivalent are determined by satellite instruments and how this data can be applied for regional climate studies.
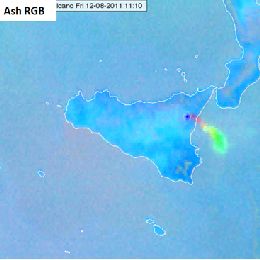
An intensive training module on the operational use of RGBs in the forecasting room.
The new generation satellite data contains more and more information offering increased insight into cloud and air mass characteristics. This poses a challenge: figuring out how to extract, distill and package the data into products that are easy for forecasters to interpret and use.
One might create numerous different kinds of RGB images. Satellite experts developed some optimally tuned RGB types for highlighting specific features. These are the so called standard RGBs recommended by EUMETSAT. The advantage of using standard RGBs is their easy comparability.
The aim of creating RGBs is to provide fast, easily understandable VISUAL information. A 'good' RGB should convey information that would be difficult or time consuming to assess visually from one or more individual single channel images. RGB image should be unambiguous and use intuitive colours to help highlighting important meteorological and surface features. RGBs provide useful information to forecasters, in particular when looking at animated image sequences. They preserve the "natural" look-and-feel of "traditional" satellite images, e.g. they preserve texture, and the patterns are continuous in time.
In this module you will learn more about the EUMETSAT standard RGBs: HRV Fog RGB, Snow RGB, Night Microphysics RGB and the Ash RGB.
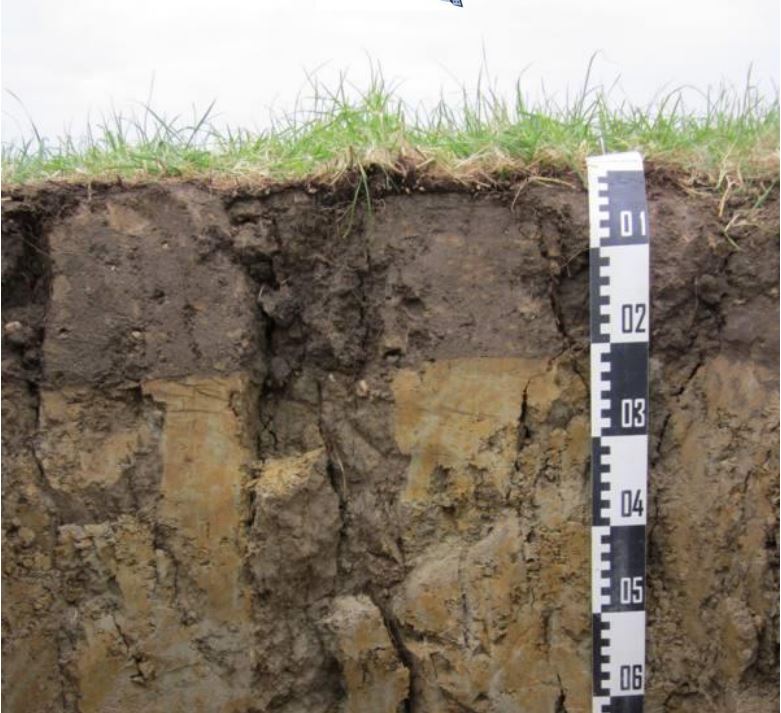
Presentation 4 the Environment Event Week 2016
Length: 30 min
Author: Stefan Schneider (ZAMG)
Droughts are one of the most severe natural hazards with regard to affected people, spatio-temporal extension and economic losses. At the same time, population growth is expected to put global agricultural production under increasing pressure. Thus, drought monitoring and forecasting systems would be essential for large parts of the globe, and satellites are a valuable data source to establish such monitoring systems.
The presentation will give examples on the relevant parameters measured by satellites, whereas the focus will be on soil moisture. Furthermore, the combination of satellite measurements and model forecasts will be described to point out the state-of-the-art possibilities in forecasting drought events. Examples from an existing system will be presented for the region of Eastern Africa.
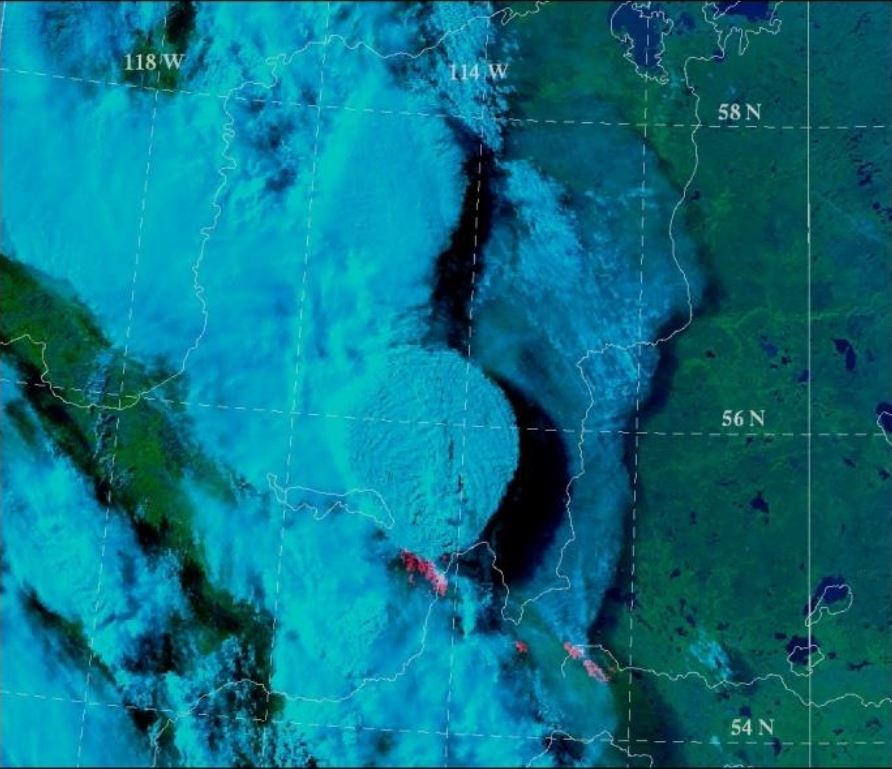
Presentation 6 in the Environment Event Week 2016
Length: 30 min
Author: Mike Fromm (NRL)
Pyroconvection is not a new concept. However, the idea that pyroconvection can be explosive enough to inject a smoke plume into the stratosphere that pollutes hemispherically, goes against the grain of textbook atmospheric physics. Since the discovery of forest fire smoke in the stratosphere, skepticism has given way to acceptance, understanding, excitement, and wonder. That is because pyrocumulonimbus (pyroCb for short) research continues to make more discoveries, involve growing collaborations, and invite new questions.
This presentation will be an overview of pyroCb research. It will focus on observations from satellite sensors. Emphasis will be on platforms such as MODIS, AVHRR, GOES, TOMS, OMI, GOME 2, and CALIPSO. Also to be explored will be the curious historic connection between pyroCb and volcanic eruptions.
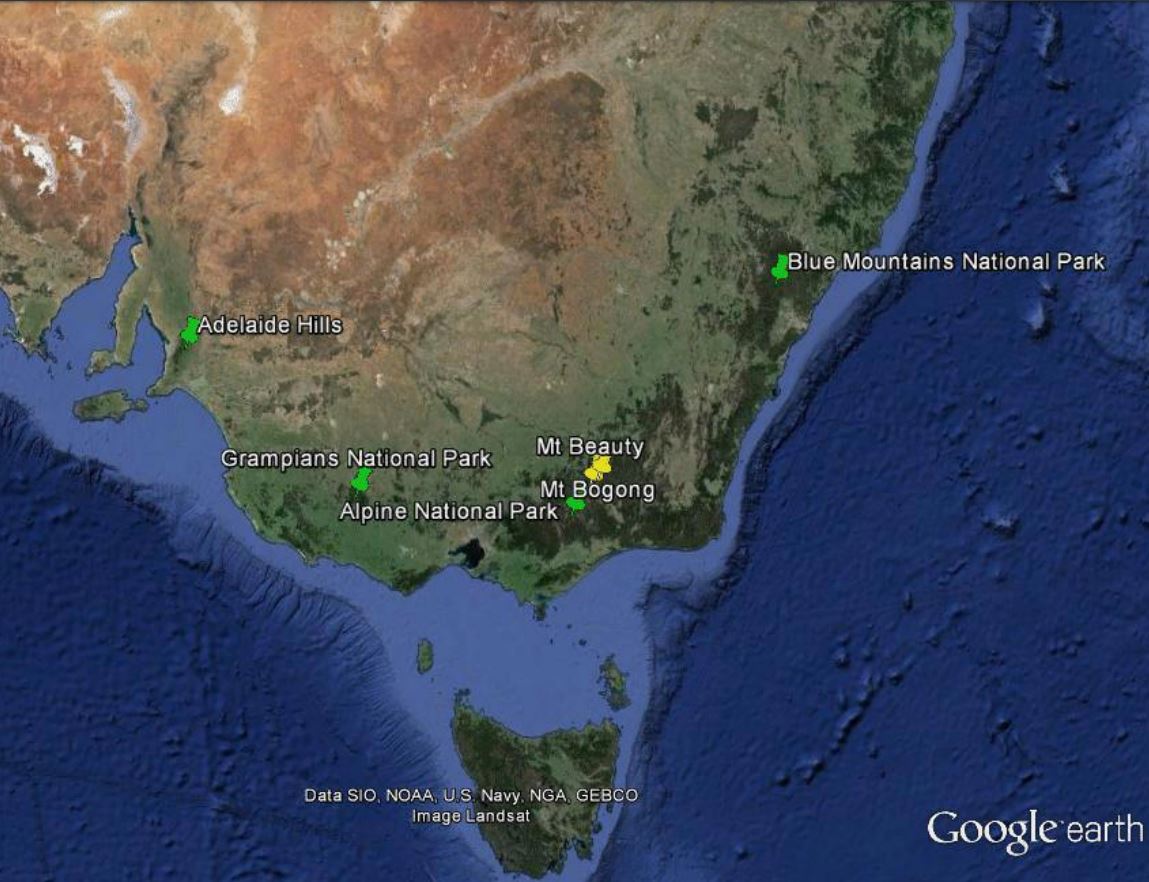
Presentation 7 in the Environment Event Week 2016
Length: 50 min
Author: Mike Willmott (BOM)
Apart from the central desert areas, the Australian landscape, from the tropics of Far North Queensland to the southern tip of Tasmania has climatic conditions and vegetation which are conducive to wildfires throughout the year. The most volatile of these areas being the south eastern parts of Australia which includes the states of South Australia, Victoria, New South Wales and Tasmania. Australia has large tracts of wilderness which can only be monitored by aircraft and satellite and as such, remote sensing for bushfires within the landscape is virtually mandatory throughout the dry season in the tropics and the summer periods for the southern states. This talk looks at some of the ways that Satellite Remote Sensing has assisted emergency managers for preparedness, response and recovery, the three most important factors for any emergency operation.