
Identify surface features
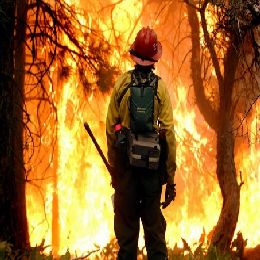
Lecture based on the detection of forest fire hot spots by satellite means, which is more important in regions with small population covered areas.
Forest fires, as a natural phenomena (e.g. ignited due to lightning), is important factor in natural living process of a forest. Nevertheless, problems occur because most of the forest fires are caused by a human action, thus are very difficult to predict in any form. Therefore this lecture is mainly based on detection of forest fire hot spots by satellite means, which is more important in regions with small population covered areas. Emphasis here is on the IR3.9 µm SEVIRI channel, which can be called window channel, but on the other hand it is close to a CO2 absorption band. The importance of this channel we can see through a Wien's law; 3.9 µm is peek wavelength of blackbody with temperature of around 750 K, which is very close to temperature of a fire flame during active phase of fire. Besides forest fire detection, in this lecture you can hear something about detection of aerosols coming from forest fires, identification of burnt areas and about Fire Risk products.
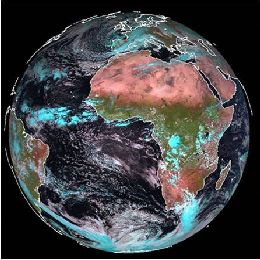
Lecture starts with explanation of Vegetation monitoring and some applications of Vegetation products, such as NDVI index, FVC index, LAI and FAPAR indices.
The new generations of sensors on board meteorological satellites (SEVIRI -MSG, ASCAT -EPS, etc. ) enabled a whole new range of products related to the properties of the surface. Applications of such products are great. Some of them are; Vegetation monitoring, Wild Fires detection, Floods and Heat waves monitoring, detection of Urban heat islands, Crop water requirements, etc.
Lecture starts with explanation of Vegetation monitoring and some applications of Vegetation products, such as NDVI index, FVC index, LAI and FAPAR indices. After that Evapotranspiration parameter and Reference evapotranspiration overview is given. And at the end Land surface temperature is observed and various applications of this product are discussed.
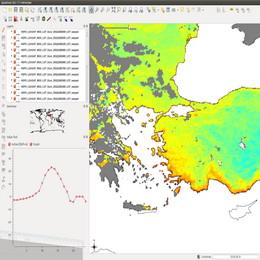
This one hour presentation takes focus on the characteristics of the product files that are produced and distributed by LSA SAF.
This one-hour presentation takes focus on the characteristics of the product files that are produced and distributed by LSA SAF. The structure of the files is explained and freeware tools are presented. All the relevant information is given for the obtaining LSA SAF products. More general product information is given for documentation and file structure of data. Also, this session is explaining how to use Quick visualization by means of HDFView, GIS tools for visualization and analysis (Quantum GIS, GRASS GIS and ILWIS) and tool for georeferencing LSA SAF products. At the end of presentation there are words about how to use Python scripting for building custom scripts or programs for accessing and manipulating Land SAF data.
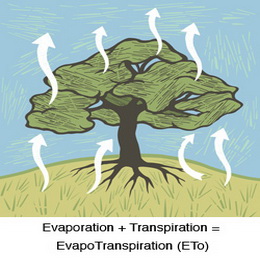
Evapotranspiration is a parameter closely related to vegetation state and stress. This session will show how this quantity is obtained within the LSA SAF.
Evapotranspiration is a parameter closely related to vegetation state and stress. This session will show how this quantity is obtained within the LSA SAF. Evapotranspiration is estimated using a land surface model forced with radiation and vegetation variables obtained from SEVIRI measurements. Very interesting Resistance scheme of this model is nicely explained using deviding image pixels into \'tiles\' of homogeneous vegetation types. Input and output of this model is also mentioned. Presentation is showing validation and incomparison of results together with possible applications of it.
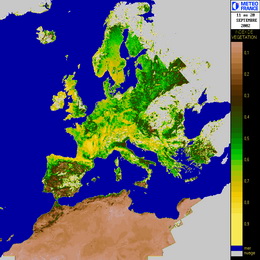
Presentation giving an overview on the use of satellite data, particularly that from Meteorological satellites, for monitoring vegetation cover and properties.
The current presentation gives an overview on the use of satellite data, particularly that from Meteorological satellites, for monitoring vegetation cover and properties. Some basic physical principles are first presented and then some RGB images are shown, allowing to identify different features in the surface of the earth. Further information on vegetation is given by a wide range of empirical indices, from which one of the most used is the NDVI. There are however some disadvantages on using such vegetation indices. Other parameters more related to vegetation properties and health than these conventional empirical indices are available from the LSA SAF. These are the Fractional Vegetation Cover (FVC), the Leaf Area Index (LAI) and the Fraction of Absorbed Photosyntetically Active Radiation (fAPAR). The algorithm rationale for deriving such parameters is explained and some validation results are presented. Finally, the use of these products in several applications is shown.
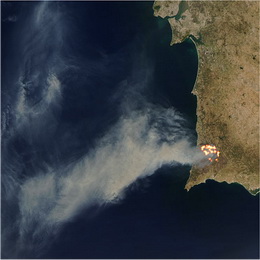
Discussion is held on various techniques of mapping burnt areas from remotely sensed data, describing the main sources of errors and strategies to overcome them.
Discussion is held on various techniques of mapping burnt areas from remotely sensed data, describing the main sources of errors and strategies to overcome them. Focus of first part of this session is so-called Fire Detection and Monitoring (FD&M) product, which provides continuous monitoring of fire activity over Africa and Europe. This product relies on Fire Detection Algorithm called FiDAlgo (based on so-called contextual algorithms), is an operational procedure that allows active fire detection in near-real-time and is based on information from Meteosat-9, i.e. SEVIRI instrument.
The second part will present applications to the analysis of burnt scars and vegetation recovery, with case studies for the Iberian Peninsula. Operational product for tracking burnt areas LSA-SAF still doesn't have, but presentation gives perspective of rising such. Very simple model for post-fire vegetation recovery is presented and are shown correlations between post fire vegetation recovery dynamics and severity of fire damage.
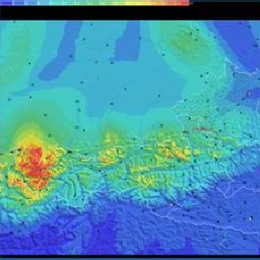
Presentation during the event week on Snow in January 2010.
Hannes Rieder from ZAMG, Austria who will provide a presentation on the interesting forecasting challenges associated with avalanches in Styria.
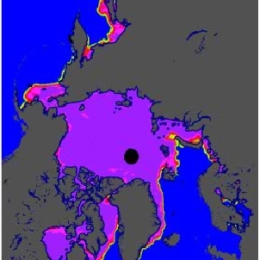
Presentation during the event week on Snow in January 2010.
Steinar Eastwood will present the operational Sea Ice products from the Ocean and Sea Ice Satellite Application Facility, both scientific and technical. Ongoing activities to improve the current products and develop new will be discussed and some examples of how the products are used will be shown.
Presentation during the event week on Snow in January 2010.
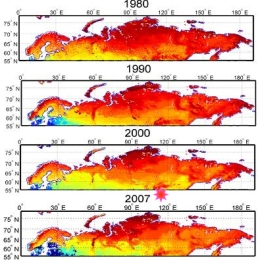
Jouni Pulliainen from FMI will present research results and snow products for climate research purposes.
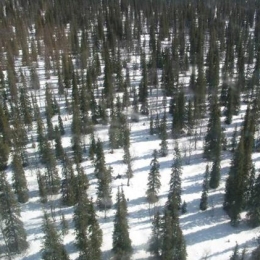
Another speaker from FMI, Panu Lahtinen, will give a short overview of the four snow products being developed in the Eumetsat Satellite application facility on water management and hydrology (H-SAF). The ongoing developments on these products are discussed, and the future goals are shown. Also, some validation results will be shown.
Presentation during the event week on Snow in January 2010.
Niilo Siljamo (FMI, Finland) will introduce the snow cover product (SC) based on MSG/SEVIRI. He will describe the main parts of the algorithm with attention to various cases of snow cover.
In the second part, Nuno Moreira (IM, Portugal) will talk about snow products derived from MSG during the unusual snow events that have occurred in Portugal between November 2008 and February 2009.
Presentation during the event week on Snow in January 2010.
Izolda Marcinoniene will present a case study. According to Lithuanian criteria for meteorological phenomena it was a local-scale catastrophic event that affected the city of Nida, located on Baltic coast. Based upon the physical parameters of the atmosphere and the satellite information obtained, the situation was typical for Comma cloud. The main features and reasons for development of this catastrophic heavy snow event will be presented using detailed information such as vertical cross-sections, tephigrams and various satellite images.
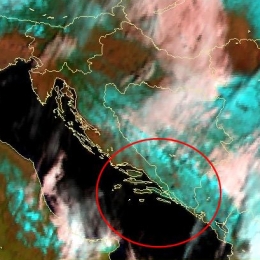
The second talk will be presented by Natasa Strelec Mahovic from the Croatian Meteorological Service (DHMZ). DHMZ will give a presentation on the forecast and analysis of heavy snowfall in Croatia in February 2009, when snow was recorded even on the remote islands in Southern Croatia!
Presentation during the event week on Warning in October 2010.
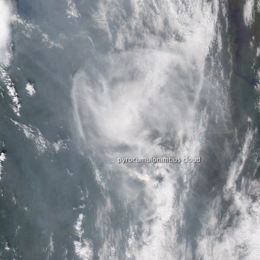
Presentation by Nuno Moreira (IM) and Andreas Wirth (ZAMG) on the exceptional summer of 2010 when a large scale crest was covering the two countries. As a result of the exceptional high temperatures and extreme low dew-point temperature the conditions were very dry. This resulted in a wide amount of forest fires. Within the high pressure and the lack of a governing flow the smoke caused many problems to Moscow.