
Identify surface features
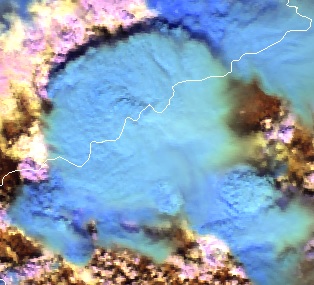
Roxane Desire shows the best RGBs for detection of typical winter weather phenomena: snow, ice and supercooled water clouds.
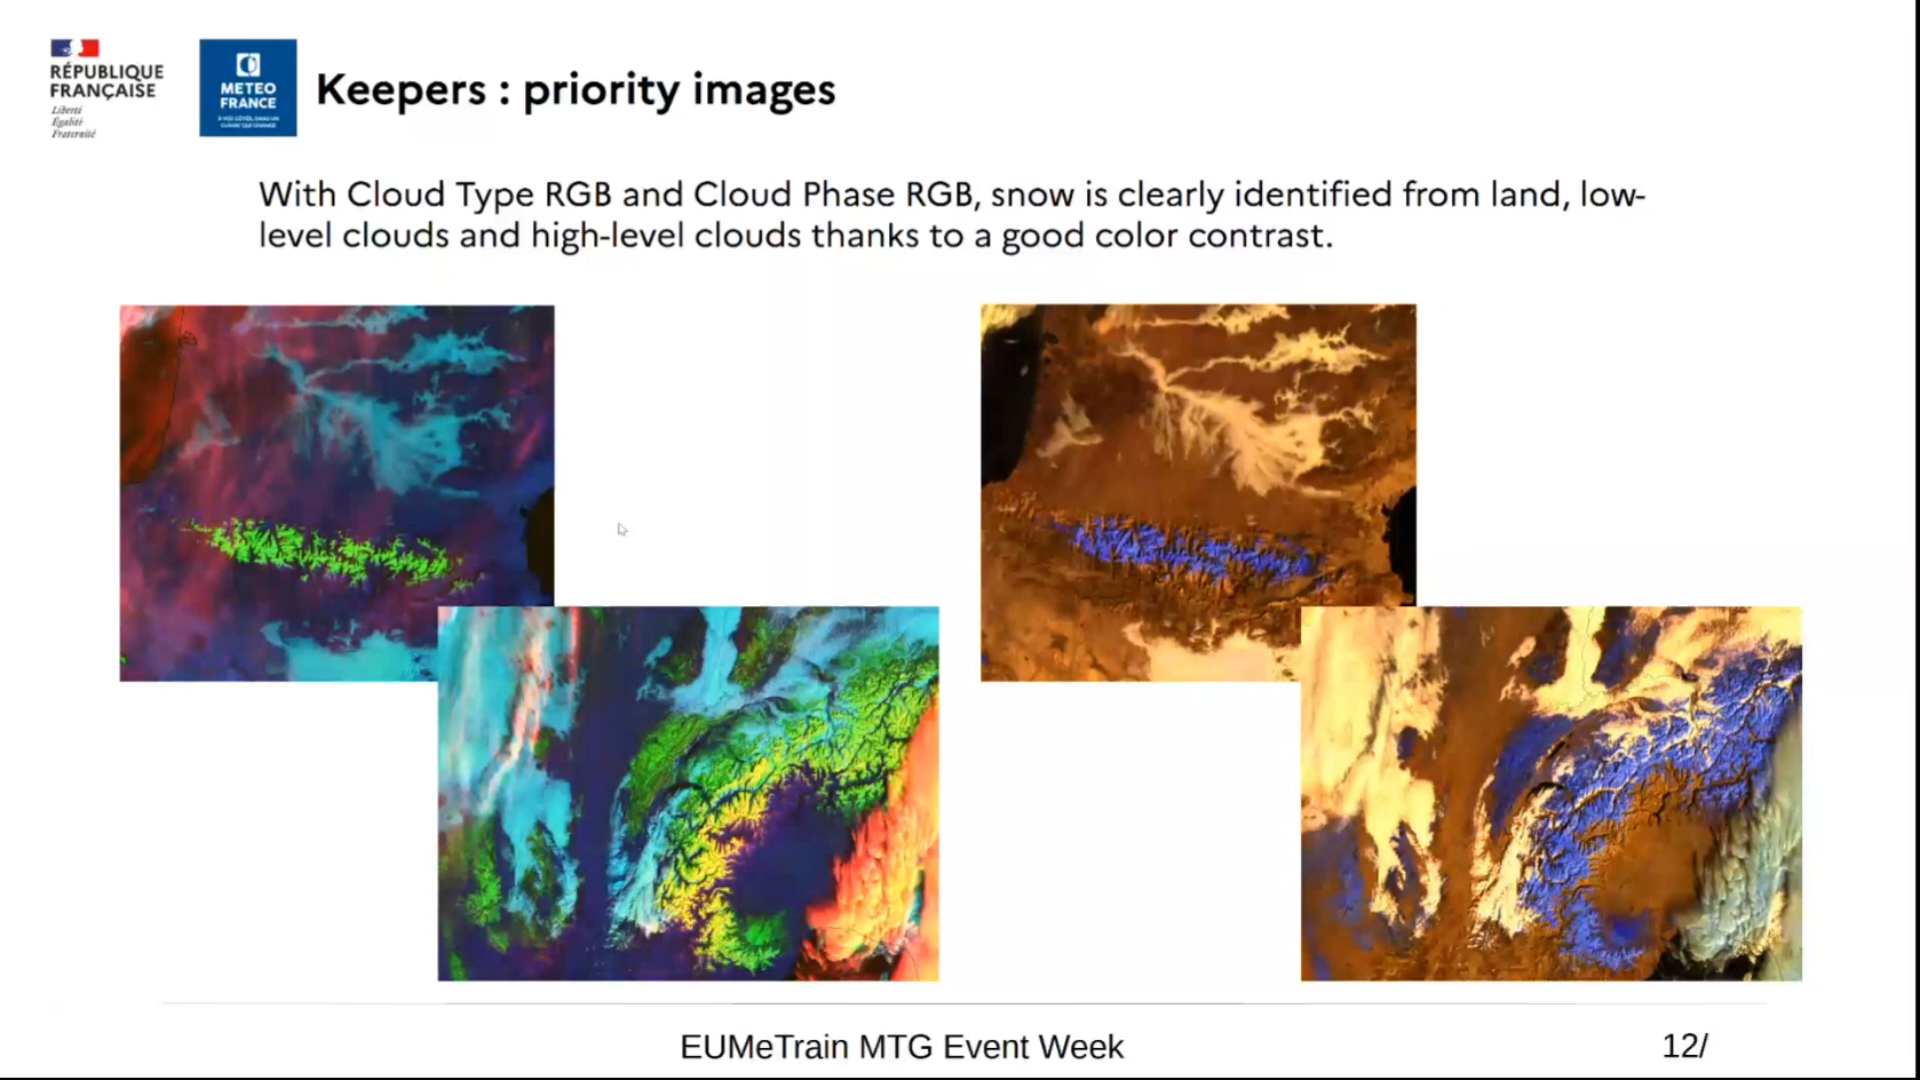
With the operational deployment of MTG, there are now various methods available for detecting snow on the ground. RGB products, in particular, provide high-contrast images that help distinguish snow on the ground from the underlying surface, low clouds, or ice clouds. We will also explore some important nuances to consider. Finally, still in the context of winter-related issues, we will discuss how these same RGB products can be used to detect supercooled water clouds, which can be responsible for ground ice formation or aircraft icing.
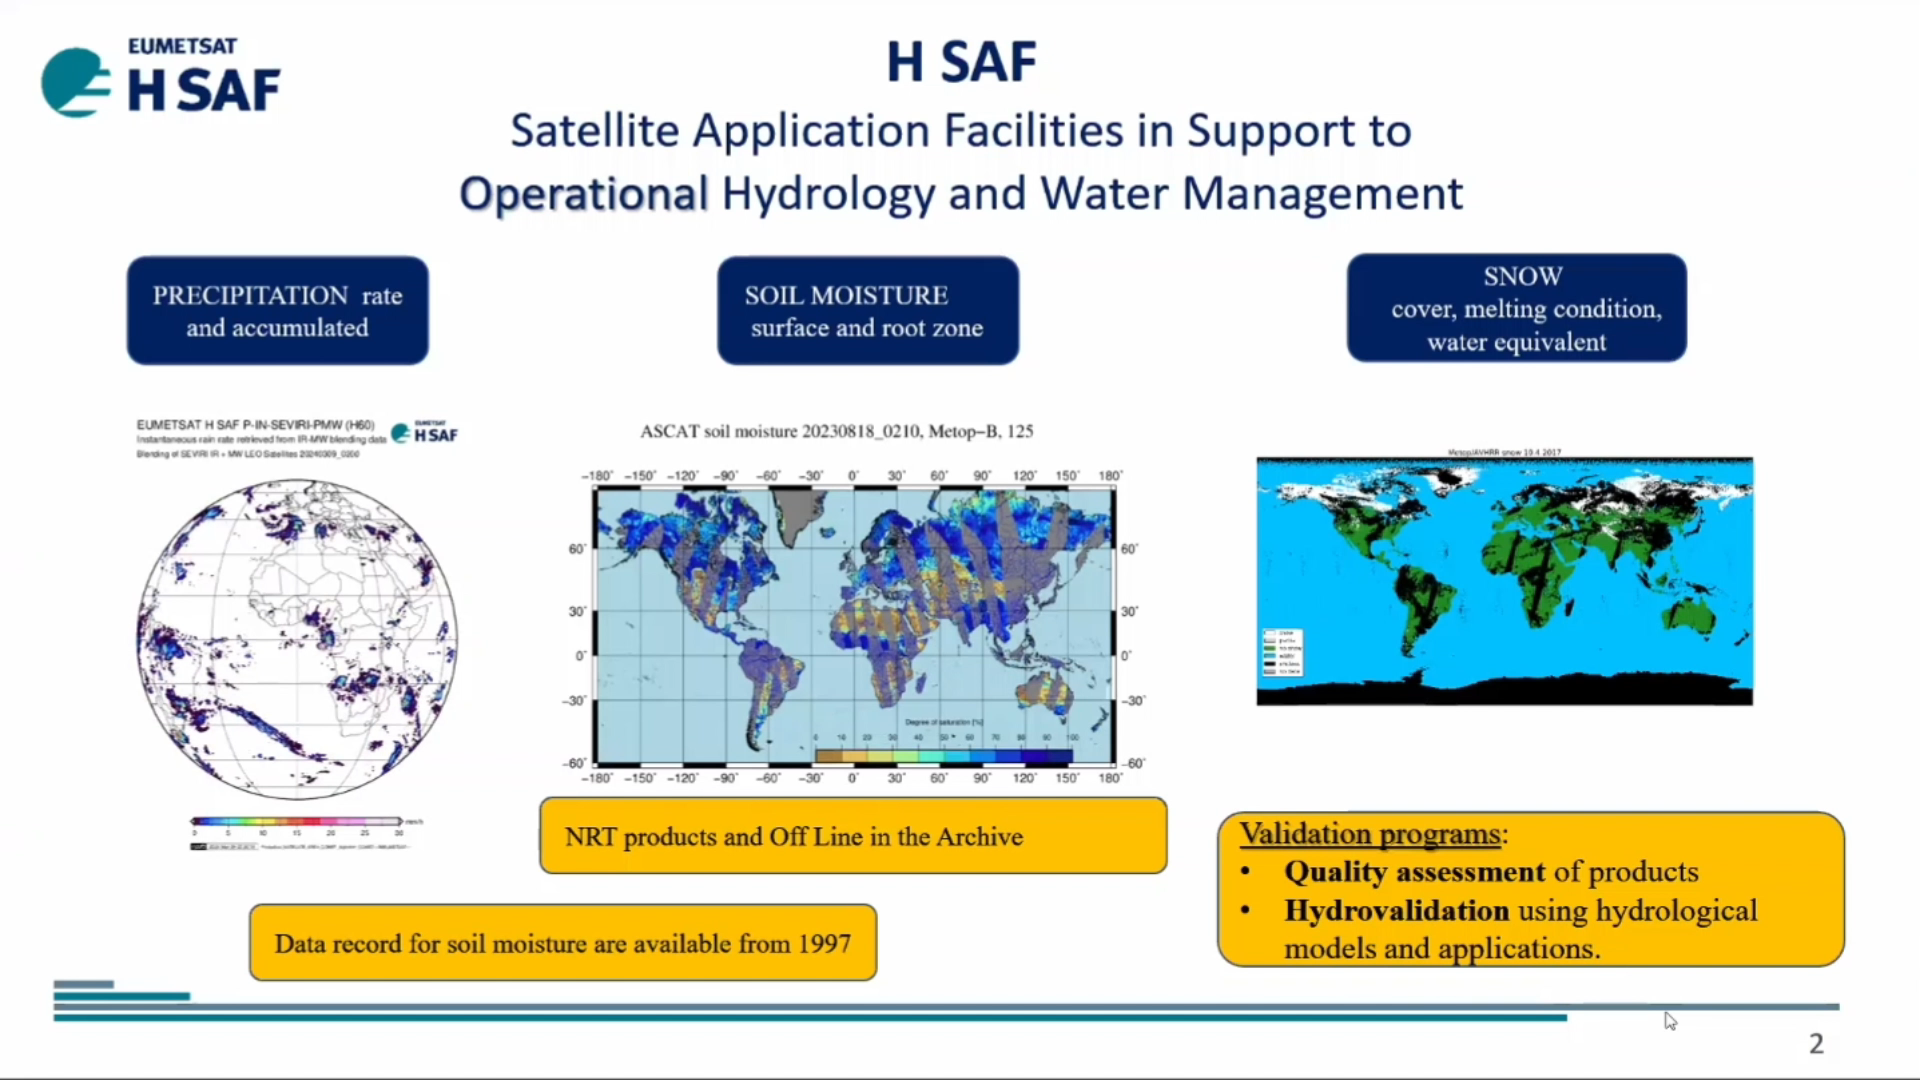
Roberto Nicoletta talks about the H SAF P-IN-FCI (H40) instantaneous precipitation and P-AC-FCI (H42) accumulated precipitation products while Semih Kuter discusses the H SAF H43 Snow Cover Product.
This talk introduces the new H SAF P-IN-FCI (H40) instantaneous precipitation and P-AC-FCI (H42) accumulated precipitation products. They are an evolution of the H60 and H61 MSG products, having a significant increment in resolution and time frequency. They are put into evidence via some examples in the European region. Some details are shown to put show the 3-times enhancements in computing performances. How to download the new products through the new website interface is also introduced. EUMETSAT H SAF H43 daily snow cover product provides 2 km resolution binary snow maps derived from MTG-FCI observations. We outline key technical features of H43, demonstrate how to access and download the product via the EUMETSAT Data Services, and present initial validation results from the 2024–2025 winter season using MODIS reference data. Case studies from the European Alps and the Russia/Kazakhstan region illustrate performance across diverse landscapes.
Isabel Trigo gives an overview on LSA SAF products and discusses future development.
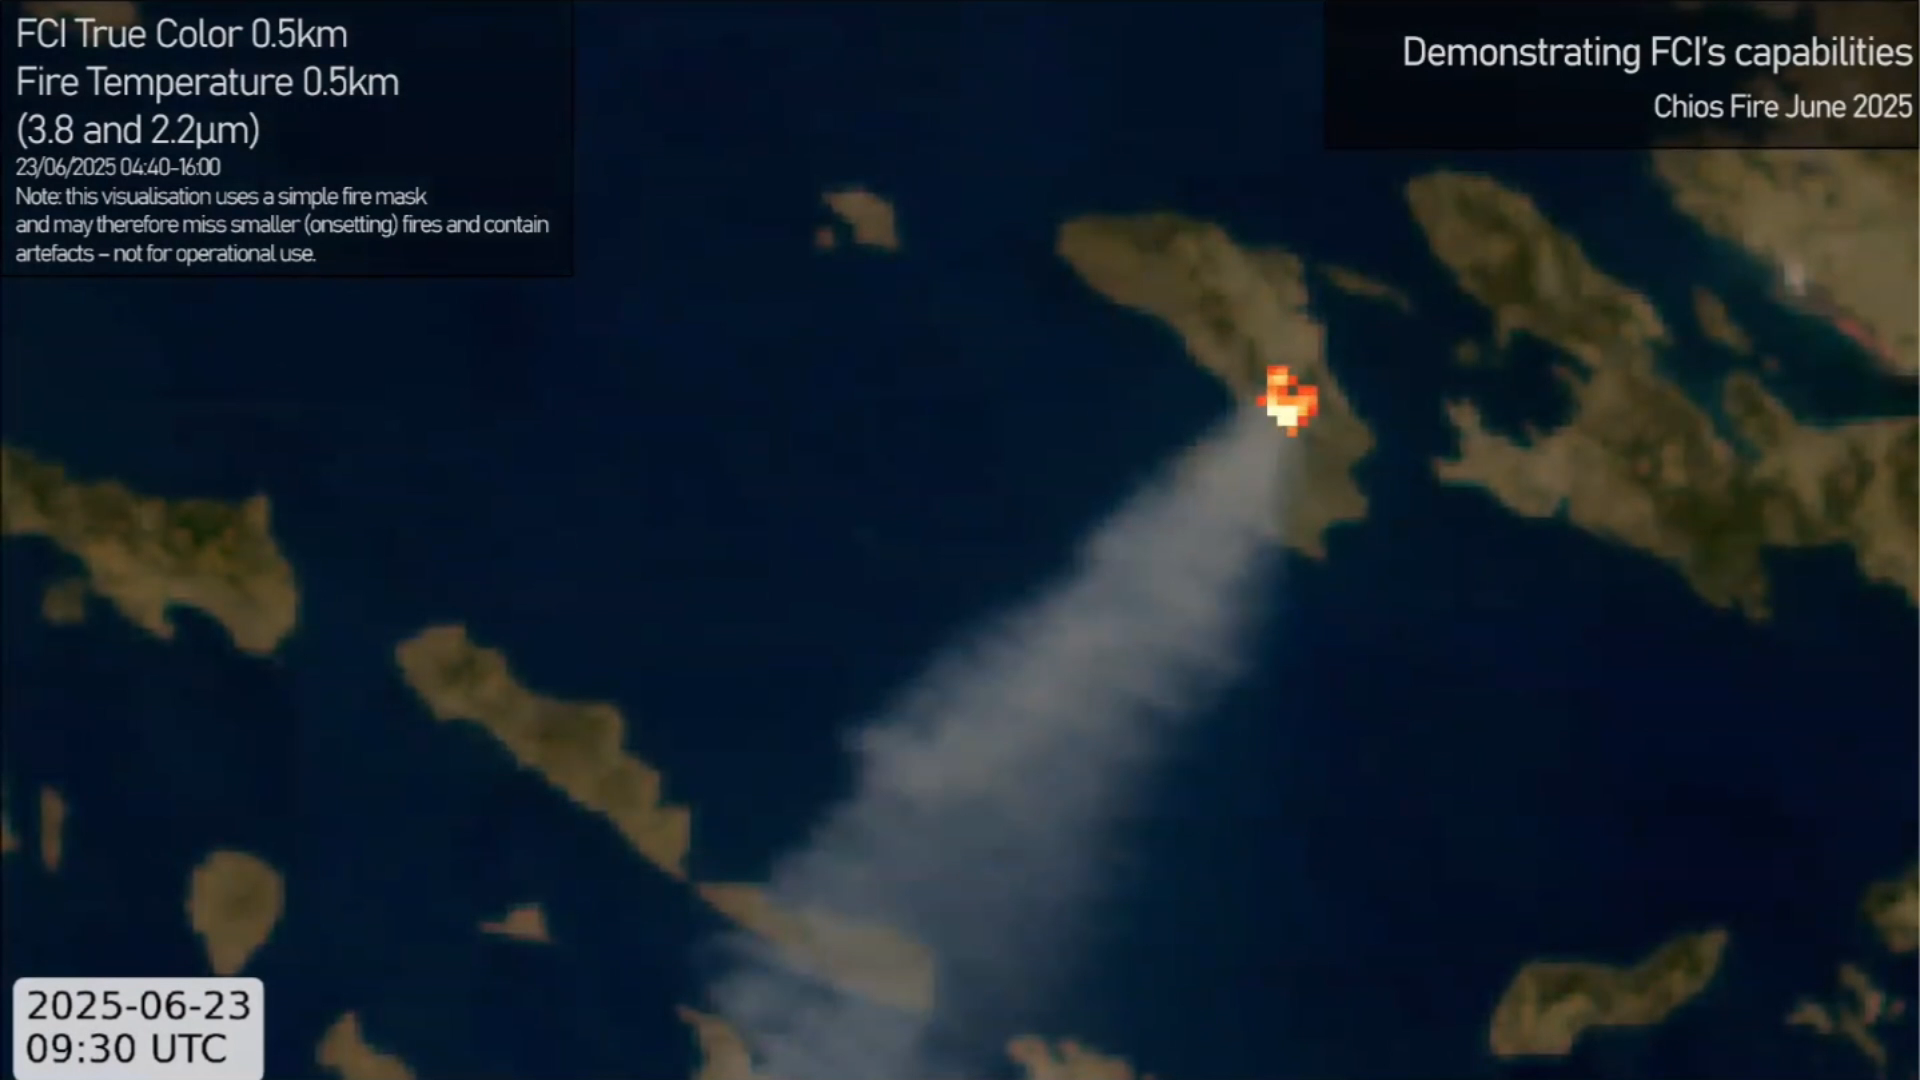
Andrea Meraner talks about the new channels on FCI instrument that bring new possibilities within the fire detection area.
The Flexible Combined Imager (FCI) instrument on-board the Meteosat Third Generation (MTG) satellite introduces unprecedented detection capabilities for wildfires from geostationary orbit. This presentation offers an overview of the instrument, focusing on characteristics relevant for identifying hotspots. We will then present case study analyses collected over the commissioning phase of the instrument, focusing on the Portugal September 2024 fires. We will explore visualisations utilising RGBs such as Fire Temperature and True Colour, leveraging the new FCI channels.
Vesa Nietosvaara gives an overview on the MTG programme and discusses FCI instrument and it's uses onboard the MTG-I1.
The complete constellation of Meteosat Third Generation (MTG) consists of three spacecraft: two imaging satellites and one sounding satellite. The first imaging satellite, MTG-I1 is now operational under the name Meteosat 12. The satellite carries two important instruments – Flexible Combined Imager (FCI), a successor of SEVIRI on MSG, and a Lightning Imager (LI), the first space-based instrument monitoring lightning occurrence over Europe, Africa and South America from geostationary orbit. In this talk, we will focus on the FCI and how it can help monitoring the weather and improving nowcasting. Forecasters will now be able to track the development of storms in near-real time with better accuracy, issue more precise and timely warnings about severe and dangerous weather events but also monitor fog development and dissipation, dust outbreaks, forest fires and many other features.

This guide is about the Cloud Type RGB, a new product for European users of GEO satellite data, which can be constructed using data from the Flexible Combined Imager (FCI) on the Meteosat Third Generation (MTG) satellite system. It uses one of the new FCI channels.
At the time the guide was created, FCI was not yet operational, so the characteristics of the FCI Cloud Type RGB were tested using preliminary commissioning data. Similar features were found as with the proxy data. Some examples created from the FCI preliminary commissioning data are presented in this guide.
The main application areas of the Cloud Type RGB are detection of very thin cirrus and higher-level aerosol clouds, and visual differentiation of cloud types, with some limitations. It can also provide some information about areas with dry airmasses.
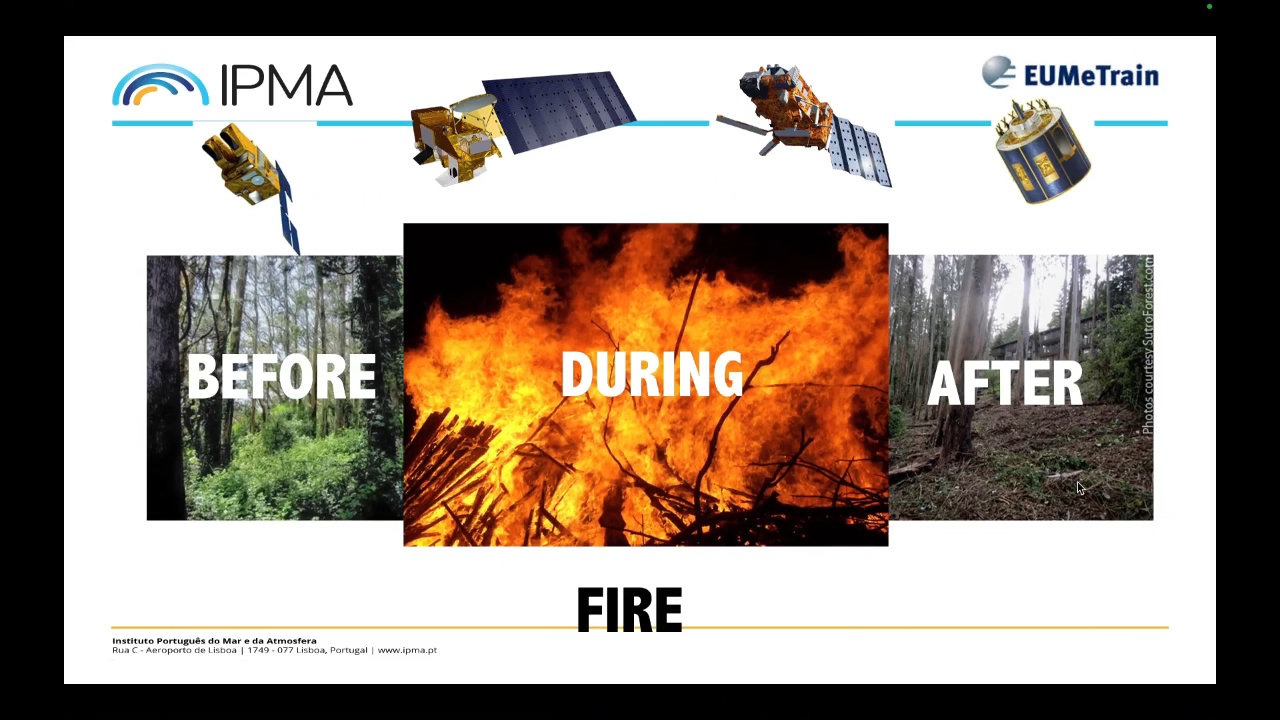
Celia Gouveia shows the importance of monitoring the fire risk for preventive measures, as well as impact assessment.
LSA-SAF generates a large set of products for land surface characterization derived from SEVIRI on board Meteosat Second Generation (MSG). The availability of such datasets in Near Real Time (NRT) allows a continuous monitoring of the situation before, during and after wildfire. The monitoring of the situation during the fire season relies on the fire risk mask (FRM) disseminated daily and with 5 days in advance. The severity of the occurred events is assessed by means of Fire Radiative Power. Post fire conditions over burned areas and the assessment of the impact of fire events on vegetation regeneration is assessed by means vegetation products.
Lecture slides

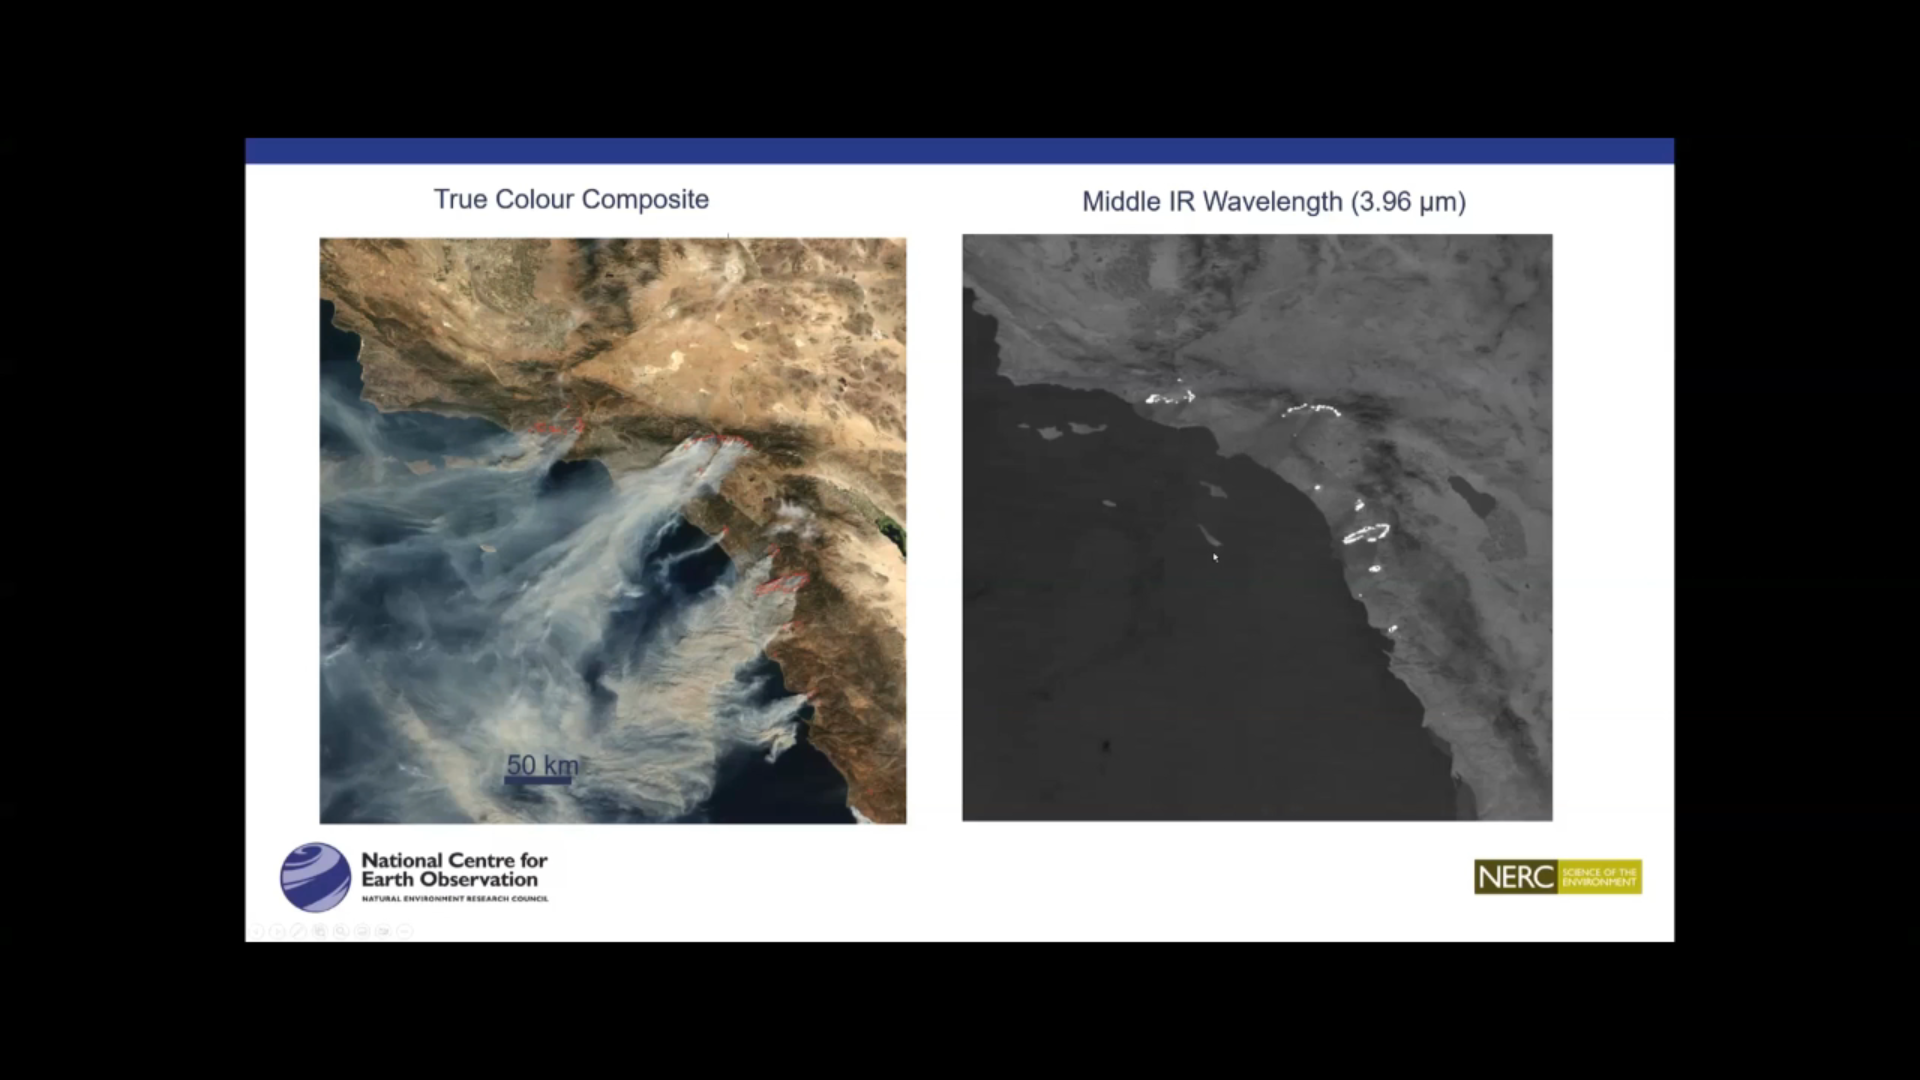
Martin Wooster talks about fire detection and FRP (Fire Radiative Power) product.
Martin Wooster talks about fire detection and FRP (Fire Radiative Power) product.
Lecture slides
Andrea Meraner talks about wildfire detection and vizualisation by using FCI data.
The Flexible Combined Imager (FCI) instrument on-board the Meteosat Third Generation (MTG) satellite introduces unprecedented detection capabilities for wildfires from geostationary orbit. This presentation offers an overview of the instrument, focusing on characteristics relevant for identifying hotspots. We will then present the first case studies of wildfire and smoke observations across Europe and Africa. These examples are based on preliminary commissioning data collected during the extreme events of Summer 2023. We will explore visualisations utilising RGBs such as Fire Temperature and True Colour, leveraging the new FCI channels.
Lecture slides
Johan Strandgren talks about the FCI True Colour Imagery.
The Flexible Combined Imager (FCI) on-board MTG-i1 introduces a unique capability: generating geostationary true colour imagery over Europe and Africa. This is typically achieved by combining data from three channels centred at red, green and blue wavelengths. However, FCI's green channel (0.51 microns) partially misses the spectral reflectance peak of chlorophyll around 0.55 microns, leading to inaccurate depiction of vegetation and barren surfaces. To address this limitation, a novel green band correction technique using the normalized difference vegetation index has been developed and utilized for the first release of true colour images from FCI. The new FCI true colour composite is also the corner stone for the ongoing development of the FCI GeoColor RGB composite. This composite incorporates the elements from the ABI GeoColor composite, by blending true colour imagery with night-time infrared imagery and city lights, as well as other relevant features such as wildfires and LI lightning events.
Lecture slides
Cloud Phase RGB is a new product for European users of GEO satellite data, which can be constructed using data from the Flexible Combined Imager (FCI) on the Meteosat Third Generation (MTG) satellite system. The aim of this RGB is to provide improved microphysical information on cloud tops, in particular discrimination between thick water clouds and thick ice clouds, and cloud top particle size.
This extended guide is about the Cloud Phase RGB, a new product for European users of GEO satellite data, which can be constructed using data from the Flexible Combined Imager (FCI) on the Meteosat Third Generation (MTG) satellite system. It uses one of the new FCI channels, not available with the SEVIRI instrument. This document is an extended guide discussing its characteristics in detail; a quick guide is also available on the EUMeTrain webpage. In this guide, the imagers of Japanese and American geostationary satellites (Himawari/AHI and GOES/ABI) and polar satellites (NPP and NOAA-20/VIIRS) are used to provide proxy data for the FCI.
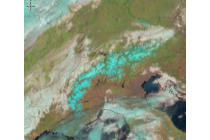
Learn how to detect areas covered with snow, ice or cloudy areas.
In this module you will be able to identify geographical features and surface characteristics and conditions through images and satellite products. Although surface features are not the main purpose of meteorological forecasting, being able to identify and distinguish them from atmospheric features can be useful.
To access the resource click here.