
Satellite skills and knowledge for operational meteorologist
Listed here are other resources related to Satellite skills and knowledge for operational meteorologist tag:
Note: click on an image to open the Resource
Alexander Jann and Andreas Wirth present the new aviation products of ASII-NG (Next Generation).
Length: 30 min
Author: Alexander Jann, Andreas Wirth (ZAMG)
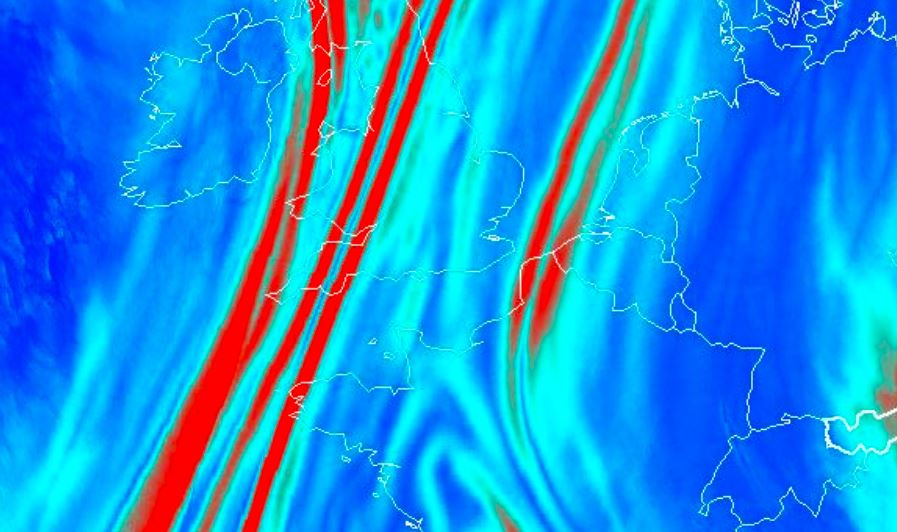
Two new satellite-derived products related to turbulence analysis have been developed recently in the frame of the Nowcasting-SAF. The first product (ASII-GW”Automatic Satellite Image Interpretation – Gravity Waves”) objectively detects grating patterns in the water vapor 7.3 imagery which point to the presence of gravity waves. The second product (ASII-TF “Automatic Satellite Image Interpretation – Tropopause Folding”) identifies the location of tropopause folds from satellite and NWP data. The algorithm is based on the logistic regression method.
In this presentation, we will talk about the selected algorithms and present cases from the official Nowcasting-SAF validation reports (to be released shortly) to illustrate the product performance.
Peter Schmitt analyses the different aspects of CAT and presents a CAT forecasting method.
Length: 40 min
Author: Peter Schmitt (DWD)
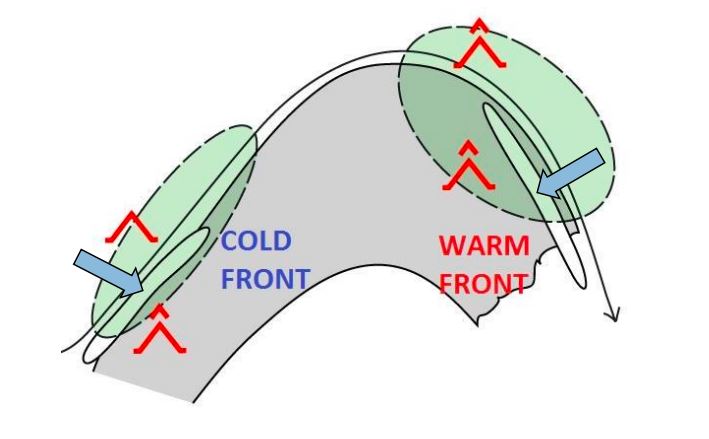
Clear air turbulence (CAT) is the term for medium- or high-level turbulence in regions with significant wind shear. CAT is an important factor for the aviation safety.
In the first part of the presentation, I will show you typical parts of CAT in relation with the 300 hPa geopotential analysis. Furthermore you get an overview to the correlation between CAT and characteristic cloud patterns in satellite images. In many cases satellite images provide the first clue or a confirmation for the presence auf CAT.
The second part is dedicated the forecast of CAT in Deutscher Wetterdienst (DWD) with the ICON model. DWD has been applying a forecast method based on Eddy Dissipation Rate (EDR). This real property of atmospheric turbulence is the main sink term of Turbulent Kinetic Energy. In a case study you will see the typical working process in practice with consideration of the model output, typical cloud pattern in satellite image and the use of the conceptual model and the structure of geopotential field.
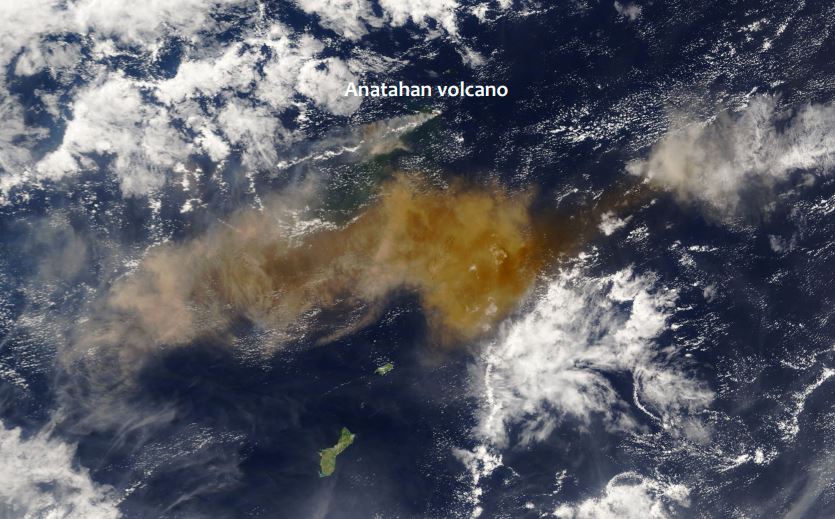
Fred Prata presents a series of volcanic eruption and analyses them from the satellite perspective.
Length: 65 min
Author: Fred Prata (AIRES Pty Ltd)
Since the late 1970's earth-orbiting satellites have been able to observe the weather around the globe and provide quantitative information on cloud movements. These data have proved extremely valuable for tracking volcanic ash clouds and more recently allowing quantitative information on volcanic ash column amounts and also on SO2 gas - another potential hazard to aviation. Notable incidents between commercial aviation and ash clouds, several in Indonesia and Alaska, have occurred during the satellite era (~1960's onwards). The talk will cover methods used to identify, quantify and monitor volcanic ash clouds and frame this in the context of the potential hazard.
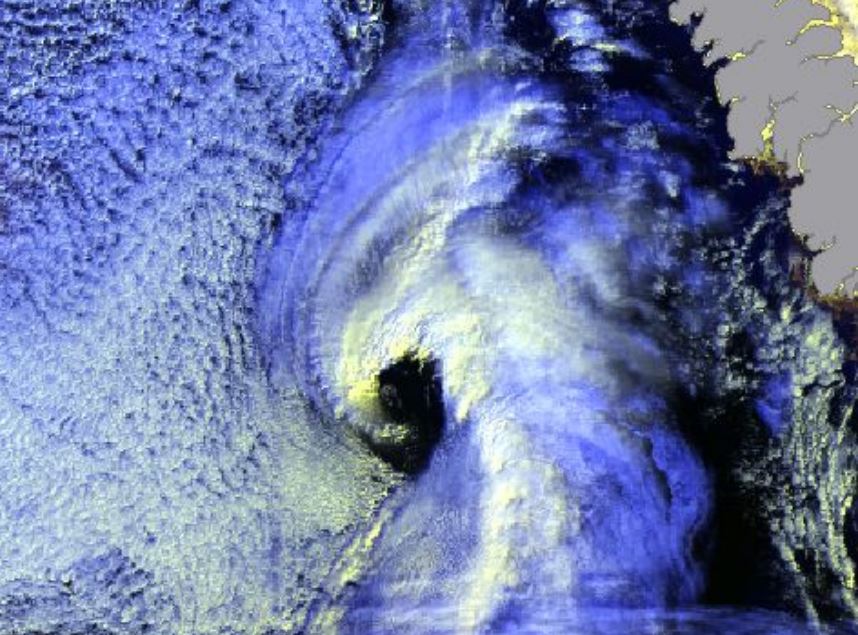
Gunnar Noer presents facts on Polar Lows, how they are forecasted, and gives examples of interpretation of satellite imagery.
Length: 55 min
Author: Gunnar Noer (MetNo)
Polar Lows can be seen as small Arctic hurricanes, and they have a severe impact on shipping and coastal communities in Scandinavia. They are most common in the Barents Sea and the Norwegian Sea, but are also known to occur in the central North Sea and surrounding coastal areas. Polar lows are the most intense type of wintery convection weather phenomenon in this area. Thus, a familiarity with Polar Lows will also increase our ability to forecast the more common snow shower events in the winter season. This talk will present some facts on Polar Lows, how they are forecasted, and give examples of interpretation of satellite imagery.
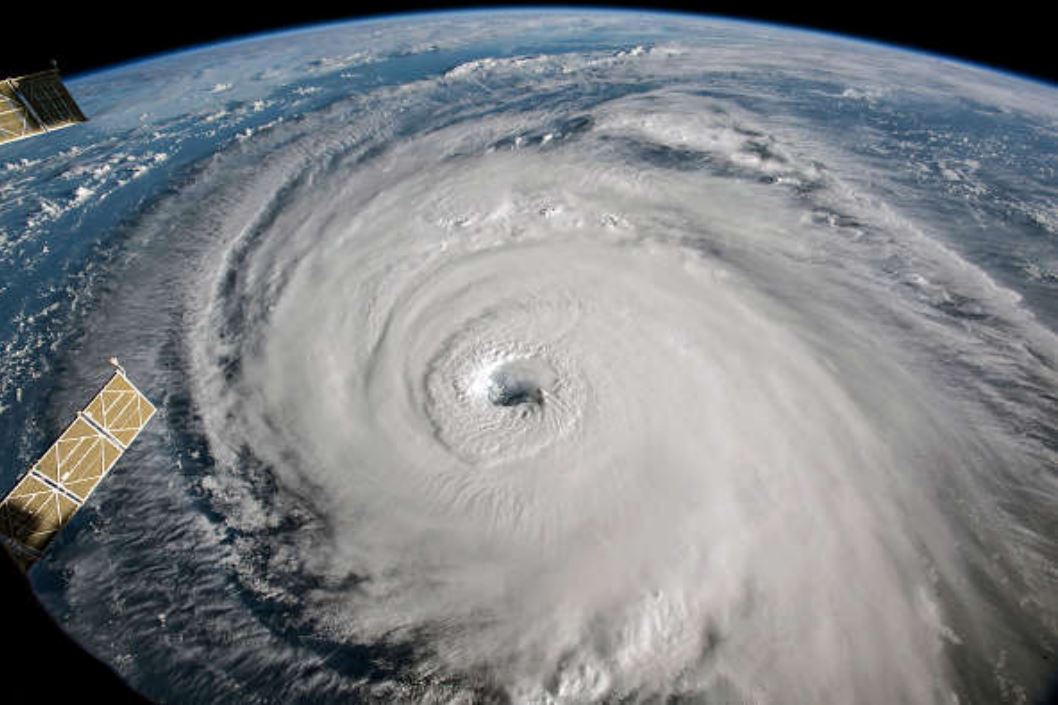
Carlos Ramalho presents some tropical and extra-tropical cyclones that affected the Azores and the challenges forecasters face in this situations.
Length: 30 min
Author: Carlos Ramalho (IPMA)
Due to the Azores geographical location, this archipelago is occasionally affected by strong Extratropical cyclones and Tropical cyclones. Extratropical cyclones are more frequent in winter and are often associated with strong winds, heavy precipitation and heavy waves which can be damaging and contribute to social and economic distress. Tropical cyclones, on the other hand occur mostly in September and October and in the past have caused loss of lives and property damage. Forecasting this type of systems is very challenging, mostly because a small variation in path can cause large difference in the impacts. This talk presents some tropical and extratropical cyclones that affected the Azores and also the challenges that forecasters face in this situations.
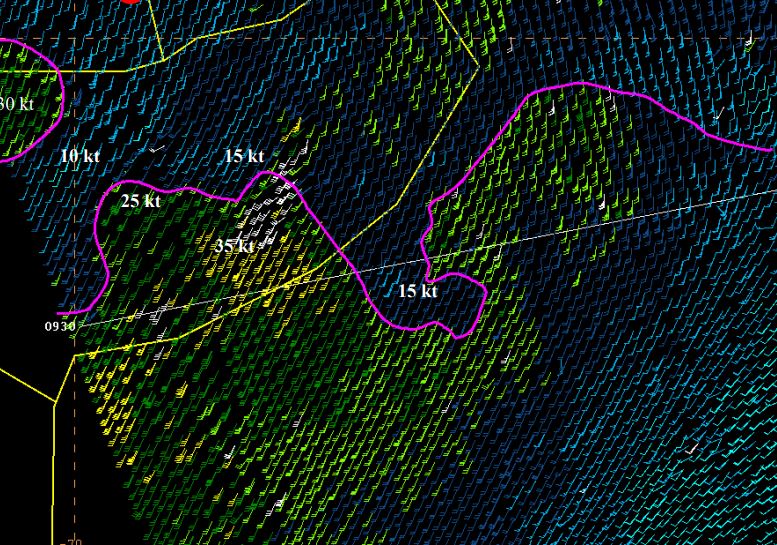
Joseph Sienkiewicz discusses forecasting challenges for large ocean areas along with the application of satellite winds and waves.
Length: 60 min
Author: Joseph Sienkiewicz (NOAA)
The NOAA Ocean Prediction Center (OPC) is responsible for weather warnings and forecasts for the western North Atlantic and eastern and central North Pacific Oceans. The oceans remain relatively data sparse for observed conditions. To compensate, OPC has successfully used winds from scatterometers and wave heights from altimeters to better understand and predict hazardous conditions over the waters of responsibility. Weather forecasting challenges for large ocean areas will be discussed along with the application of satellite winds and waves.
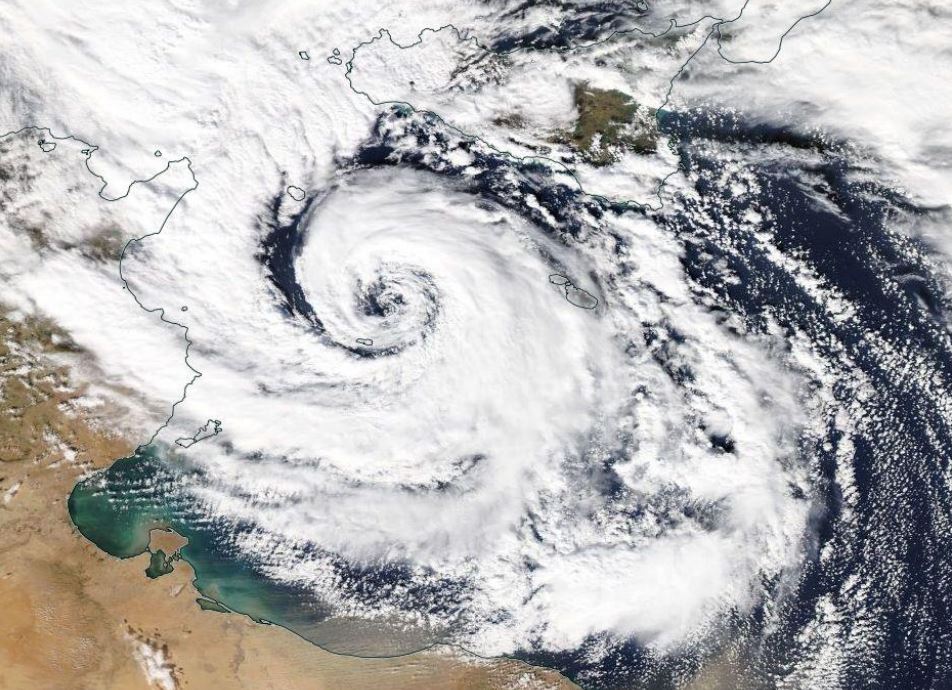
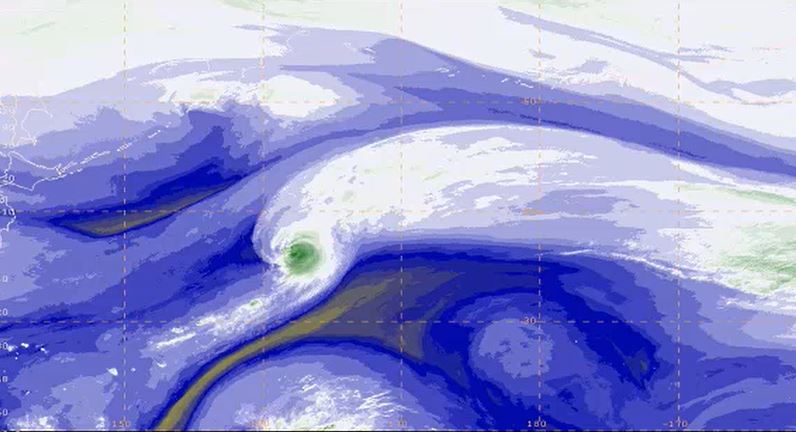
Ioannis Pytharoulis shows past cases of Medicanes, the description of their structure and characteristics.
Length: 50 min
Author: Ioannis Pytharoulis (Aristotle University of Thessaloniki)
The Mediterranean tropical-like cyclones are intense sub-synoptic maritime lows with strong winds, axisymmetric warm-core structure and tropical cyclone features, such as a cloud-free eye and spiral deep convection. They are frequently referred to as medicanes (MEDIterranean hurriCANES) due to their resemblance to tropical cyclones. Despite their low frequency (of about 1.1-1.6 systems per year), medicanes constitute a serious natural hazard to life, property and the environment of the coastal regions of the Mediterranean basin and the Black Sea. Their accurate prediction is a challenge for the numerical weather prediction models. This presentation includes some past cases of medicanes, the description of their structure and characteristics, criteria that are used to define them, the development mechanisms, climatology, consequences and finally a detailed case study of medicane Qendresa (November 2014).
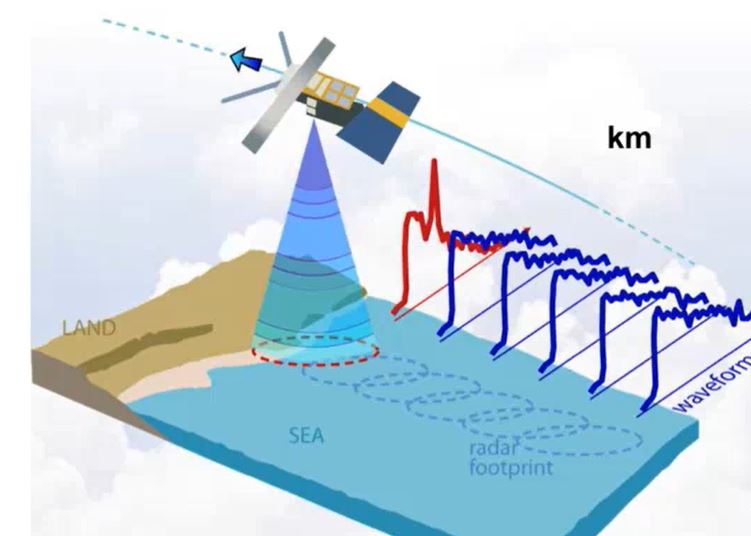
Zorana Jelenak describes how altimeters work, how data is used for everyday marine forecasting at NOAA and assimilation.
Length: 60 min
Author: Zorana Jelenak (NOAA)
Altimeter data have been used to produce maps of sea surface height, geostrophic velocity, significant wave height and wind speed. This information is of proven use to mariners as well as to the scientific community. Uses of the data include commercial and recreational vessel routing, ocean acoustics, input to geographic information systems developed for the fishing industry, identification of marine mammal habitats, fisheries management and monitoring ocean debris. Such information is accessible in near-real time (within 3 to 48 hours) and to improve weather forecasting models by assimilation. 25 years of data makes it possible to study the whole ocean or regional areas for offshore industries or navigation. In hurricane studies altimetry measures very high waves and strong winds, but also helps identify sea surface height anomalies which can be used as proxies of the warm currents - hurricanes energy source. The lecture will describe how altimeters work, how data is used for everyday marine forecasting at NOAA and assimilation, devoteting special attention to data accuracy and limitations.
Michael Folmer presents examples of relevant applications of Sentinel-3A data.
Length: 55 min
Author: Michael Folmer (NOAA)
The EUMETSAT-operated Copernicus Sentinel-3A satellite has been providing near-real time data to the marine community since mid-2016, and will be soon be joined in operations by its sister, Sentinel-3B. This presentation will give an overview of the available Sentinel-3 marine products, with a primary focus on data streams associated by the altimeter (SRAL) and sea surface temperature radiometer (SLSTR). Examples of the relevant applications will be presented, along with a discussion of how users can best access data and monitor its quality.
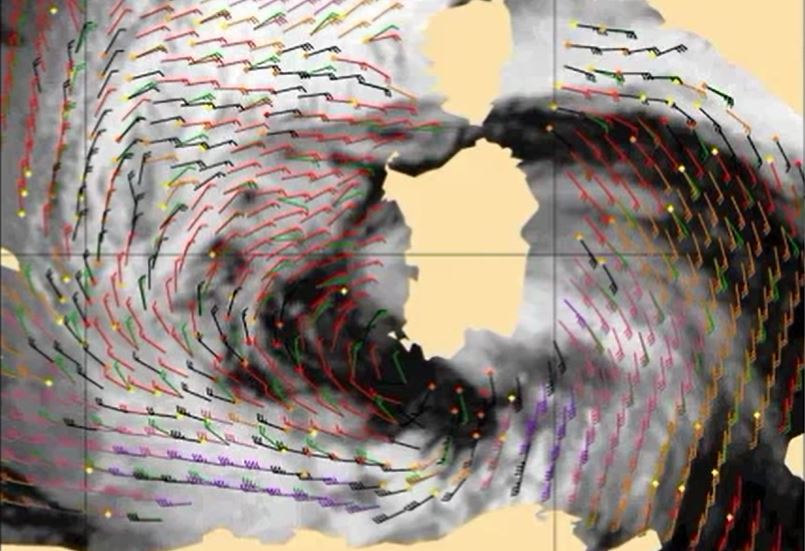
Ad Stoffelen focuses on scatterometer winds, how good they are and what aspects need attention.
Length: 60 min
Author: Ad Stoffelen (KNMI)
Winds over sea are essential for marine forecasting and used in nowcasting and numerical weather prediction (NWP) to aid in off-shore activities (energy sector, transport, fisheries and recreation), particularly to secure safety of life and property. Winds over sea are observed by satellites and available from NWP model forecasts. Most satellite winds over sea are provided by scatterometers; they provide swath fields of both wind speed and wind direction from polar satellites. Currently, winds from EUMETSAT’s MetOp-A, MetOpB and the Indian ScatSat-1 are operationally available and provide good coverage around 9:00 and 21:00 local solar time (LST). Very soon they will be complemented by a few more. The lecture focuses on what scatterometer winds really represent, how good they are and what aspects need attention when applying these winds in your routine operations alongside with NWP model winds.
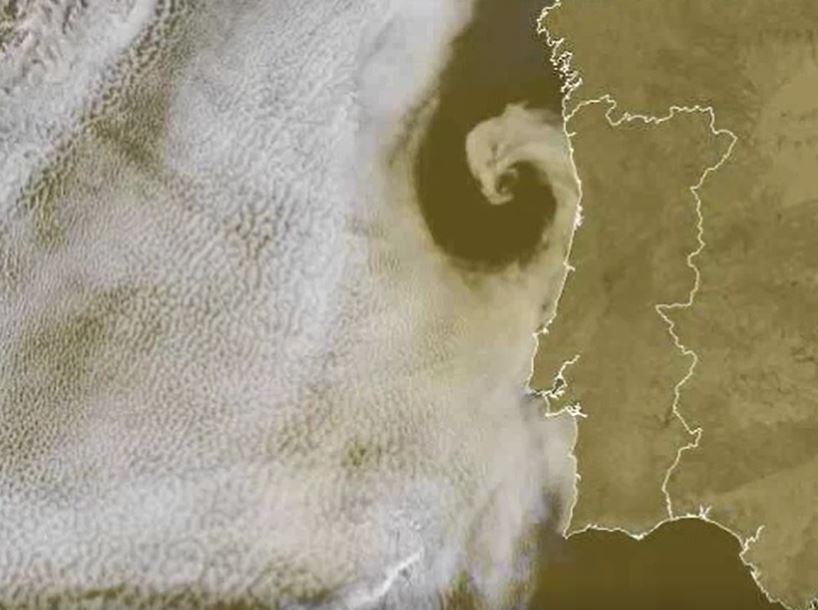
Hans Peter Roesli discusses various satellite pattern observed over the seas.
Length: 40 min
Author: Hans Peter Roesli, Switzerland
Sea and coastal areas have radiative characteristics that enhance the identification of non-meteorological features like smoke, ash or dust. Maritime inversions and atmospheric interchanges along coastal areas engender particular cloud patterns like Bénard cells, Kármán vortex streets, undular bores, ship trails, (extra) tropical cyclones or sea breeze fronts. Examples of such features will be shown and discussed, using imagery from geostationary and polar weather satellites.
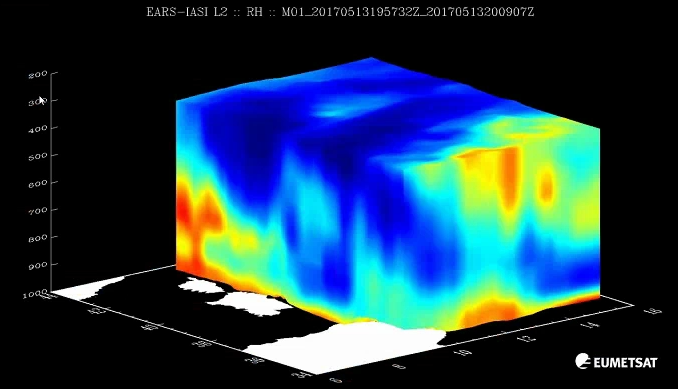
Thomas August gives an introduction to EUMETSATs current (IASI) and future (IASI-NG and MTG-S) hyperspectral sounders.
Length: 46 minutes.
Assessing and monitoring atmospheric thermodynamic parameters is key for weather forecasting. Space-borne hyperspectral sounders provide vertically resolved information of atmospheric temperature and humidity, and of surface and cloud properties. The future geostationary infrared sounder IRS on board Meteosat Third Generation (MTG) will deliver operational atmospheric sounding at unprecedented temporal and spatial sampling, with 4-km pixels at Nadir and covering Europe every 30 minutes. It will hence be an important complement to satellite imagery (e.g. operational MSG/SEVIRI or the future MTG/FCI instruments), where long experience exist in support to nowcasting, by allowing the detection and monitoring of atmospheric instabilities before convective clouds develop.
In this presentation, we give an introduction to EUMETSAT current (IASI) and future (IASI-NG and MTG-IRS) hyperspectral sounders, the remote-sensing principles and geophysical information contained in the so-called Level 2 (L2) products. This includes temperature and humidity profiles, cloud and surface properties and indirect parameters relating to the atmospheric stability. We give an overview of recent application studies and experiments using IASI L2 products in support to weather forecasting.