
Satellite skills and knowledge for operational meteorologist
Listed here are other resources related to Satellite skills and knowledge for operational meteorologist tag:
Note: click on an image to open the Resource
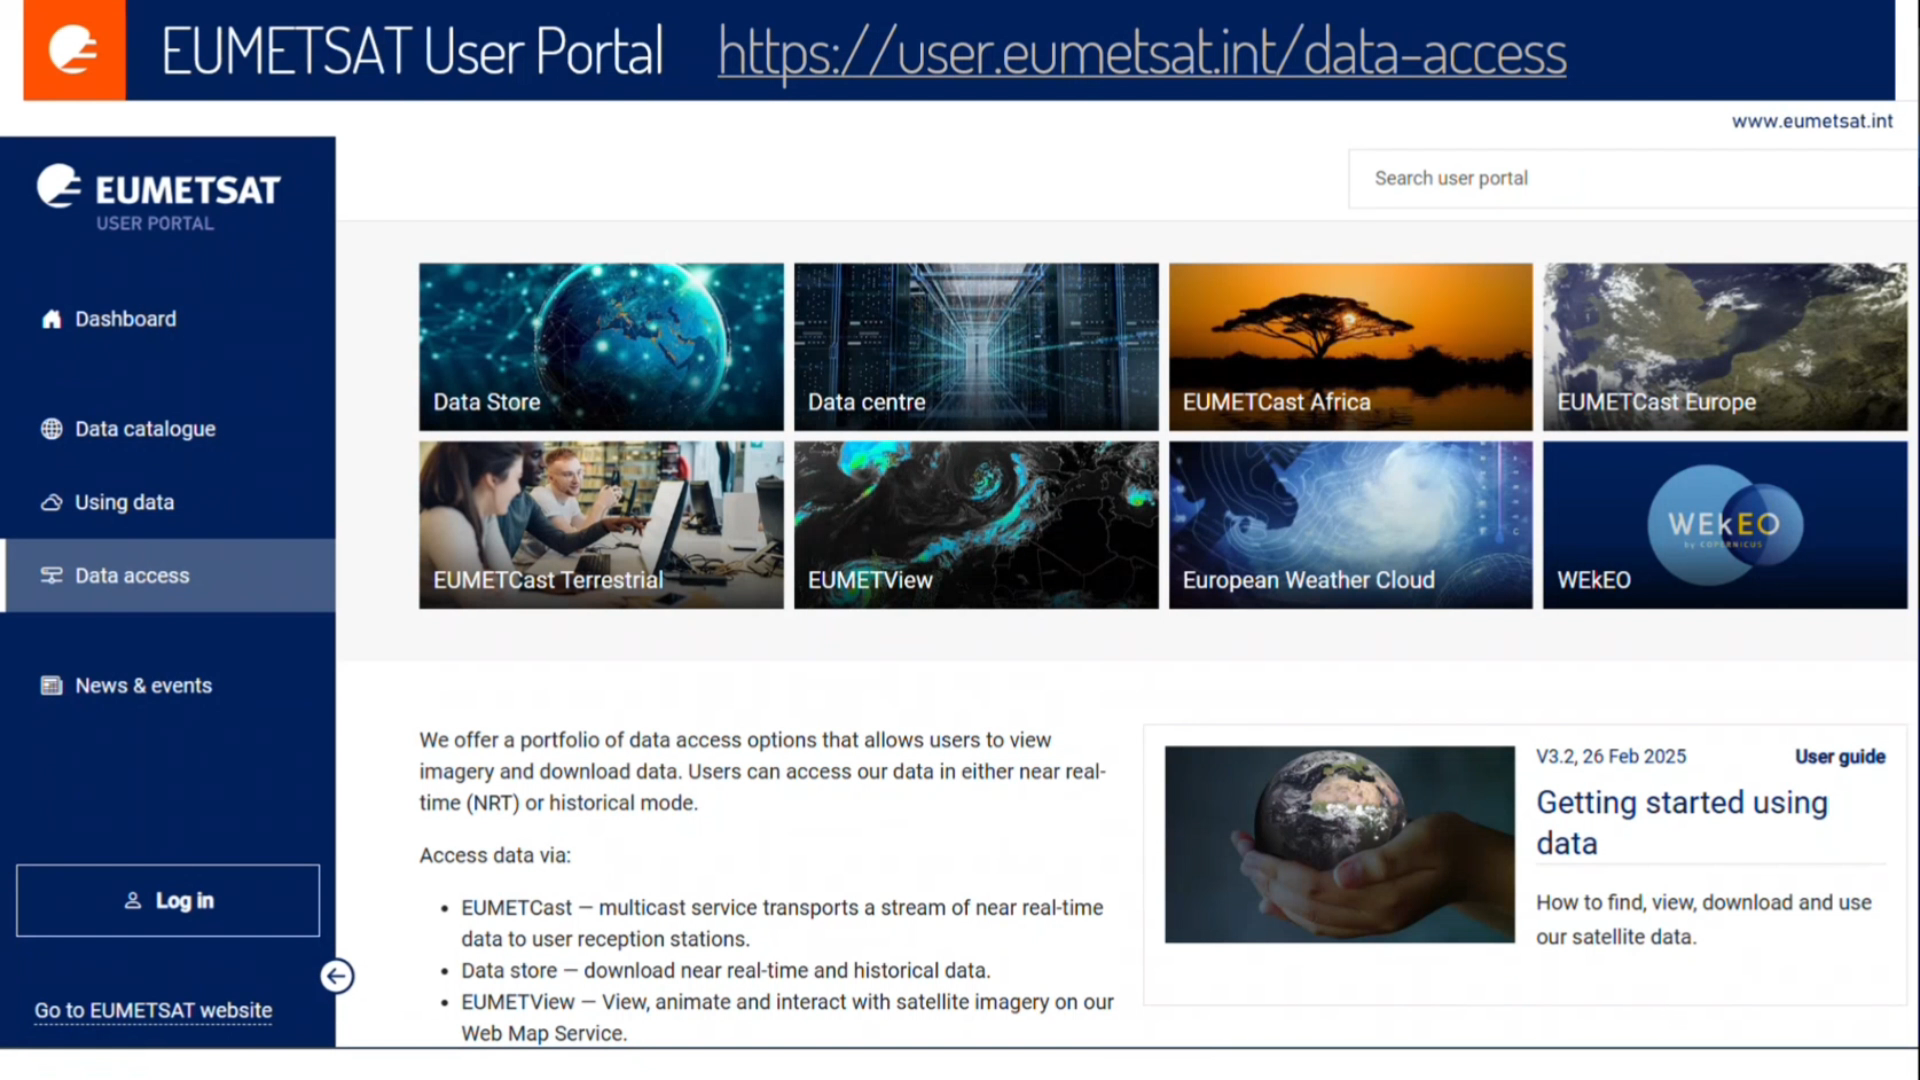
Natasa Strelec Mahovic shows a variety of data access option to view the MTG data including FCI, LI and SAF products.
EUMETSAT provides access to meteorological satellite data through a suite of platforms designed to support operational forecasting, research and developments and climate monitoring. Users can receive near real-time data from all of the EUMETSAT’s satellite missions via the EUMETCast Europe, EUMETCast Africa and EUMETCast Terrestrial broadcast systems, use EUMETSAT Data Store to download near real-time and historical data via a web user interface (Web-UI) and/or Application Programming Interface (API), and the data not found in the Data Store, users can download from the EUMETSAT Data Centre (long-term archive) using the data centre ordering client. Visualization tools, ie the EUMETView online map viewer and ADAGUC for NWCSAF products visualization, enable exploration of multispectral imagery and derived products. The presentation will give an overview of EUMETSAT data access and visualization tools.
Go to lecture slides
Stefan Stapelberg introduces Level 2 products from EUMETSAT's IRS intstrument.
The Infrared Sounder (IRS) aboard Europe’s new meteorological satellite offers highresolution, frequent atmospheric observations to enhance weather forecasting. Using EUMETSAT’s piecewise linear regression method, it retrieves detailed temperature, humidity, and ozone profiles with uncertainty estimates. These data, combined with cloud information and Instability indices, are expected to improve the performance of numerical weather prediction (NWP) models, particularly in the context of severe storm forecasting.
Go to lecture slides
Stephan Bojinski introduces the MTG-S and the instruments onboard.
An overview of Meteosat Third Generation (MTG) and the InfraRed Sounding mission is provided. The MTG-S satellite was launched on 1 July 2025 with an InfraRed Sounder (IRS) on board, passively measuring upwelling radiance in 1953 channels from geostationary orbit, every 30 min over Europe, and less frequently over other areas of the Earth disc. Valuable retrievals of humidity and temperature are expected with vertical resolution of 1-2km and spatial resolution of ~6-7km over Europe, complementing model-derived fields or radiosonde profiles. IRS is also sensitive to atmospheric trace gases such as NH3, SO2 and CO. Since this capability is a first-ever for EUMETSAT and its users, significant user training is required to visualise and interpret the data directly, e.g., in nowcasting applications. Strong impact on improving weather forecasting skill is expected by assimilating IRS radiances in NWP models, similar to data from its IASI sister missions in polar orbit. EUMETSAT informs its member states regularly informed about the status of IRS testing and release of early data via its MTG User Preparation user group and the Core NWP user group.
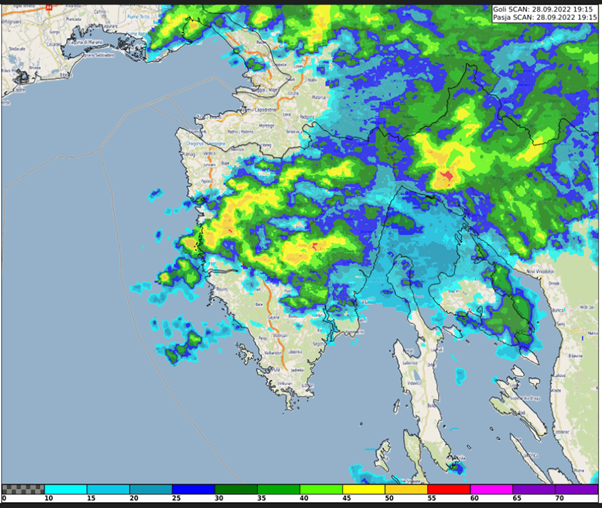
Case study about the extreme precipitation event in Rijeka, Croatia on 28 September 2022. The study focuses on the special case of convective development that caused the severe event.
This study accompanies the simulator.
Xavier Calbet goes over NWC SAF products available as well as some future planned ones. He also goes over the GEO-S software.
Go to lecture slides
Ibrahim Mohammed Al-Abdul Salam shows a number of examples of MTG FCI Imagery during various weather situations over the Middle East and North Africa (MENA) region.
This presentation highlights early applications of Meteosat Third Generation (MTG) data across the Middle East and North Africa (MENA) region. Using regional case studies, it demonstrates how MTG supports the monitoring of convection, dust storms, fog, tropical cyclones, fires, and other key atmospheric features. The talk explores operational benefits, practical challenges, and the regional relevance of MTG products—while also recognizing the continued value of Meteosat Second Generation (MSG) data and its important role alongside MTG.
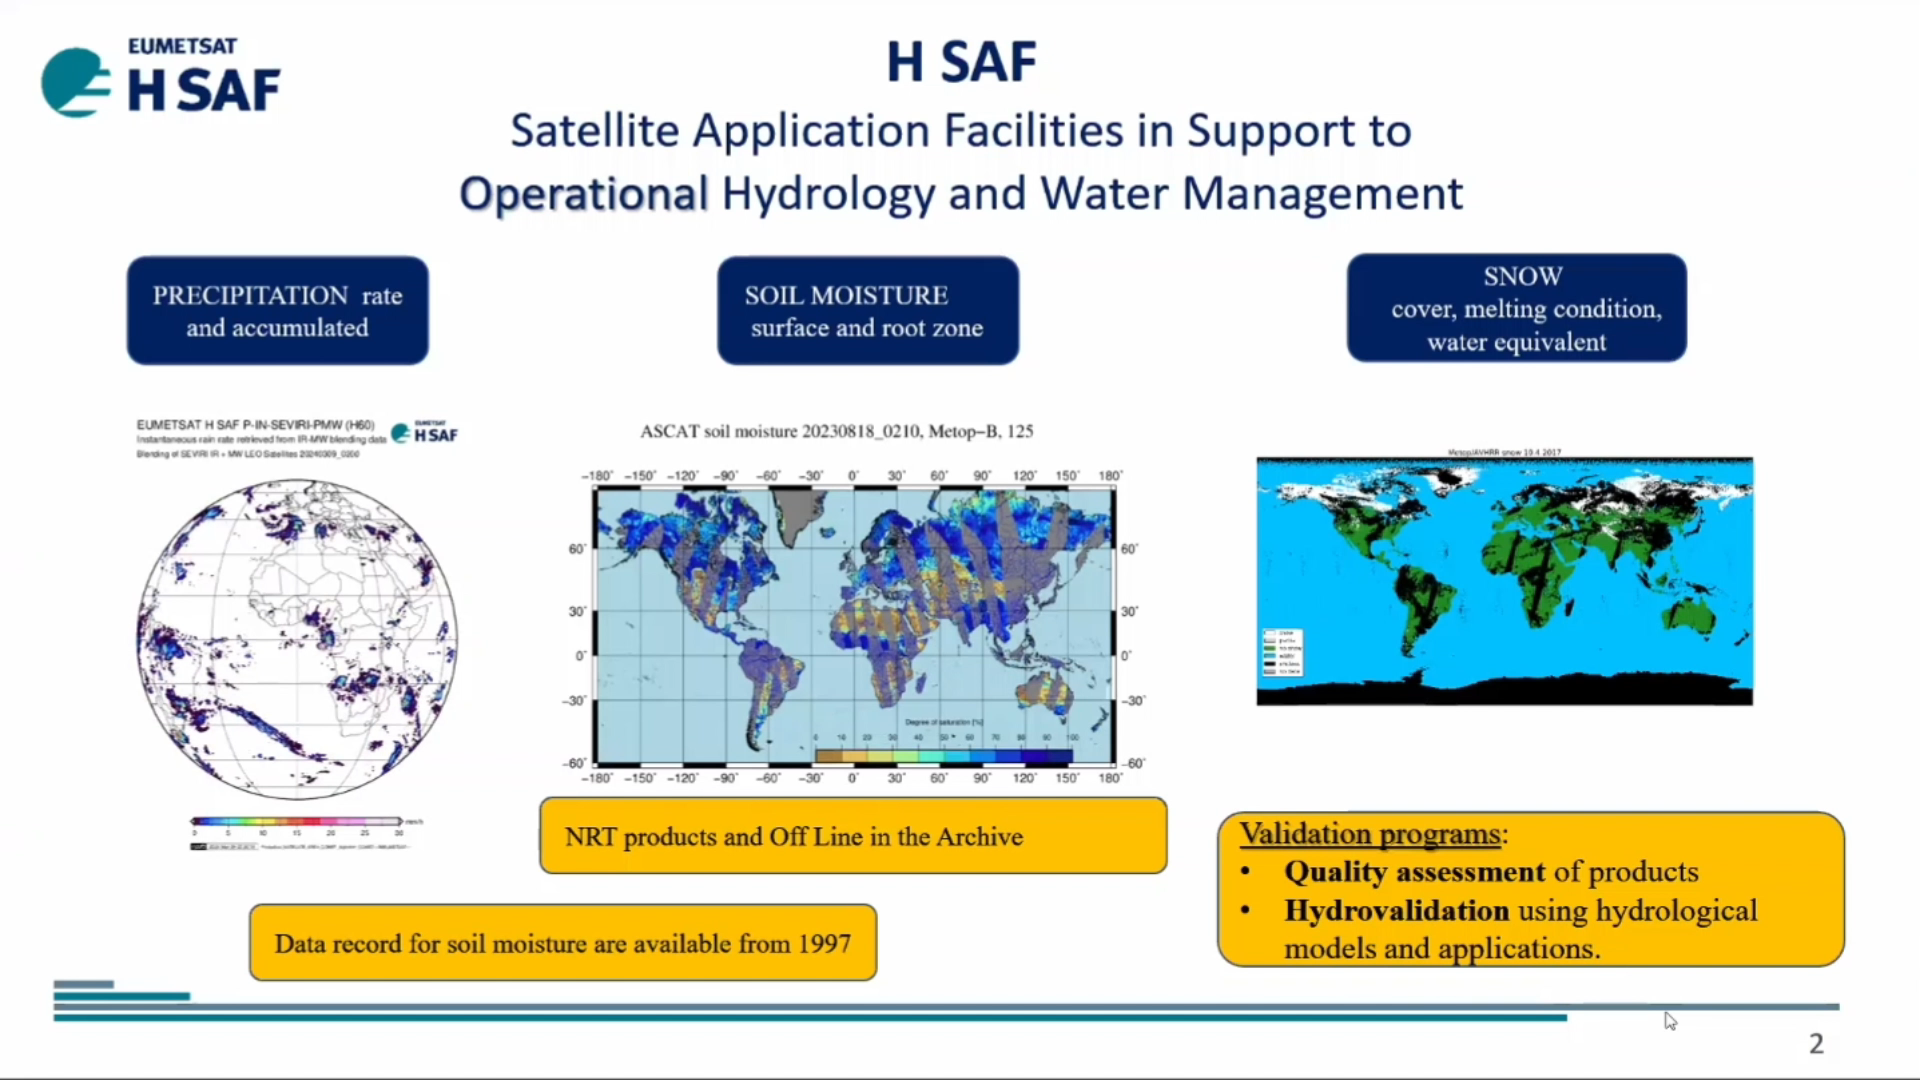
Roberto Nicoletta talks about the H SAF P-IN-FCI (H40) instantaneous precipitation and P-AC-FCI (H42) accumulated precipitation products while Semih Kuter discusses the H SAF H43 Snow Cover Product.
This talk introduces the new H SAF P-IN-FCI (H40) instantaneous precipitation and P-AC-FCI (H42) accumulated precipitation products. They are an evolution of the H60 and H61 MSG products, having a significant increment in resolution and time frequency. They are put into evidence via some examples in the European region. Some details are shown to put show the 3-times enhancements in computing performances. How to download the new products through the new website interface is also introduced. EUMETSAT H SAF H43 daily snow cover product provides 2 km resolution binary snow maps derived from MTG-FCI observations. We outline key technical features of H43, demonstrate how to access and download the product via the EUMETSAT Data Services, and present initial validation results from the 2024–2025 winter season using MODIS reference data. Case studies from the European Alps and the Russia/Kazakhstan region illustrate performance across diverse landscapes.
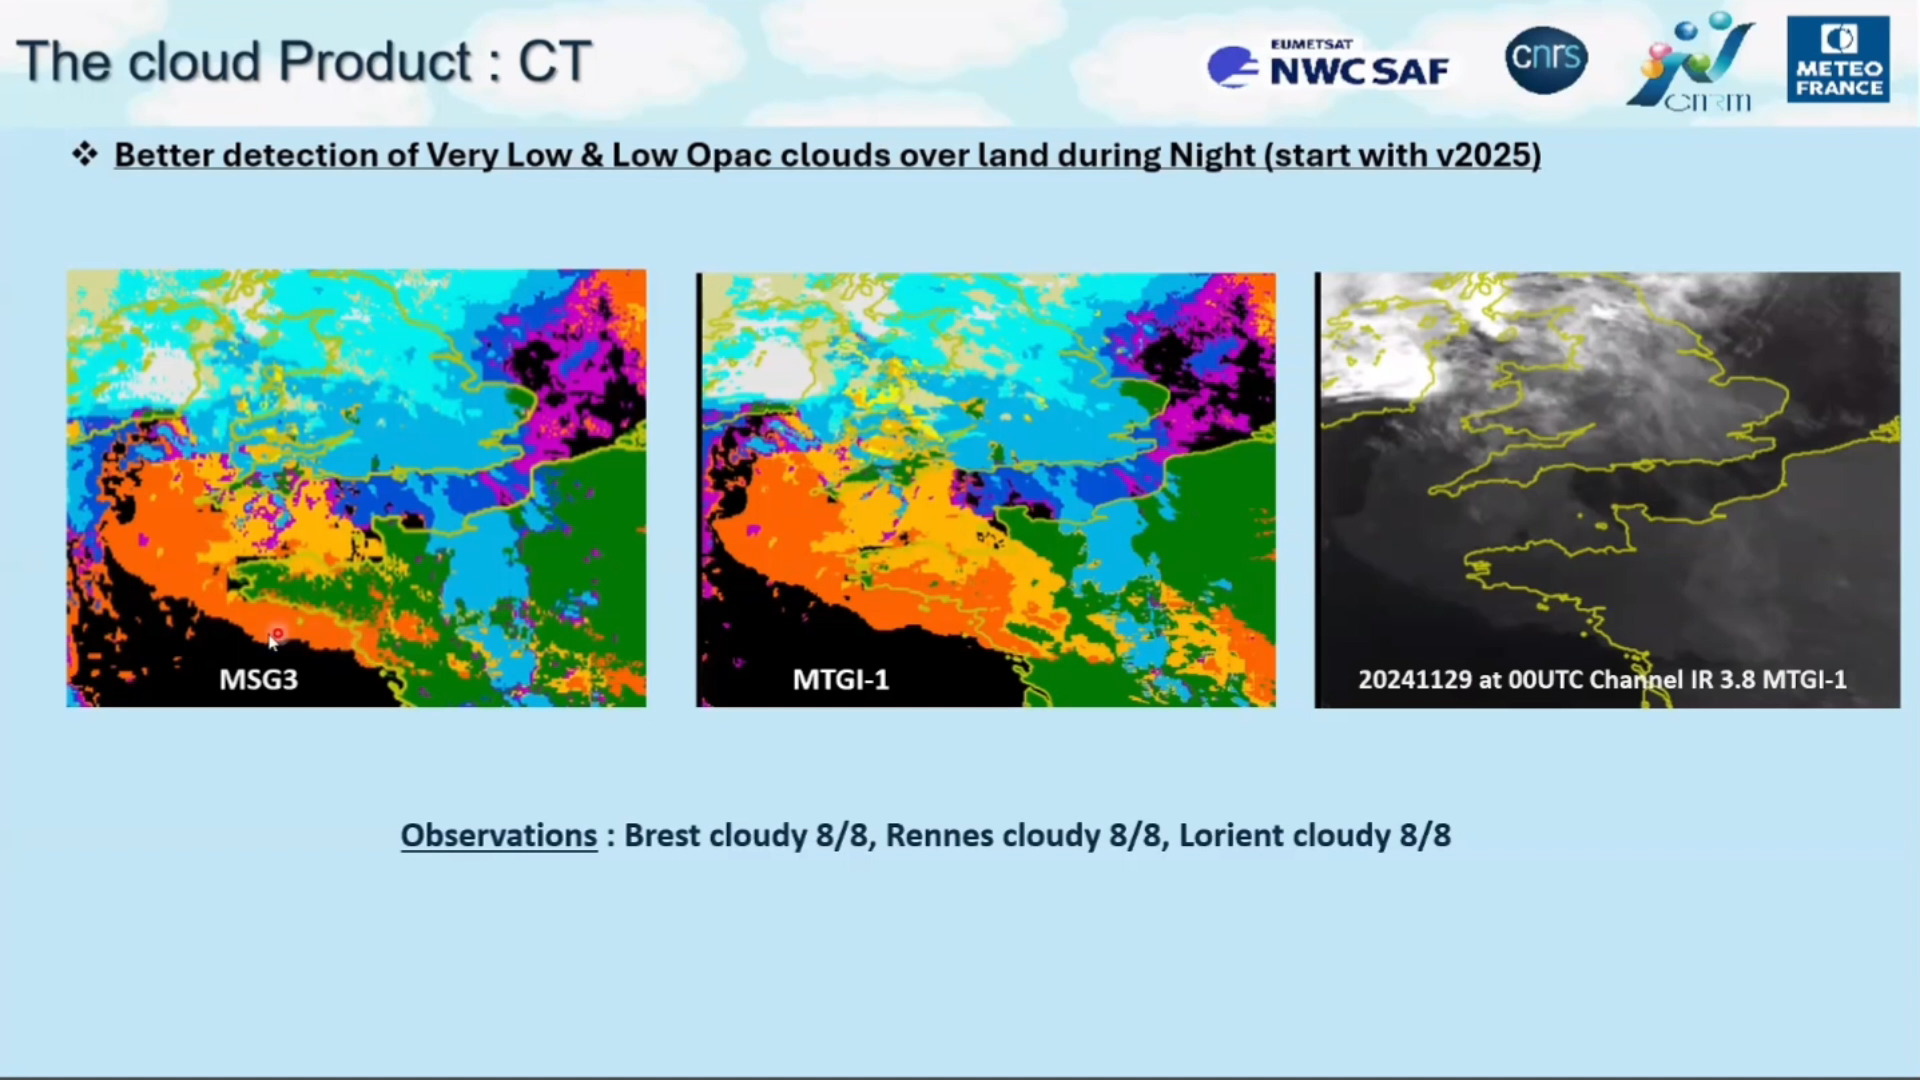
Jean Marc Moisselin and Emmanuel Fontaine talk about the benefits that MTG brings in regards to NWC SAF convection products.
Convection Initiation (CI) and Rapidly Developing Thunderstorm (RDT) are two convection products developed by Météo-France in the framework of NWCSAF. Both products fulfill requirement regarding the Day-1 MSG/MTG continuity (scores, visualization). RDT operated with MTG provides very positive features an the LI (Lightning Imager) instrument onboard MTG is very interesting and clearly add value to RDT. CI exhibits higher detection with MTG.
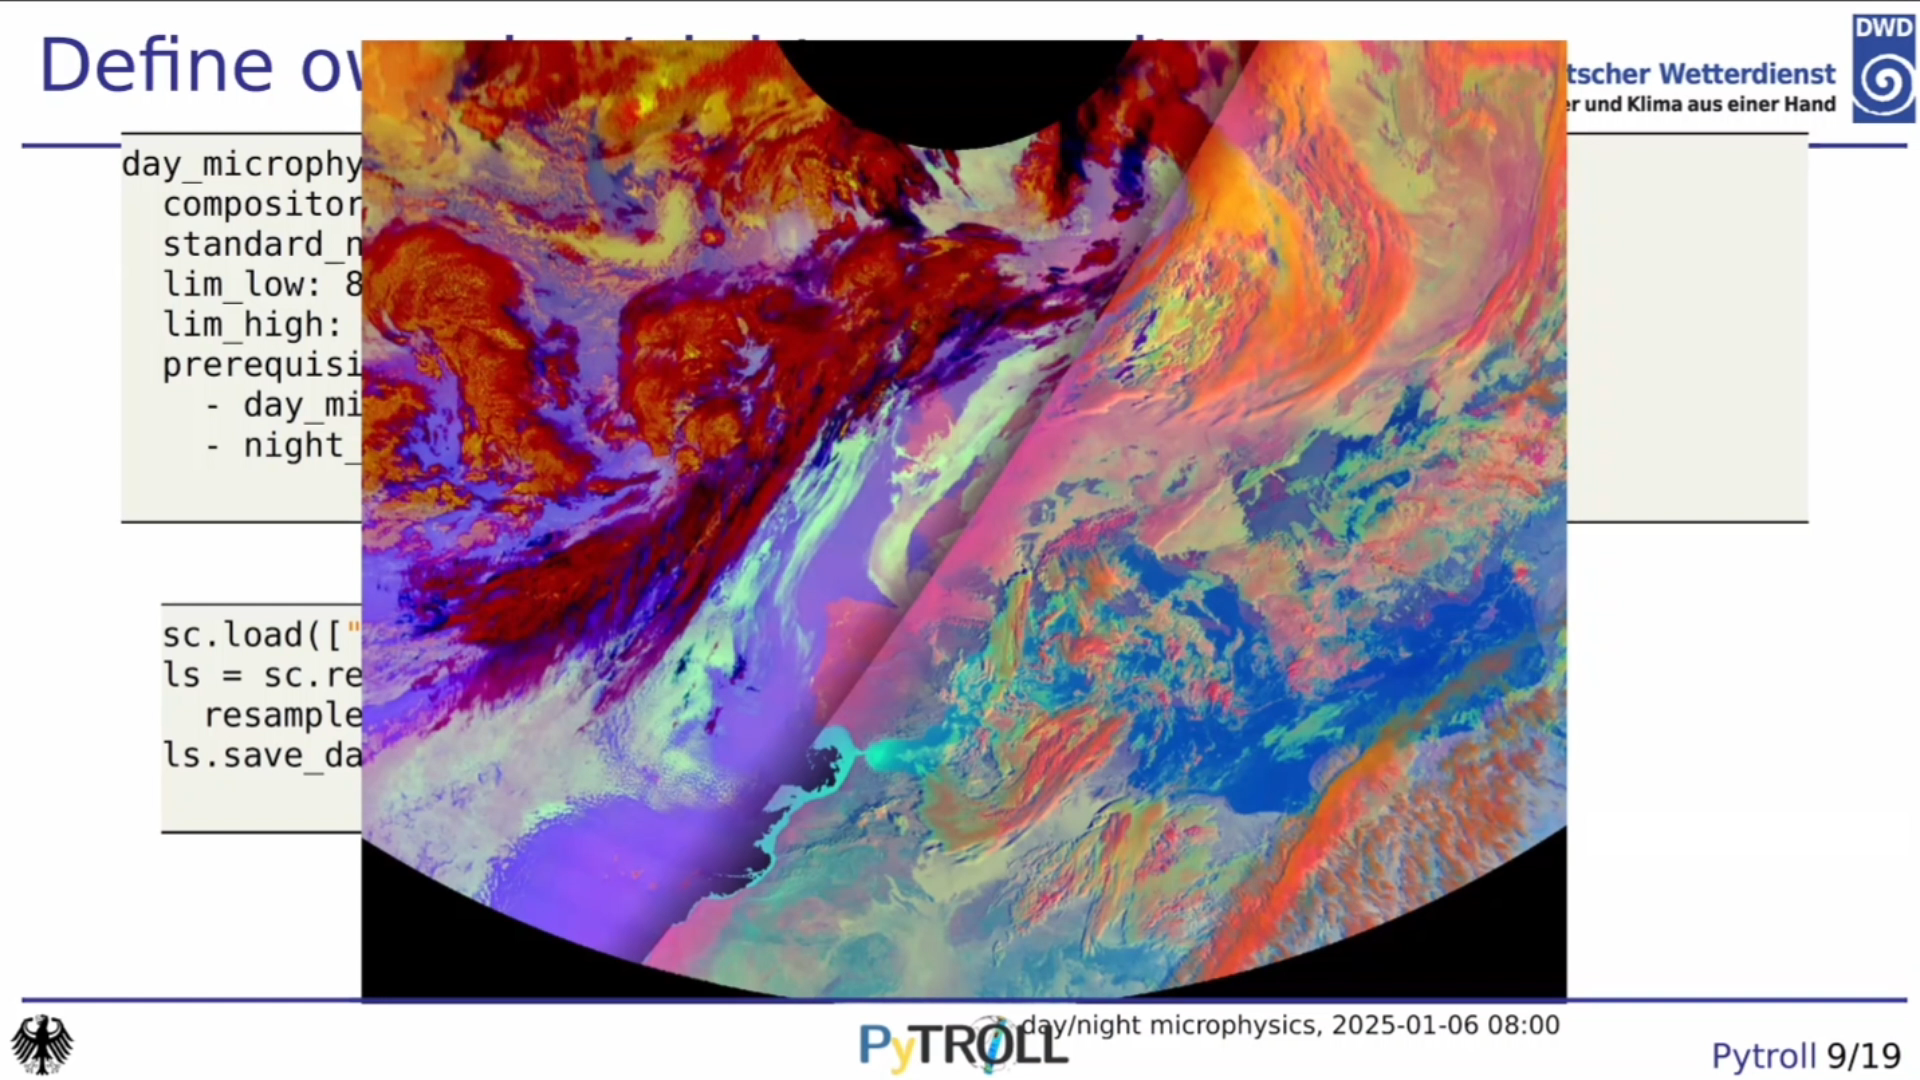
Gerrit Holl talks about Pytroll and satpy packages for visualizing MTG data within a python environment.
Pytroll is a powerful suite of packages for reading, processing, and visualising satellite data. The workhorse package, satpy, contains reading routines for many satellite data formats, including FCI level 1, FCI level 2, and LI level 2 data. In this talk, I will demonstrate how satpy can be used to process and visualise FCI and LI data programmatically. I will describe common problems and their solutions. Finally, I will briefly address how satpy can be combined with other pytroll packages for automated processing.
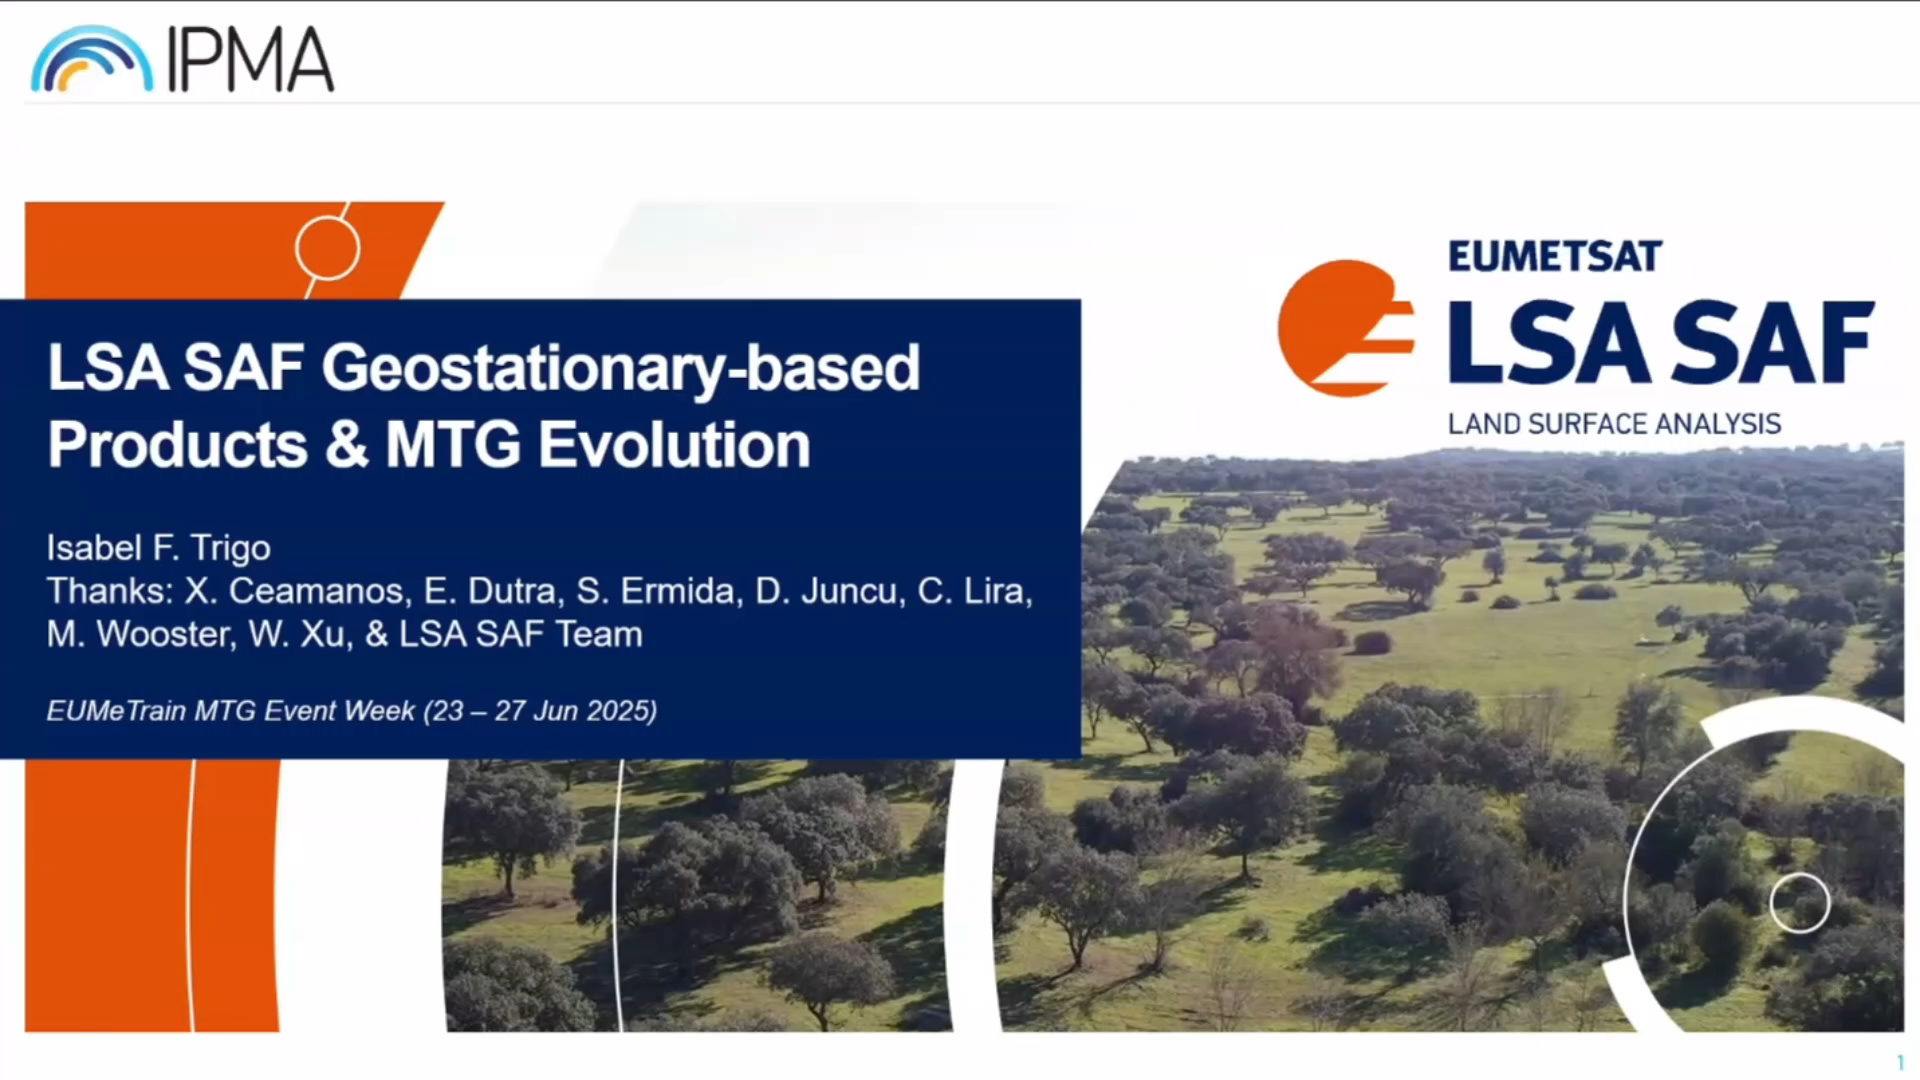
Isabel Trigo gives an overview on LSA SAF products and discusses future development.
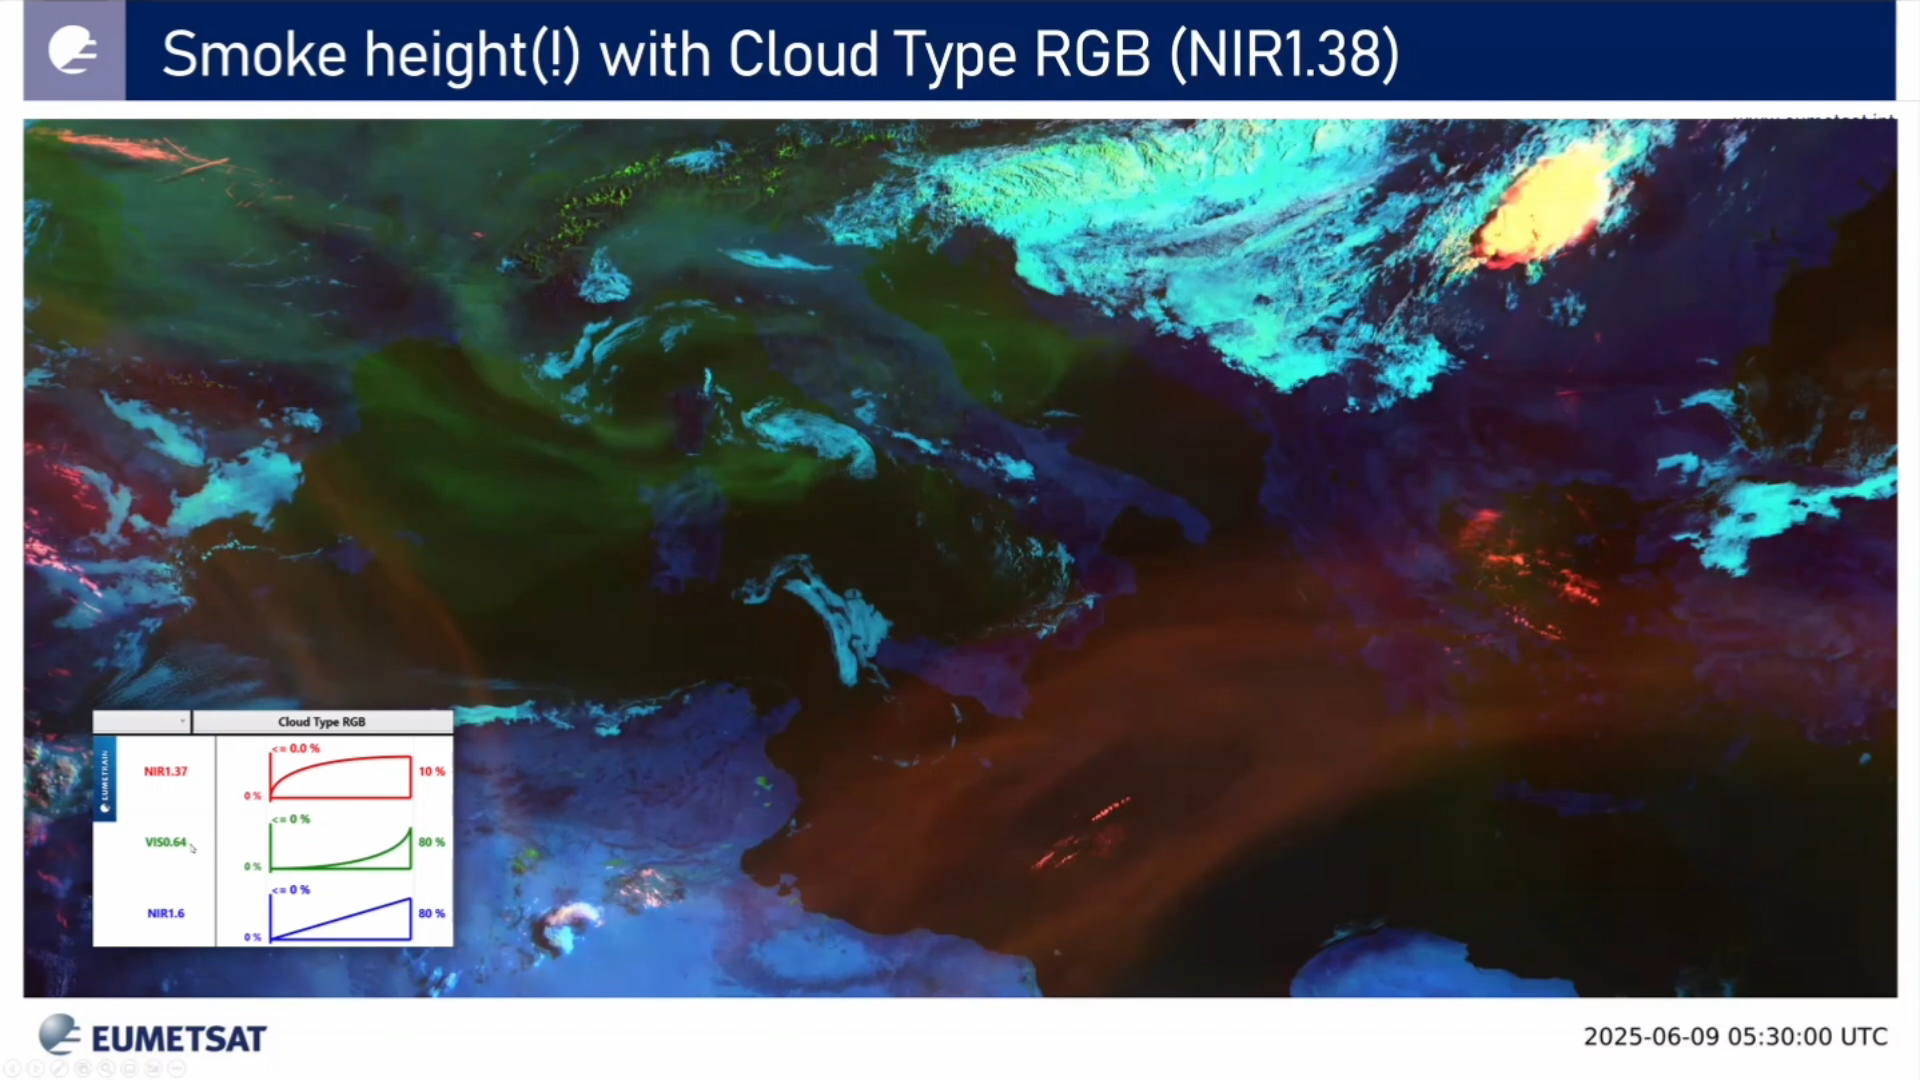
Ivan Smiljanic talks about aerosol detection with the new FCI instrument. Higher number of spectral channels coupled with increased spatial resolution make detection of aerosol better than ever.
Drawing from enhanced spectral coverage of the MTG FCI instrument (comparing with MSG SEVIRI), enhanced capabilities of aerosol detection are expected. Major improvements are during daytime related to existence of new channels with shorter wavelengths (namely VIS0.44 and VIS0.55), and to existence of new NIR1.38 that is specifically designed for detection of higher level features (including aerosols). During night time (ie 24h), enhanced spatial and radiometric resolution of IR channels offer better sensitivity to aerosols with larger particles like dust, volcanic ash or even a pollen.
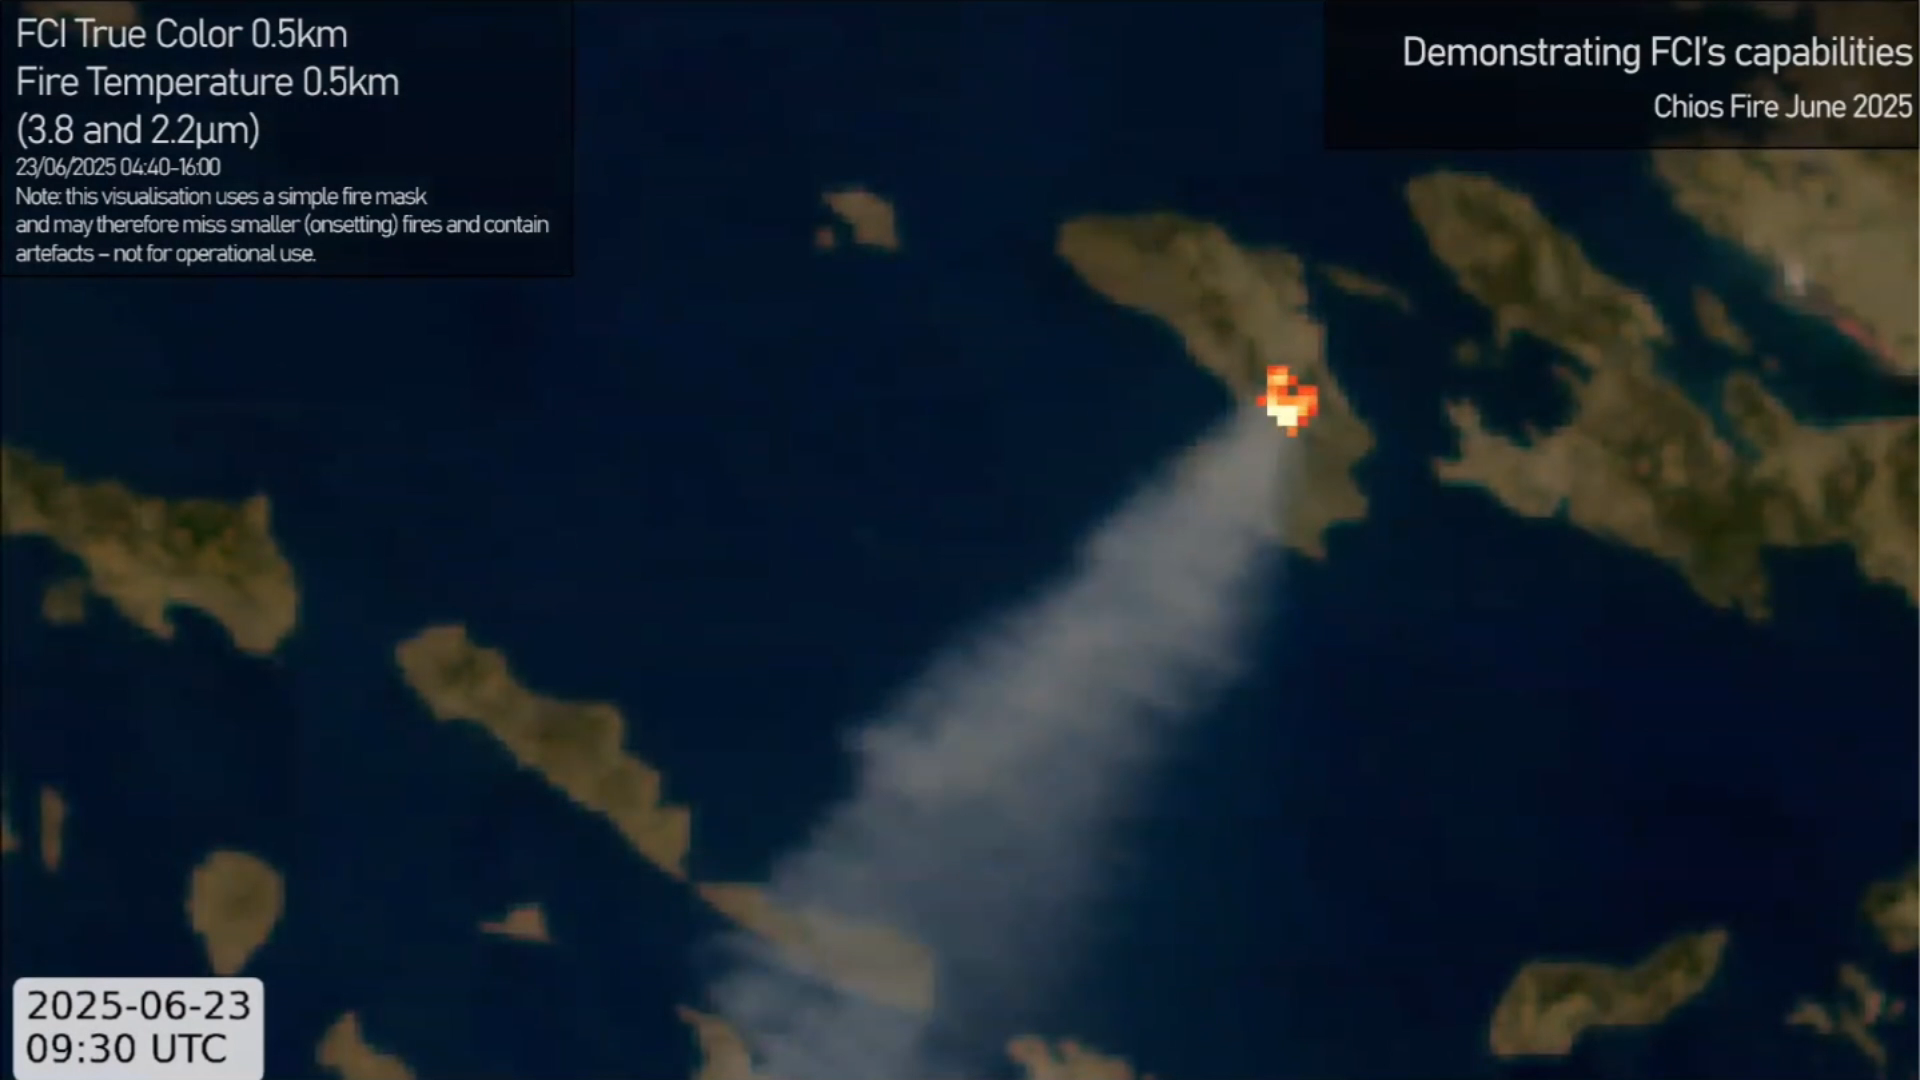
Andrea Meraner talks about the new channels on FCI instrument that bring new possibilities within the fire detection area.
The Flexible Combined Imager (FCI) instrument on-board the Meteosat Third Generation (MTG) satellite introduces unprecedented detection capabilities for wildfires from geostationary orbit. This presentation offers an overview of the instrument, focusing on characteristics relevant for identifying hotspots. We will then present case study analyses collected over the commissioning phase of the instrument, focusing on the Portugal September 2024 fires. We will explore visualisations utilising RGBs such as Fire Temperature and True Colour, leveraging the new FCI channels.