
Weather
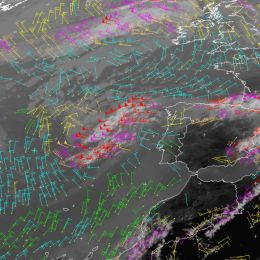
The purpose of this tutorial is to give an introduction into the topic wind measurement from satellite.
Knowledge of atmospheric motion is essential for many applications. Information on high-level atmospheric winds is of great importance for forecast models as the current state of the atmosphere has to be specified before the future state can be predicted. Winds in the upper levels can be observed using radiosondes or aircraft measurements, but those observations are limited in time and space. As satellites provide worldwide and continuous data, they are the ideal data source for regular upper atmospheric wind information.

The purpose of this tutorial is to give an introduction into the topic of land surface temperature retrieval.
In this module we focus on the land and clarify the meaning of Land Surface Temperature (LST), a parameter often confused with air temperature, aerodynamic temperature or soil temperature. The term "Land Surface Temperature" is widely used by distinct research communities such as those of climate, numerical modelling or boundary layer studies while referring to different physical meanings. We take a deep look at LST by considering how this temperature can be obtained from satellite measurements and how it compares to other temperatures.
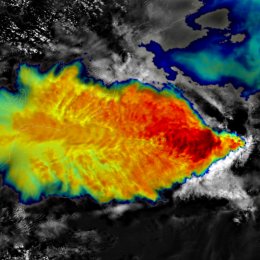
Sandwich products help to detect and analyse various cloud top features of storms (storm systems) in their mature phase.
This training module describes the Sandwich Products. These products help to detect and analyse various cloud top features of storms (storm systems) in their mature phase. It eases the detection of specific cloud-top features related to storm dynamics and microphysics, structure, and possible storm severity - such as overshooting tops, cold-U/V (enhanced-V) or cold-ring features, embedded warm spots/areas, gravity waves, above-anvil ice plumes, areas composed of very small ice particles, etc. These products directly support monitoring and nowcasting of convective storms. In areas with no, or poor, weather radar and surface observation coverage, this product is essential for proper storm detection.
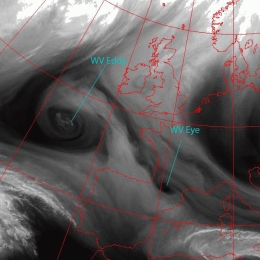
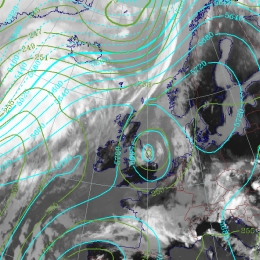
Vortices at different scales in the WV image; small scale dark circles (eyes) represent sinking stratospheric air.
WV Vortices in the northern hemisphere are cyclonically rotating and therefore associated with a trough or low in the upper levels of the troposphere. This can also be seen in PV fields, which show high values near the centre of the vortex. High values of PV are related to low tropopause height, which explain the Dark Stripe in the WV image. The Dark Stripe implies that relatively dry stratospheric air is penetrating down into the higher levels of the troposphere. Within the Dark Stripe, a local maximum of PV can often be seen. Because of the local maximum, the cyclonic circulation is enhanced. Therefore, the Dark Stripe is being deformed and the moister air spirals around the dryer air. This process either leads to the formation of a WV structures. Investigation of about 100 cases over a period of two years shows that a distinction can be made between different WV structures. The two prevailing structures are the so-called WV Eddies and WV Eyes.
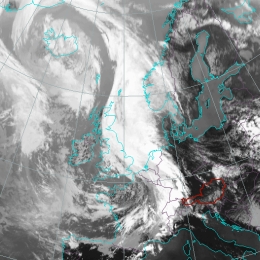
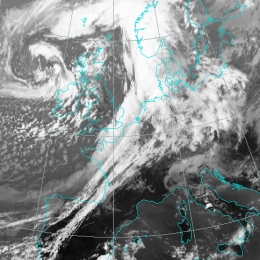
Waves are cloud bulges at the rear edge of Cold Front cloud bands, indicating the initial stage of secondary cyclogenesis.
A Wave development can be treated as a substructure in a Cold Front and indicates the initial stage of cyclogenesis. According to well-known polar front theory a low pressure area in the lower levels of the troposphere can develop if a small-scale disturbance is superimposed on the synoptic-scale air stream. This small-scale disturbance is caused by a transverse circulation within the baroclinic zone of the Cold Front. The transverse circulation is released by frontogenesis in the horizontal wind field that causes a fall in pressure, convergence and the production of cyclonic vorticity in the lower levels of the troposphere at the warm edge of the baroclinic zone. The consequence of this disturbance is that cold air moves south-eastward and warm air moves north-westward; this circulation is superimposed on the eastward-moving front. During this circulation a strengthening of the low pressure area occurs and further development of a new cyclone can be observed. In the case of the cloud bulge of a Wave a small scaled substructure within the stream lines can be observed: a strongly ascending Warm Conveyor Belt accompanies the area of the cloud bulge; a drier stream from behind approaches this relative stream; in the lower isentropic layers relative stream lines immediately south of the Wave form a saddle point - this is a consequence of the cyclonic circulation in the Wave area in the lower layers.
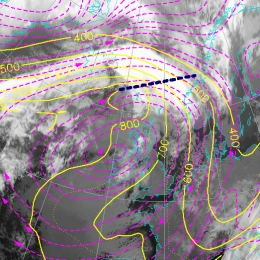
A Detached Warm Front shows a cloud configuration similar to that of a Warm Front Band, but is detached (isolated) from the Cold Front cloud band. It can be found at the leading edge of an upper level/thickness ridge.
In the case of an eastward moving classical frontal system the Detached Warm Front is mostly observed within the eastern branch of a pronounced synoptic scale ridge in the height and thickness fields, accompanied by strong winds in higher levels of the troposphere (approximately at 500 hPa) which blow normal to the movement of the ridge system. A possible and often observed indication for the formation of a Detached Warm Front is a splitting of the wind field within the mid- and upper levels of the troposphere in the area of the Warm Front into a north-western and a strong southern stream. This causes the cloud field of the Detached Warm Front to move more or less rapidly southward within the eastern branch of the upper level ridge which is, in this case, very close to the high gradient zone of equivalent thickness. The original frontal system, which is situated further north, moves from west to east. Consequently the different air streams cause two WA maxima. WA maxima contribute to upward motion which is one reason for the maintenance of cloudiness.
Warm Front Shields are accompanied by cloud shields comprising the areas of the warm sector and the Warm Front.
The classical physical Warm Front model as well as the conveyor belt theory of Warm Fronts do not discriminate between the Warm Front Band and the Warm Front Shield. But the main difference between the Warm Front Band and the Warm Front Shield is the cloudiness within the warm sector. In case of the warm front shield the cloudiness within the warm sector is associated with a more or less pronounced upper level front and there is a pronounced ascending Warm Conveyor Belt on the various surfaces of these frontal zones. It overruns the Warm Front surface lines and mostly exists in a deep layer of the troposphere. This may be the reason for thick cloudiness and precipitation in the warm sector behind the surface front. It contrast for the case of a warm front band there is not enough ascending motion within the Warm Conveyor Belt, which is the reason that no cloudiness develops.
Warm Front Bands are accompanied by cloud bands which usually are shorter than Cold Front cloud bands.
In the case of a Warm Front, warm moist air moves against colder dry air. At the boundary of these two air masses the warm air tends to slide up over the wedge of colder air. This process causes the frontal cloud band, and the associated precipitation, found mainly in front of the surface front. The idealized structure and physical background of a Warm Front can be explained with the conveyor belt theory as follows: Frontal cloud band and precipitation are in general determined by the ascending Warm Conveyor Belt, which has its greatest upward motion between 700 and 500 hPa. The Warm Conveyor Belt starts behind the frontal surface in the lower levels of the troposphere, crosses the surface front and rises to the upper levels of the troposphere. There the Warm Conveyor Belt turns to the right (anticyclonically) and stops rising, when the relative wind turns to a direction parallel to the front. If there is enough humidity in the atmosphere, the result of this ascending Warm Conveyor Belt is condensation and more and more higher cloudiness. The Cold Conveyor Belt in the lower layers, approaching the Warm Front perpendicularly in a descending motion, turns immediately in front of the surface Warm Front parallel to the surface front line. From there on the Cold Conveyor Belt ascends parallel to the Warm Front below the Warm Conveyor Belt. Due to the evaporation of the precipitation from the Warm Conveyor Belt within the dry air of the Cold Conveyor Belt, the latter quickly becomes moister and saturation may occur with the consequence of a possible merging of the cloud systems of Warm and Cold Conveyor Belt to form a dense nimbostratus. In addition to this idealized structure, the experience from a series of case studies carried out at ZAMG differs somewhat from the one described above, allowing more differentiation.
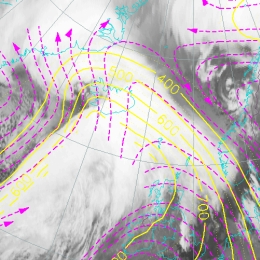
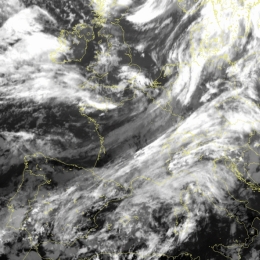
Middle and high level cloud in a rising warm, moist air stream relative to its system velocity.
The Warm Conveyor Belt is a rising relative stream transporting warm wet air from south-east to northern directions. Warm Conveyor Belts are directly involved in the frontal processes, but typical cloud configurations can also be observed separately from the frontal cloudiness. Different states of the atmosphere are responsible for these two types: 1.) The cloudiness of a front is developed within two relative streams: the Warm Conveyor Belt and a less wet relative stream from the trough area behind. the Warm Conveyor Belt is connected at least with the leading part of the cloudiness, therefore the relative stream lines approach or even overrun the surface front. 2.) In the case of separated Warm Conveyor Belt cloudiness the relative stream lines are in front of the frontal cloud band and the relative stream from behind crosses the frontal line in a forward direction, consequently approaching the stream lines of the Warm Conveyor Belt. A survey by ZAMG has shown that over the past two years over 57% of the Warm Conveyor Belts that occurred happened over North-Africa and the Mediterranean and could be subscribed to the more isolated and separated type of Warm Conveyor Belt. Of the 467 cases examined less than 70 (15%) occurred over western, northern or eastern Europe and were mostly connected to a frontal system.
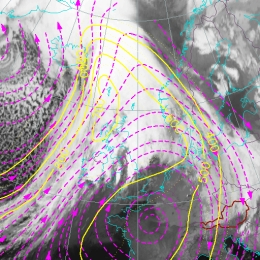
Cut off low in upper levels without corresponding surface low, accompanied by cloud bands at the boundaries and convective cloud in the low center.
Upper Level Lows are closed cyclonically circulating eddies. As these lows are only upper and mid-tropospheric features, they do not have a corresponding low within the lower levels of the troposphere, at least in the beginning. The development of an Upper Level Low depends on the existence of unstable waves within the general flow in the upper levels of the troposphere. These unstable waves are caused by a phase shift between the temperature wave and the potential wave which can lead to further developments. The temperature wave being situated behind the potential wave. Therefore CA can be found within the area of the upper level trough. During this stage of development the field of the absolute topography is characterized by an increase of the amplitude of the potential wave and sometimes also by a decrease of the wavelength. The same development takes place for the temperature wave. In the northern hemisphere a southward deviation of the isohypses and isotherms of the upper level trough can be observed leading to a deepening of the trough. Finally the trough will start to detach from the meridional stream and the formation of a cut of low (Upper Level Low) can be observed.
Organised cloudiness in the thickness ridge in front of a Cold Front which can be extremely convective in unstable situations.
Generally Thickness Ridge Cloudiness is situated within a rising warm conveyor belt and is generally found within a ridge or a closed maximum of equivalent thickness. Relative streams provide a good explanation of the physical processes involved in the formation of Thickness Ridge Cloudiness. The warm conveyor belt dominates the Thickness Ridge Cloudiness over a thick layer and sometimes influences a part of the frontal cloud band. Besides an upper relative stream/dry intrusion can be seen to the rear of the frontal cloud band. During the summer season there can be strong convective activity within the thickness ridge. As a result of the thermal energy and the high relative humidity within the thickness ridge this convective activity can be very strong.
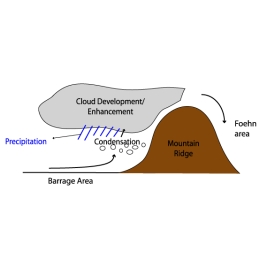
Low and middle level cloudiness develops at the windward side of mountains if the wind streams almost perpendicularly to the mountain barrier.
Barrage cloudiness is an orographically influenced conceptual model. If there is a stream field orthogonal to a mountain range it is blocked by the barrier, forced to rise over or forced to flow around the barrier according to the extent and height of the mountain ridge. This forced rising of the stream leads to adiabatic cooling and, if there is sufficient humidity, to condensation. Consequently, cloudiness with a high probability for precipitation forms at the windward side of the mountain range. The intensity of the precipitation can be very strong and depends upon the distribution of the wind field with height or the type of Barrage. Different types of Barrage events can be distinguished from the direction of the flow and whether there are separate Barrage Clouds or Barrage within frontal zones. Although the latter is usually accompanied by heavy precipitation, in general, a dominating orthogonal component in the wind fields from 1000 hPa to 500 hPa generates more intensive precipitation.