
Identify and interpret fields and derived products
A demonstration session that gives an overview on how to download, read and visualize H SAF soil moisture data using the Python programming language.
The demonstration session gives an overview how to download, read and visualize H SAF soil moisture data using the Python programming language. Jupyter notebooks are used to present code examples, which are hosted at GitHub. H SAF Surface Soil Moisture (SSM) and Root-Zone Soil Moisture (RZSM) products are comprised of either Near Real-Time (NRT), Offline or Data Records (DR) products, which are freely available after user registration at the H SAF data portal. RZSM products are generated fromassimilating the ASCAT-derived surface SM in the ECMWF/H SAF land data assimilation system. Additionally, a hydrological exercise will highlight the added value of soil moisture satellite data for flood prediction. Soil moisture conditions have a great impact on the transformation of precipitation into runoff. A correct estimation of the initial soil moisture condition is a critical aspect for operational flood prediction. In the exercise we will test the sensitivity of flood response to initial soil moisture conditions using a simple hydrological model over an African Basin.
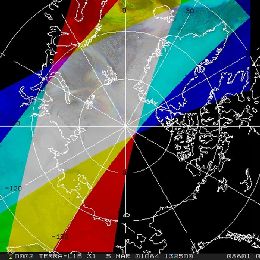
Regis Borde from Eumetsat explains in his presentation how winds are derived from polar orbiting satellites in the Arctic and Antarctic region.
Atmospheric Motion Vectors (AMVs) have been derived from geostationary satellites since late seventies. In 2001, an experimental polar wind product has been developed at the University of Wisconsin-Madison’s (CIMSS) using imagery from MODIS instrument on NASA’s Terra satellite. Filling the lack of observational data over Polar Regions this product demonstrated a global positive impact on the forecast not only over polar areas. Following the initial CIMSS developments, EUMETSAT recently started to extract polar winds from METOP AVHRR instrument. Regis Borde´s session will provide some general information about the current status of polar winds product and about its extraction. The general methodology to derive polar winds from satellite images is mainly based on the heritage used for geostationary satellites, but some specific problems had to be considered due to larger timeliness between consecutive images, to characteristics of the instruments and to specificities of polar areas atmosphere.
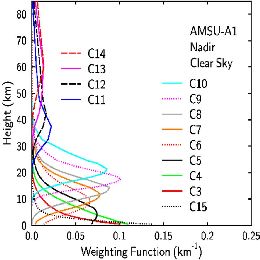
Ralf Bennartz from the University of Wisconsin gives an introduction on the principles of atmospheric soundings with AIRS and AMSU sensors.
High resolution infrared sounders, such as AIRS and IASI, and microwave sounders, such as AMSU, are a key element of the global satellite observing system and provide a wealth of data important for various operational applications including data assimilation and nowcasting applications. This presentation will revisit the physical basis of infrared and microwave sounding and provide an overview on the state-of-the-art of microwave and infrared soundings.
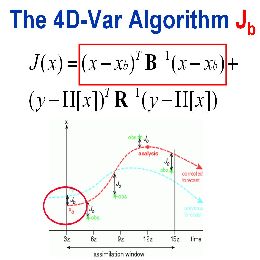
Tony McNally from ECMWF speaks about data assimilation of polar orbiting satellites. He gives an insight into the methods used and accentuates the benefits of satellite data in general for the forecast skills.
This lecture introduces the central role played by data assimilation in Numerical Weather Prediction, Climate Reanalysis and Environmental monitoring. It will be shown that radiance observations from polar orbiting satellites are the single most influential component of the global observing network and the impact of these data on forecast quality will be demonstrated. Finally, the major scientific challenges facing the successful exploitation of satellite radiance observations will be discussed - in particular issues related to vertical resolution, cloud and precipitation contamination and systematic errors.
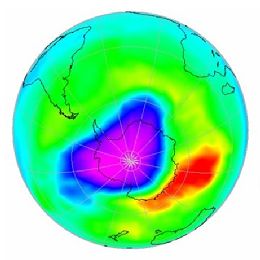
Nan Hao from DLR gives an overview on ozone and other trace gases products from the O3M SAF. The presentation is completed by numerous examples.
This lecture focuses on the ozone and other minor trace gas products, such as NO2 and SO2, from the GOME-2 and IASI instruments on MetOp. These products are developed in the framework of EUMETSAT’s Satellite Application Facility on Ozone and Atmospheric Chemistry Monitoring (O3M-SAF), as part of EUMETSAT’s Polar System (EPS) Ground Segment. The O3M-SAF is responsible for the algorithm development, the operational processing, dissemination and archiving of the products, as well as providing User Services. The ozone and minor trace gas products from GOME-2 and IASI are used in research of atmospheric composition, like ozone loss, dynamics, anthropogenic effects, and in applications of environmental security, like monitoring of volcanic eruptions and pollution.
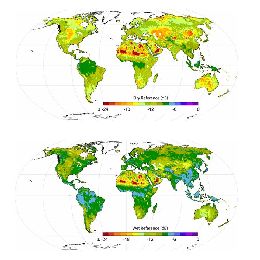
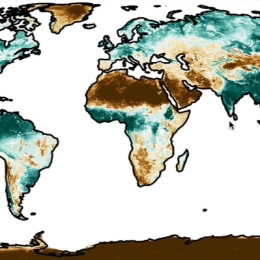
Sebastian Hahn from the Vienna Technical University talks in his presentation about the different sensors for the retrieval of soil moisture onboard polar orbiting satellites and describes the SM algorithm developed at the TU-Wien.
Although soil moisture represents only about 0.005% of the global water resources, it is one of the crucial variables in hydrological processes, influencing the exchange of water and energy fluxes at the land/atmosphere interface. For many environmental studies it is important to have accurate estimates of the spatial and temporal variations of soil moisture (e.g. hydrology, meteorology). Advances in satellite remote sensing have shown the potential of estimating soil moisture using various remote sensing techniques. This presentation will focus on an introduction using active and passive microwave remote sensing for the retrieval of soil moisture. In case of the active retrieval a detailed description of the semi-empirical model used for the METOP ASCAT soil moisture product will be shown step by step, especially highlighting assumptions and limitations. In the end various applications using satellite based soil moisture products will be summarised.
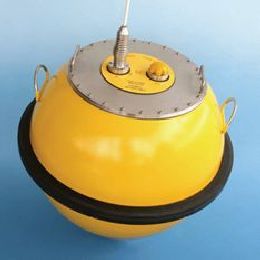
Jose Candido from WavEC talks in his presentation about the use of satellite derived altimetry data for wave energy applications.
Altimeter estimates of the significant wave height Hs are quite accurate. The assessment of the wave energy resource in deep water locations requires not only the knowledge of Hs but also of the wave period, in particular the energy period Te. Several models have been proposed in order to derive the mean zero-crossing period from the altimeter backscatter coefficient with reasonable accuracy. The attempts to establish a relation between Tz and Te revealed significant constraints. As a consequence, the exclusive use of altimeter data may be suitable only for preliminary wave energy resource assessment purposes. Additionally, given their wide geographic availability, altimeter Hs estimates are typically applied in the validation of wave model data used in wave energy resource assessment studies.
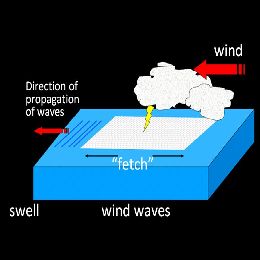
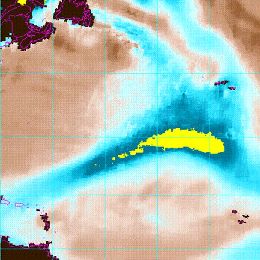
Sergio Muacho from IPMA gives a presentation on Jason-2 altimetry data. He explains the measuring principle and applies the data to track an Atlantic wave storm.
This presentation reports on the use of significant wave height (SWH) altimetry product, derived from OSTM/Jason-2 data, during a recent wave storm in the Northeast region of the Atlantic Ocean at mid-April 2012. Altimetric measurements provide data for wave model assimilation and also support ocean forecasts. Sérgio Muacho will focus on remote-sensed observations that cover a period of one week, and track the wave storm over the Atlantic between south of Iceland and the Portuguese Continental West coast, and the Gulf of Biscay. This study provides a summary of this wave storm and highlights the importance of having altimetry data in ocean areas, where there is a lack of observations, especially in off-shore regions.
Nuno Moreira from IPMA guides you through the web sites mentioned in the presentations during the Polar Satellites Week.
In this session you will be taken on a website tour, visiting pages where polar satellite products referred during the whole EUMETRAIN Polar Satellite Week can be visualized. “Web-Visits” will naturally include EUMETSAT or NOAA pages and it will be an opportunity to make a wrap-up on the contents previously discussed...
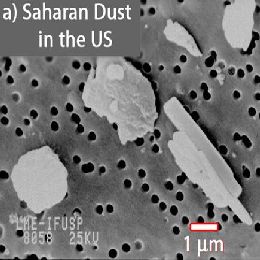
Piet Stammes from KNMI talks about aerosol retrieval with GOME-2 instrument onboard MetOp satellites since 2006. Intercomparison with other instrument data and examples round up the presentation.
Aerosols are small liquid or solid particles in the atmosphere, like soil dust, sulphate and nitrate droplets, organic compounds, volcanic ash, etc.. Aerosols affect weather and climate by reflection and absorption of sunlight, by affecting cloud formation and precipitation, and by reducing visibility. Satellite detection of aerosols is often difficult because of the relatively weak reflectance of aerosols as compared to clouds and the background reflection of the underlying surface. Using UV-Visible spectrometers like OMI and GOME-2, UV absorbing aerosols like biomass burning smoke, volcanic ash and desert dust can be detected, even in cloudy cases and over land surfaces. In this presentation the current and future aerosol products from GOME-2 available from the O3MSAF will be introduced.
Nigel Atkinson from the UK MetOffice presents the AAPP package to process ATOVS and AVHRR data. Some processing and visualisation examples are given.
The ATOVS and AVHRR Pre-processing Package (AAPP) is a tool to process sounder and imager data from the NOAA, Metop and FengYun polar orbiting satellites. It was originally developed in the late 1990s to support processing of direct broadcast data from the NOAA-POES satellites, and has since been extended to accommodate Metop (including IASI) and more recently Suomi-NPP. The package is maintained by the EUMETSAT Satellite Application Facility for Numerical Weather Prediction (NWP SAF). An overview will be given of the capabilities of AAPP, including how it complements other processing packages such as IMAPP and CSPP. AAPP products include calibrated, re-mapped radiances (for NWP) and derived products such as cloud mask. Examples of the products and their uses will be shown.
NOAA satellite analyst Sheldon Kusselson shows the variety of water vapour products available from polar platforms. A practical example concludes his presentation.
Since 1992 operational NOAA satellite analysts and forecasters have used polar orbiting microwave products to complement and supplement geostationary satellite, observational and computer model data to further improve precipitation forecasts. My session will provide an overview of current SSMIS and NOAA/MetOp MHS and AMSU polar orbiting microwave products, like Total Precipitable Water (TPW) and Rain Rate (RR) and how they can be used to help enhance precipitation forecasts with an emphasis on the eastern North Atlantic Ocean into the European continent. From these different individual satellite sensors microwave TPW and RR products have come a new class of satellite product called “the blended or merged product” that will also be discussed, displayed and compared with EUMETSAT geostationary satellite imagery. A case study showing these blended/merged TPW and RR products for the February 2010 Madeira storm will also be shown.