
Weather
Xavier Calbet goes over NWC SAF products available as well as some future planned ones. He also goes over the GEO-S software.
Go to lecture slides
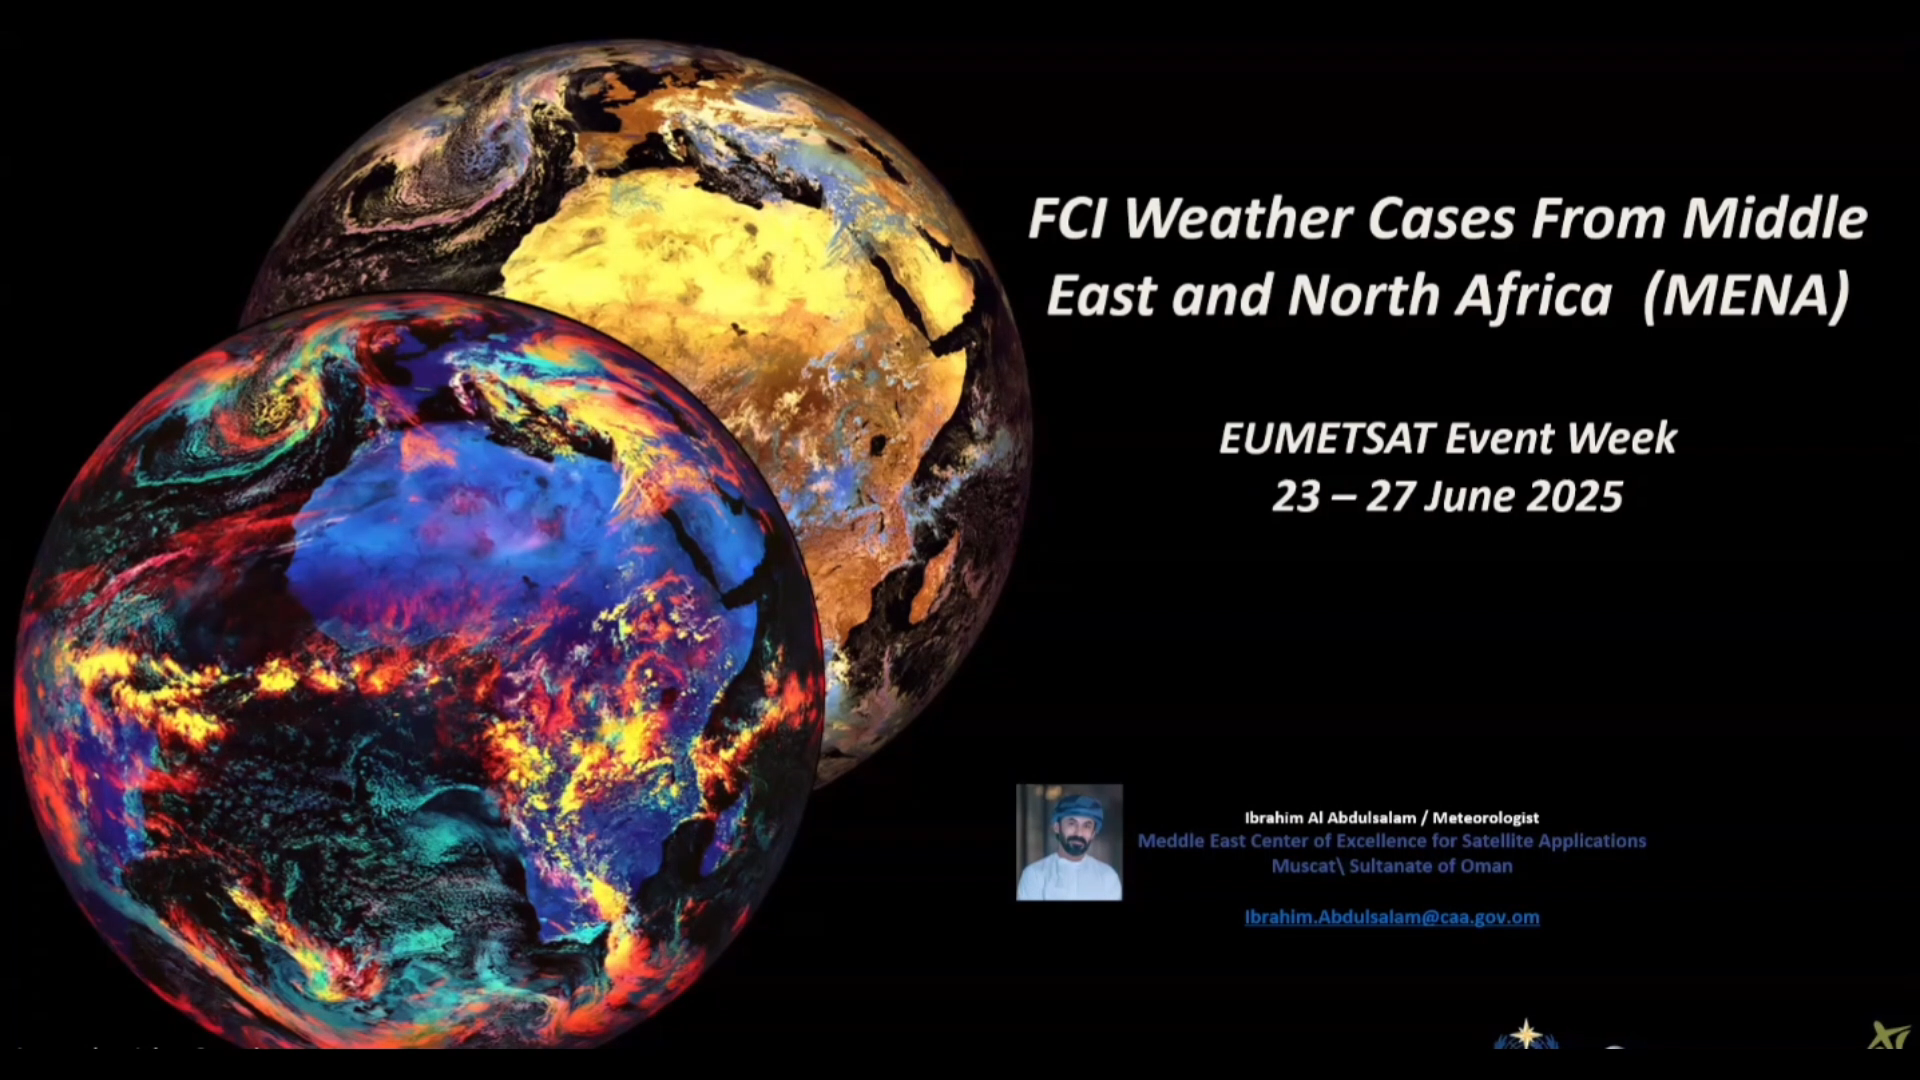
Ibrahim Mohammed Al-Abdul Salam shows a number of examples of MTG FCI Imagery during various weather situations over the Middle East and North Africa (MENA) region.
This presentation highlights early applications of Meteosat Third Generation (MTG) data across the Middle East and North Africa (MENA) region. Using regional case studies, it demonstrates how MTG supports the monitoring of convection, dust storms, fog, tropical cyclones, fires, and other key atmospheric features. The talk explores operational benefits, practical challenges, and the regional relevance of MTG products—while also recognizing the continued value of Meteosat Second Generation (MSG) data and its important role alongside MTG.
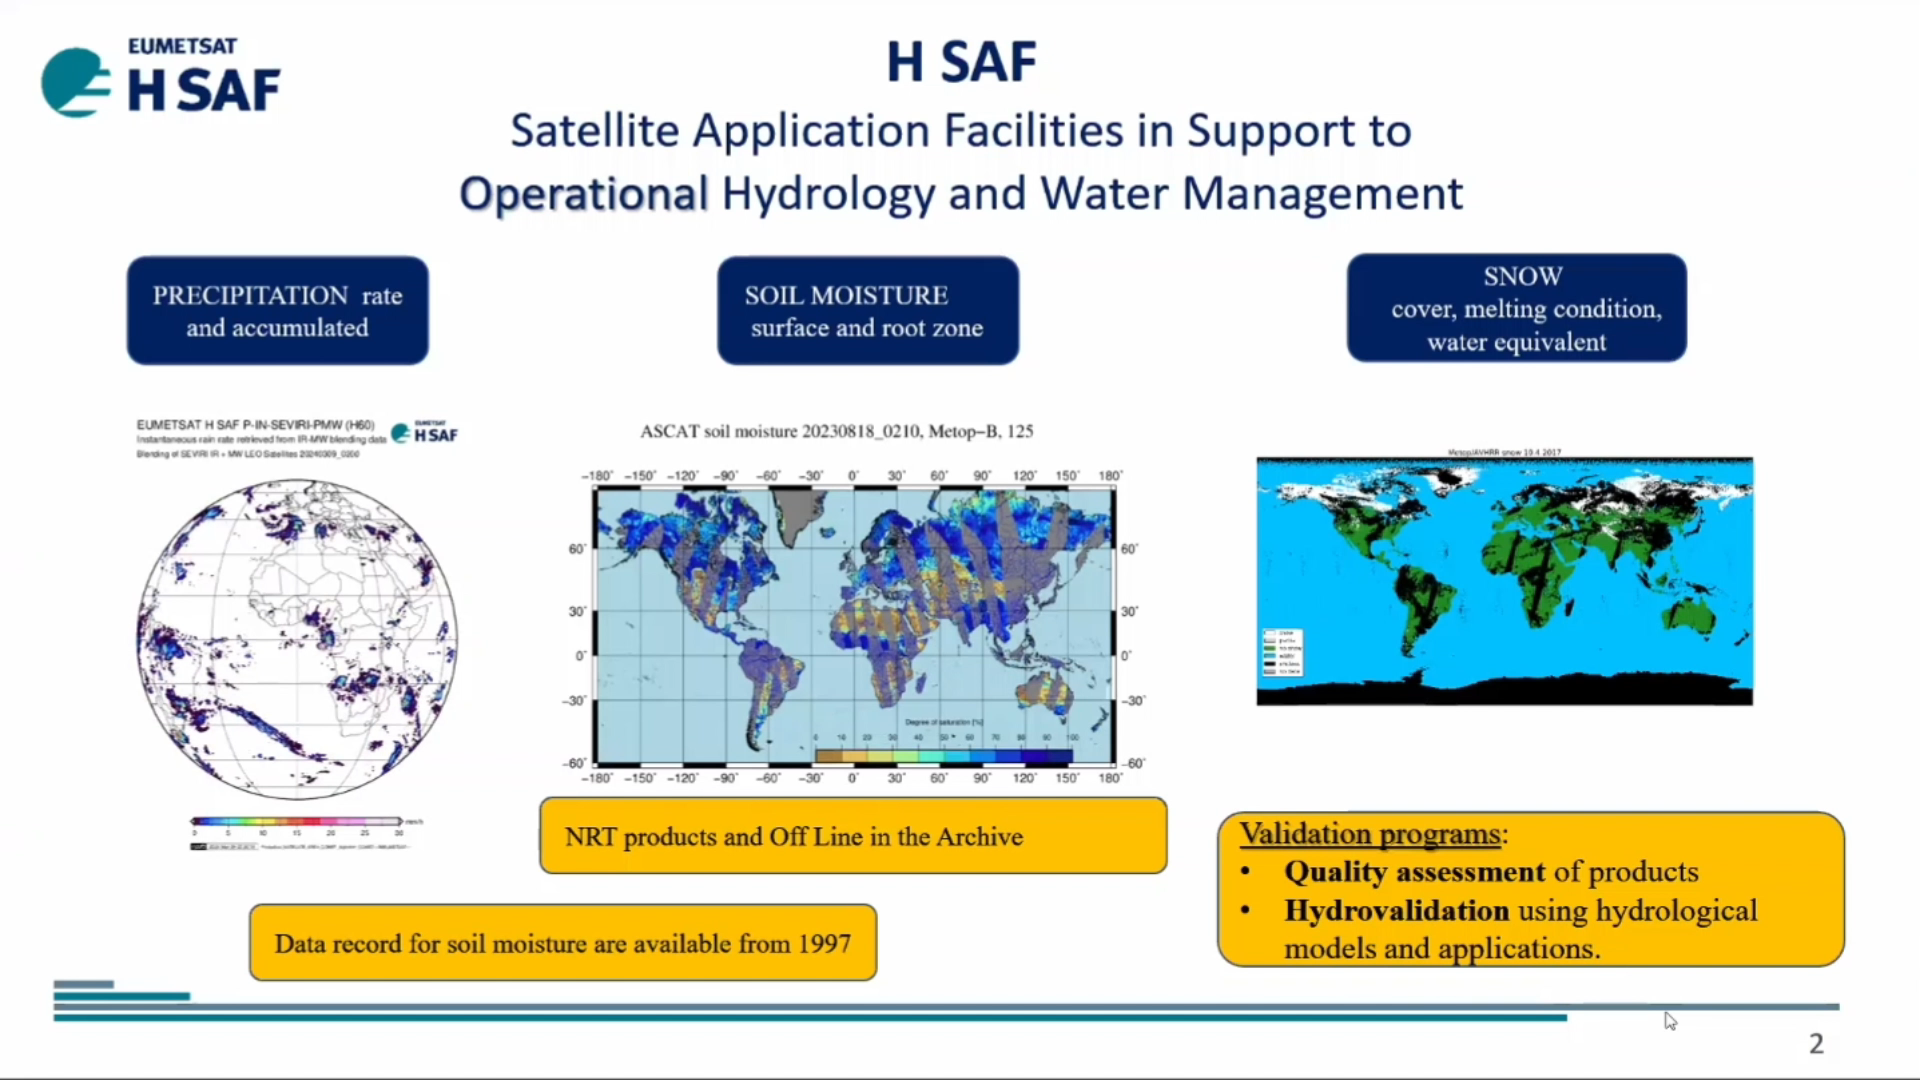
Roberto Nicoletta talks about the H SAF P-IN-FCI (H40) instantaneous precipitation and P-AC-FCI (H42) accumulated precipitation products while Semih Kuter discusses the H SAF H43 Snow Cover Product.
This talk introduces the new H SAF P-IN-FCI (H40) instantaneous precipitation and P-AC-FCI (H42) accumulated precipitation products. They are an evolution of the H60 and H61 MSG products, having a significant increment in resolution and time frequency. They are put into evidence via some examples in the European region. Some details are shown to put show the 3-times enhancements in computing performances. How to download the new products through the new website interface is also introduced. EUMETSAT H SAF H43 daily snow cover product provides 2 km resolution binary snow maps derived from MTG-FCI observations. We outline key technical features of H43, demonstrate how to access and download the product via the EUMETSAT Data Services, and present initial validation results from the 2024–2025 winter season using MODIS reference data. Case studies from the European Alps and the Russia/Kazakhstan region illustrate performance across diverse landscapes.
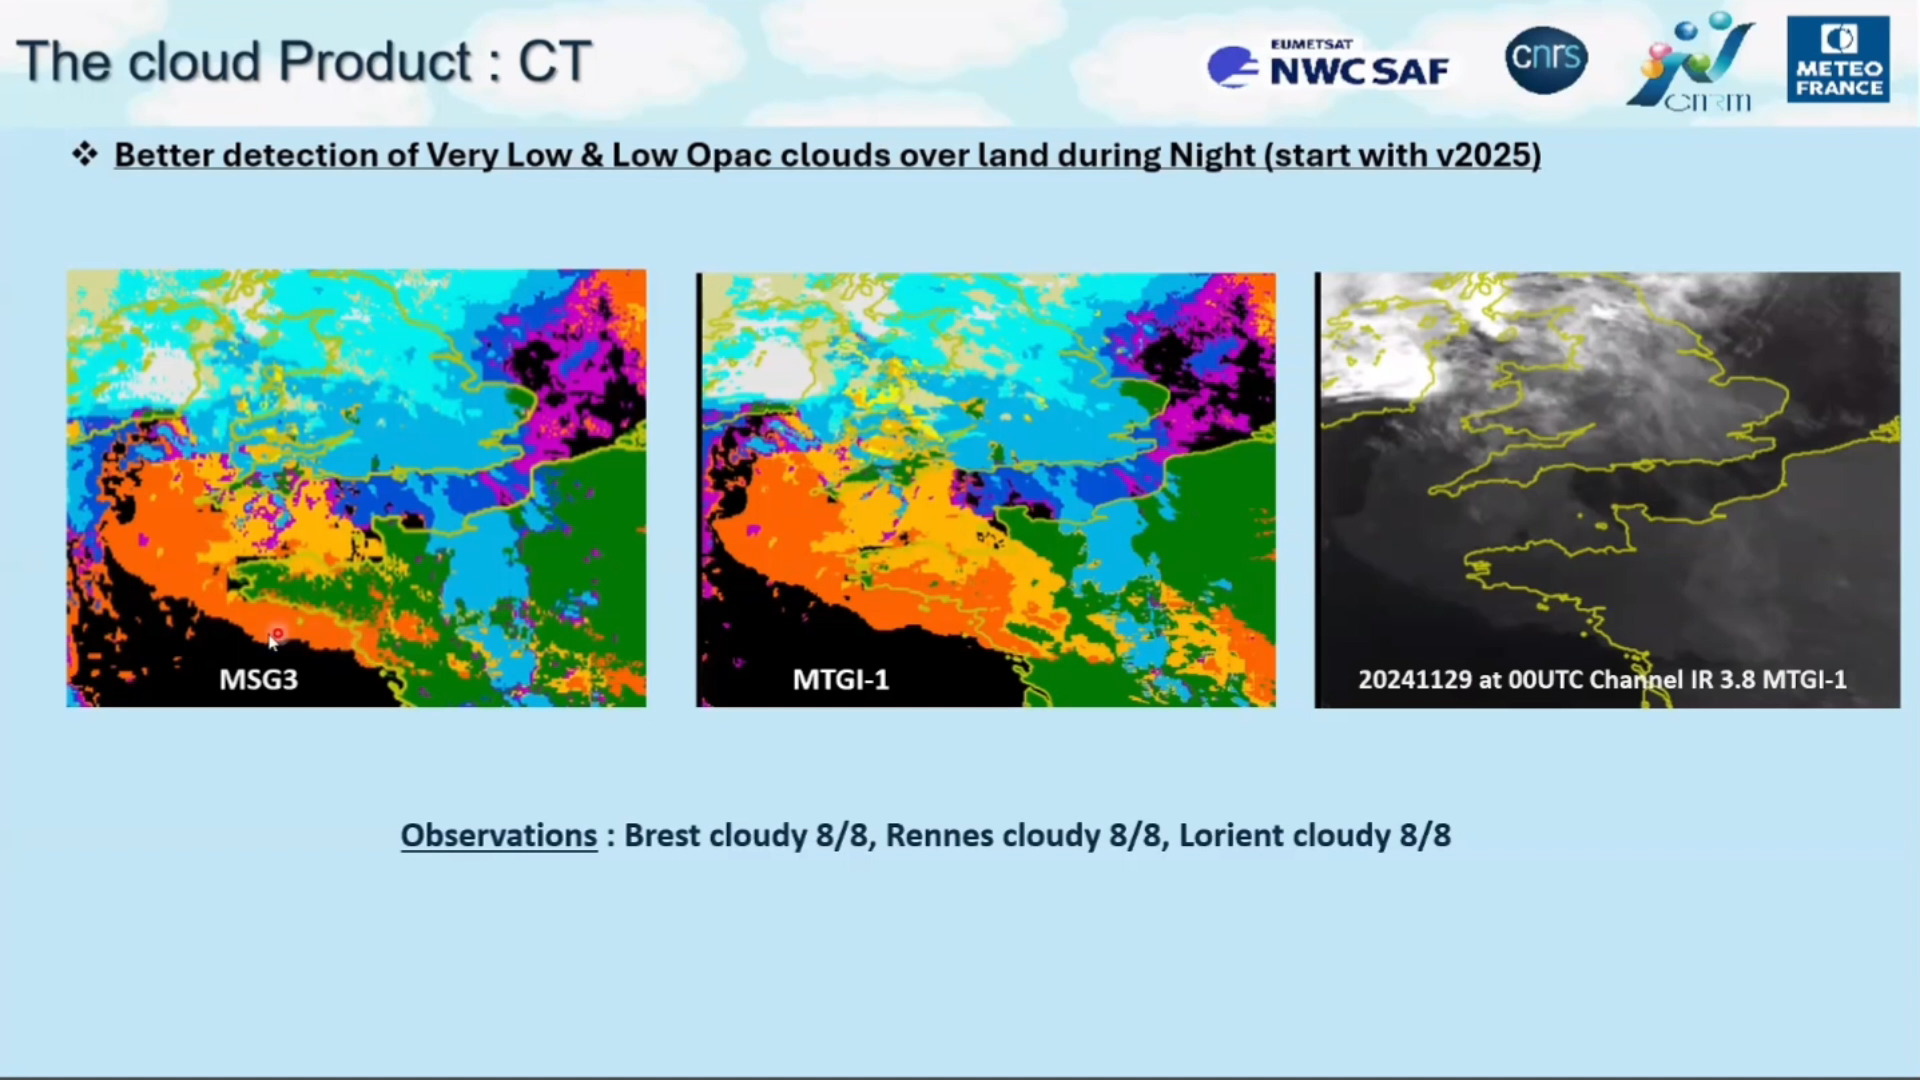
Jean Marc Moisselin and Emmanuel Fontaine talk about the benefits that MTG brings in regards to NWC SAF convection products.
Convection Initiation (CI) and Rapidly Developing Thunderstorm (RDT) are two convection products developed by Météo-France in the framework of NWCSAF. Both products fulfill requirement regarding the Day-1 MSG/MTG continuity (scores, visualization). RDT operated with MTG provides very positive features an the LI (Lightning Imager) instrument onboard MTG is very interesting and clearly add value to RDT. CI exhibits higher detection with MTG.
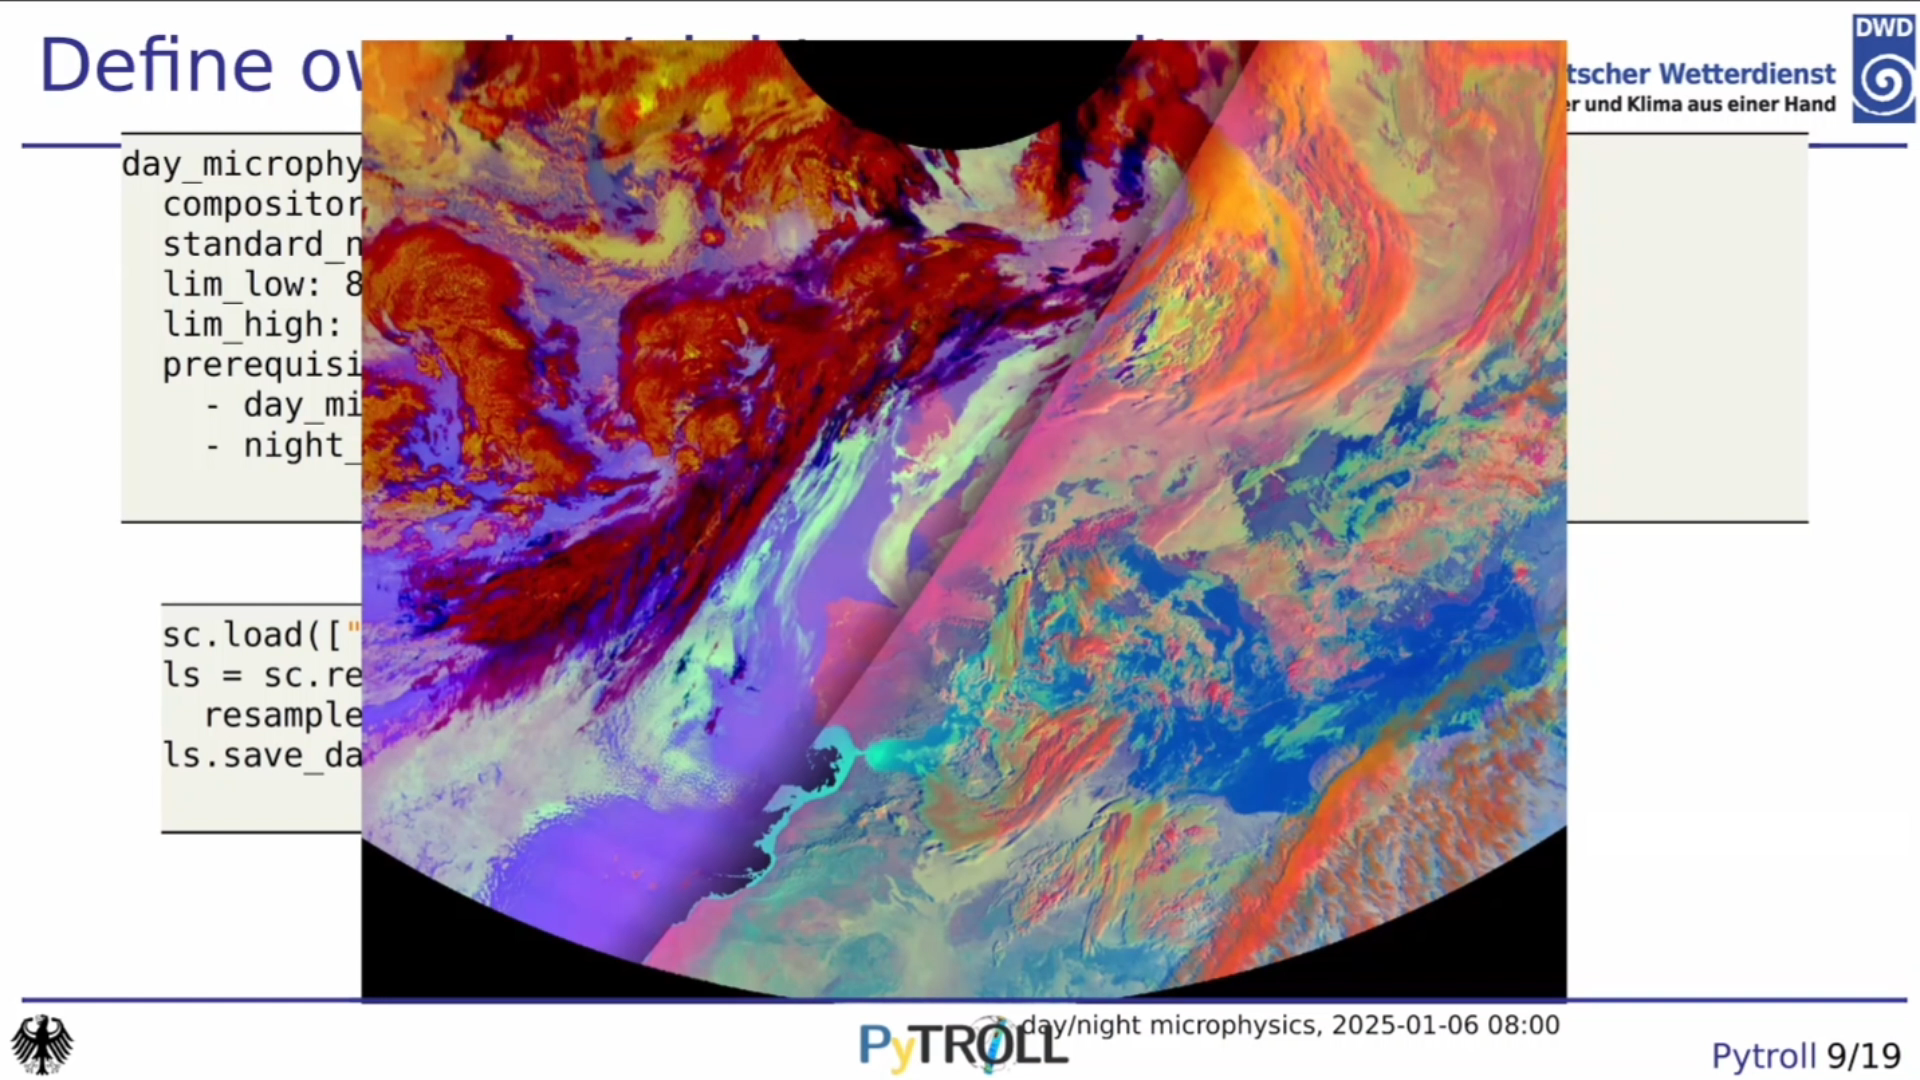
Gerrit Holl talks about Pytroll and satpy packages for visualizing MTG data within a python environment.
Pytroll is a powerful suite of packages for reading, processing, and visualising satellite data. The workhorse package, satpy, contains reading routines for many satellite data formats, including FCI level 1, FCI level 2, and LI level 2 data. In this talk, I will demonstrate how satpy can be used to process and visualise FCI and LI data programmatically. I will describe common problems and their solutions. Finally, I will briefly address how satpy can be combined with other pytroll packages for automated processing.
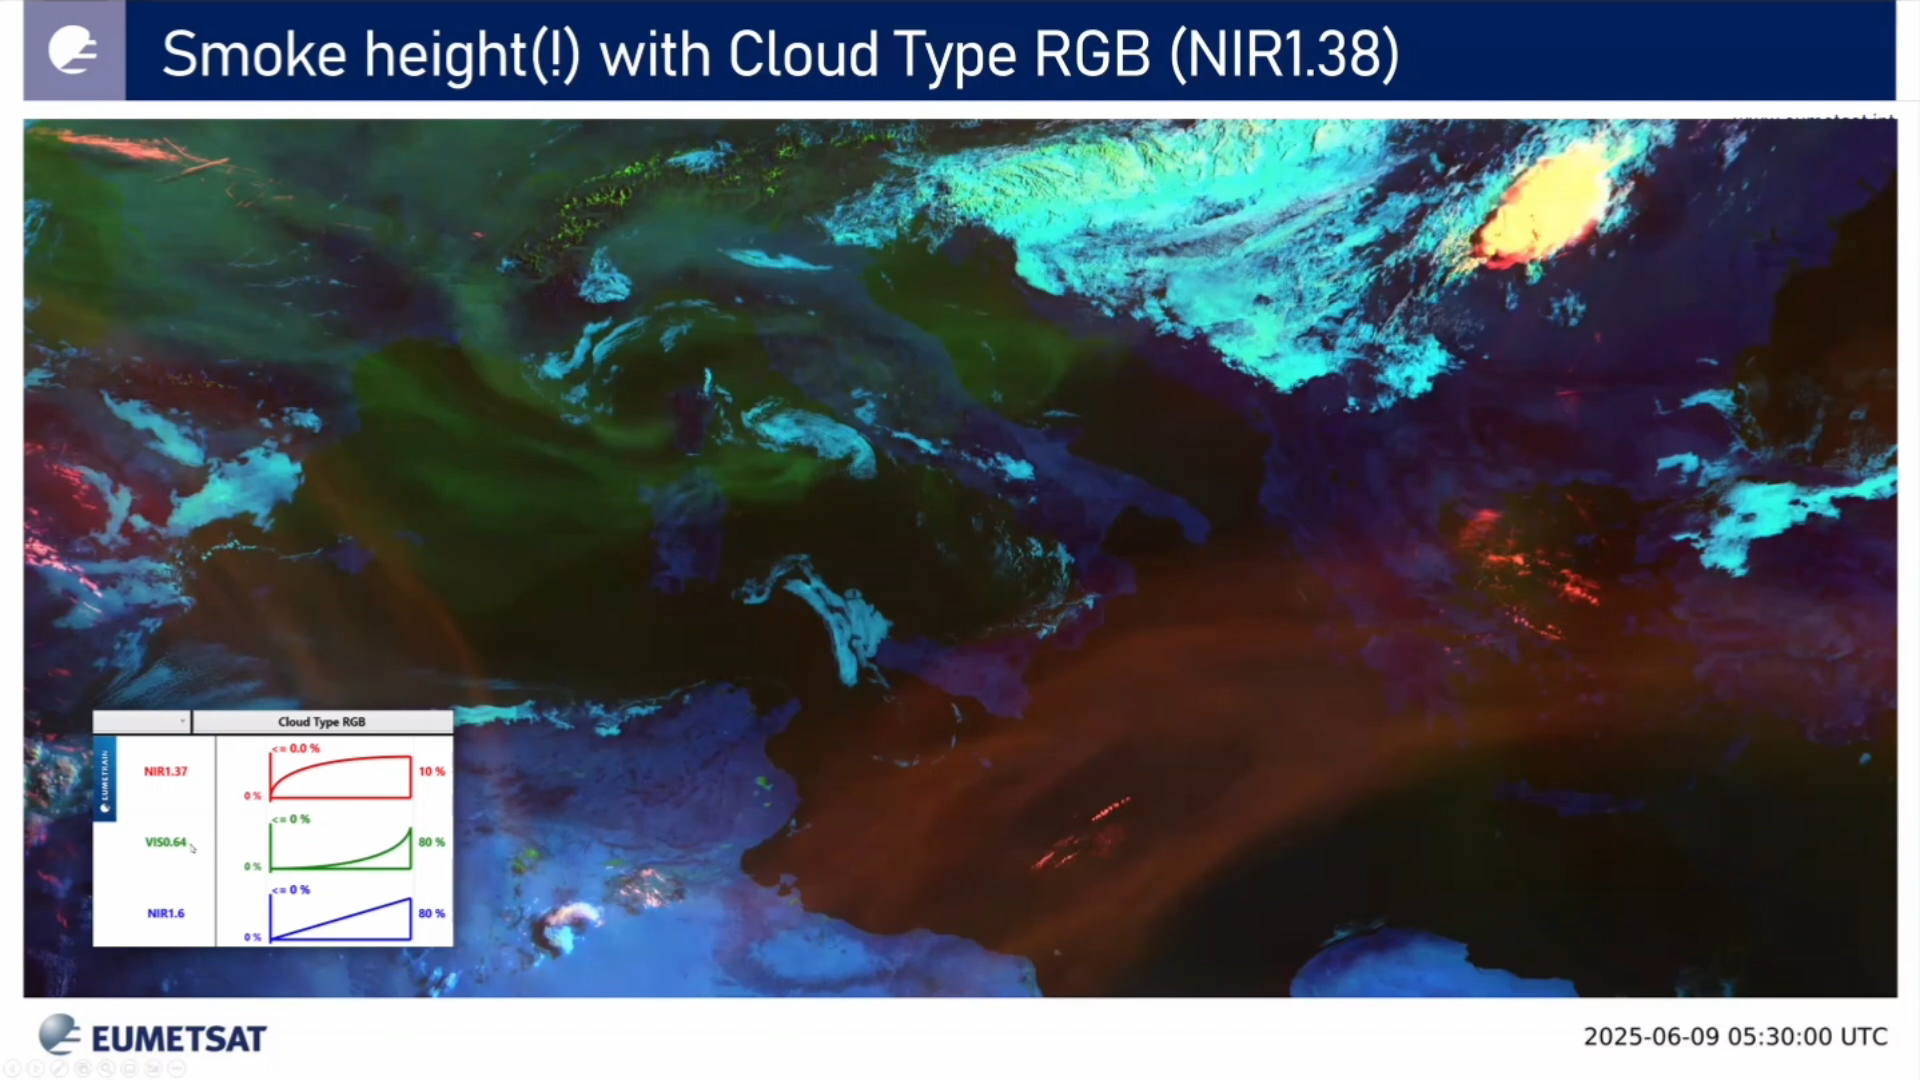
Ivan Smiljanic talks about aerosol detection with the new FCI instrument. Higher number of spectral channels coupled with increased spatial resolution make detection of aerosol better than ever.
Drawing from enhanced spectral coverage of the MTG FCI instrument (comparing with MSG SEVIRI), enhanced capabilities of aerosol detection are expected. Major improvements are during daytime related to existence of new channels with shorter wavelengths (namely VIS0.44 and VIS0.55), and to existence of new NIR1.38 that is specifically designed for detection of higher level features (including aerosols). During night time (ie 24h), enhanced spatial and radiometric resolution of IR channels offer better sensitivity to aerosols with larger particles like dust, volcanic ash or even a pollen.
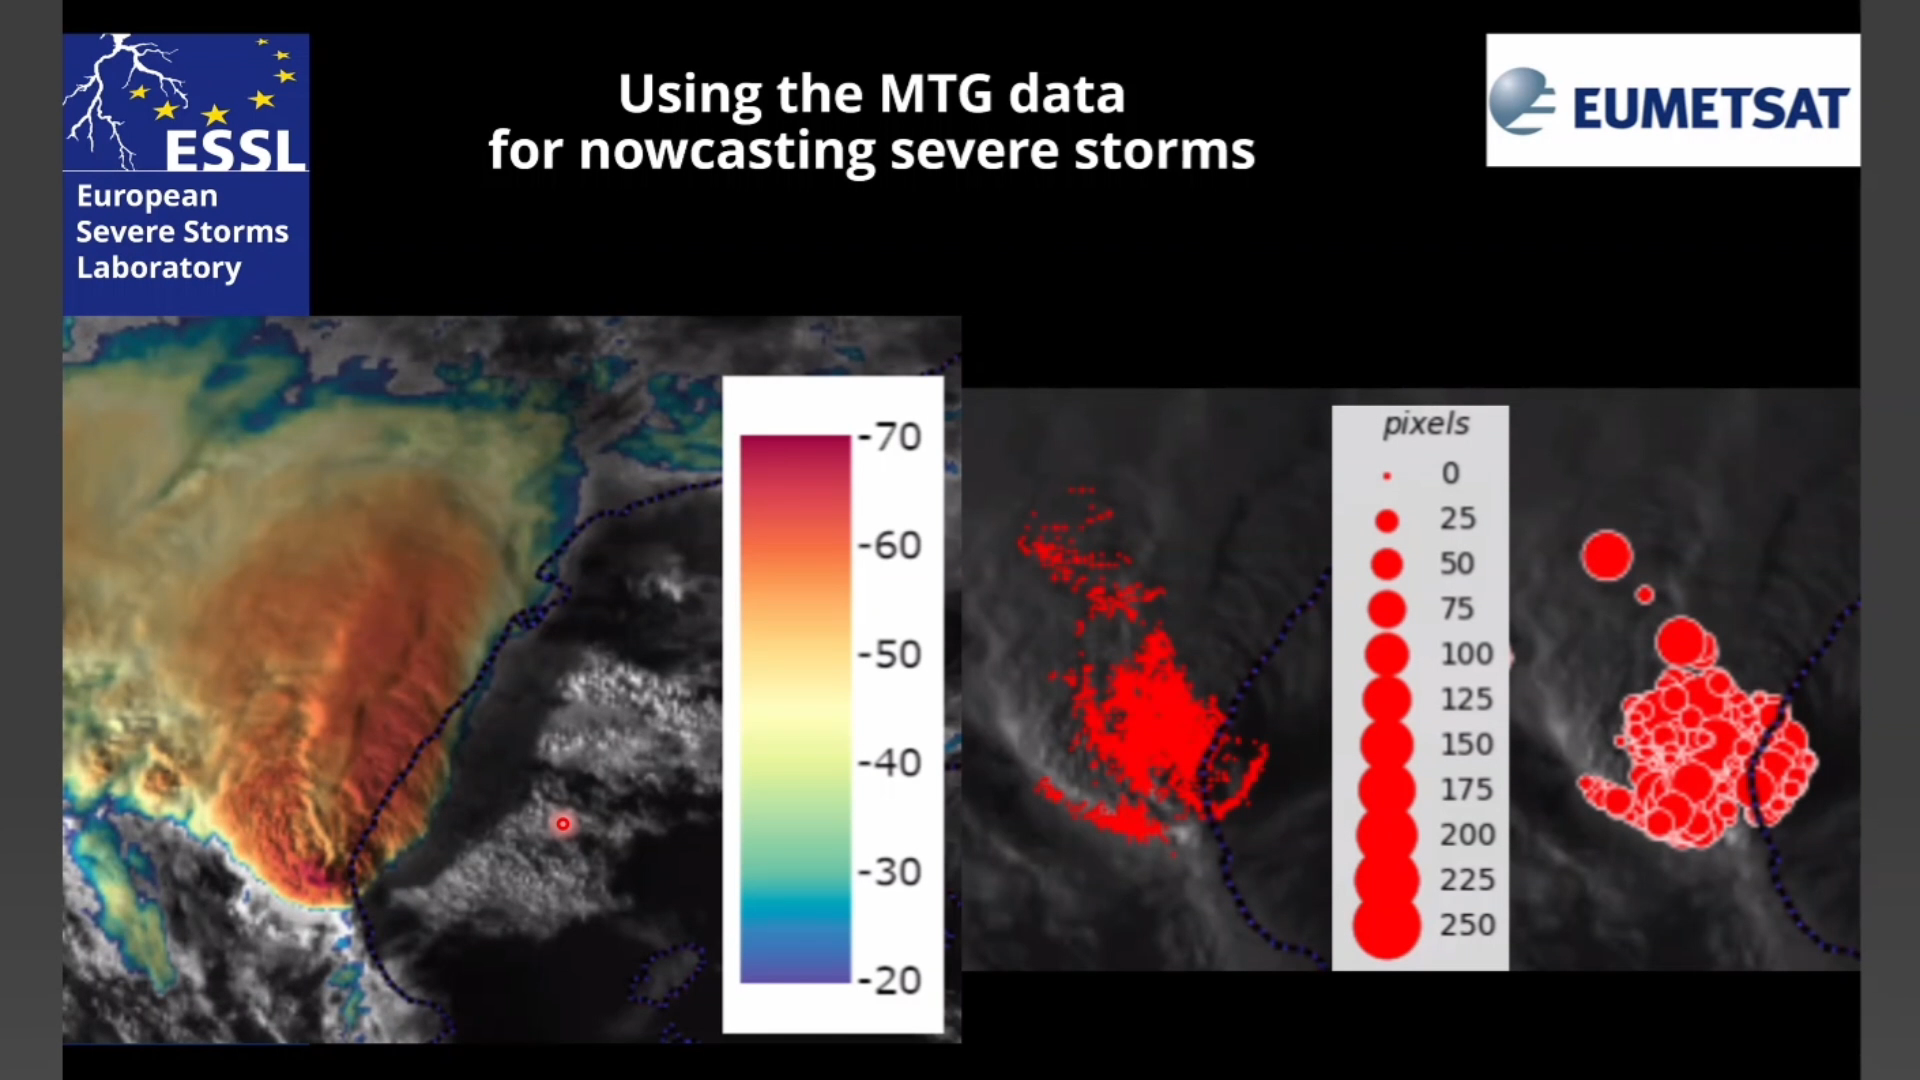
Alois Holzer talks about what MTG means for convection forecasting/nowcasting and goes over the topic of lightning imager in more detail.
MTG offers a number of both improved and new opportunities for nowcasting severe thunderstorms. For the pre-convective phase, the new 0.9 micron channel allows for the first time for a high-quality 2D visualization of total column moisture, more specifically under cloud-free daylight conditions. By looping such imagery, forecasters can follow the buildup or advection of atmospheric moisture in currently 10-minute and soon 2.5-minute steps, i.e. near real-time, which can be important information under certain weather conditions. For convection initiation, again under daylight conditions, the new Cloud Phase and Cloud Type RGBs offer a clear distinction between water droplets and ice crystals, i.e. give clear indication on the glaciation of growing cumulus clouds providing potential extra lead-time before the first lightning flash can be detected. The lightning imager (LI) will complement this information with a good ability to detect early intra-cloud lightning, typically before the first cloud to ground strike does occur for both day and night. During the mature phase of convective storms, the improved spatial (and soon also temporal) resolution of FCI compared to SEVIRI allows us much better than before to see storm-top features strongly indicative for severe convective storms – like distinct OTs and AACPs (for example in Sandwich imagery). The LI point data with its pseudo-high resolution that provides much finer data than one would expect from the nominal pixel grid (based on the principle of radiance-weighted centroids) has demonstrated to highlight especially severe hailstorms with distinctive ringlike features.
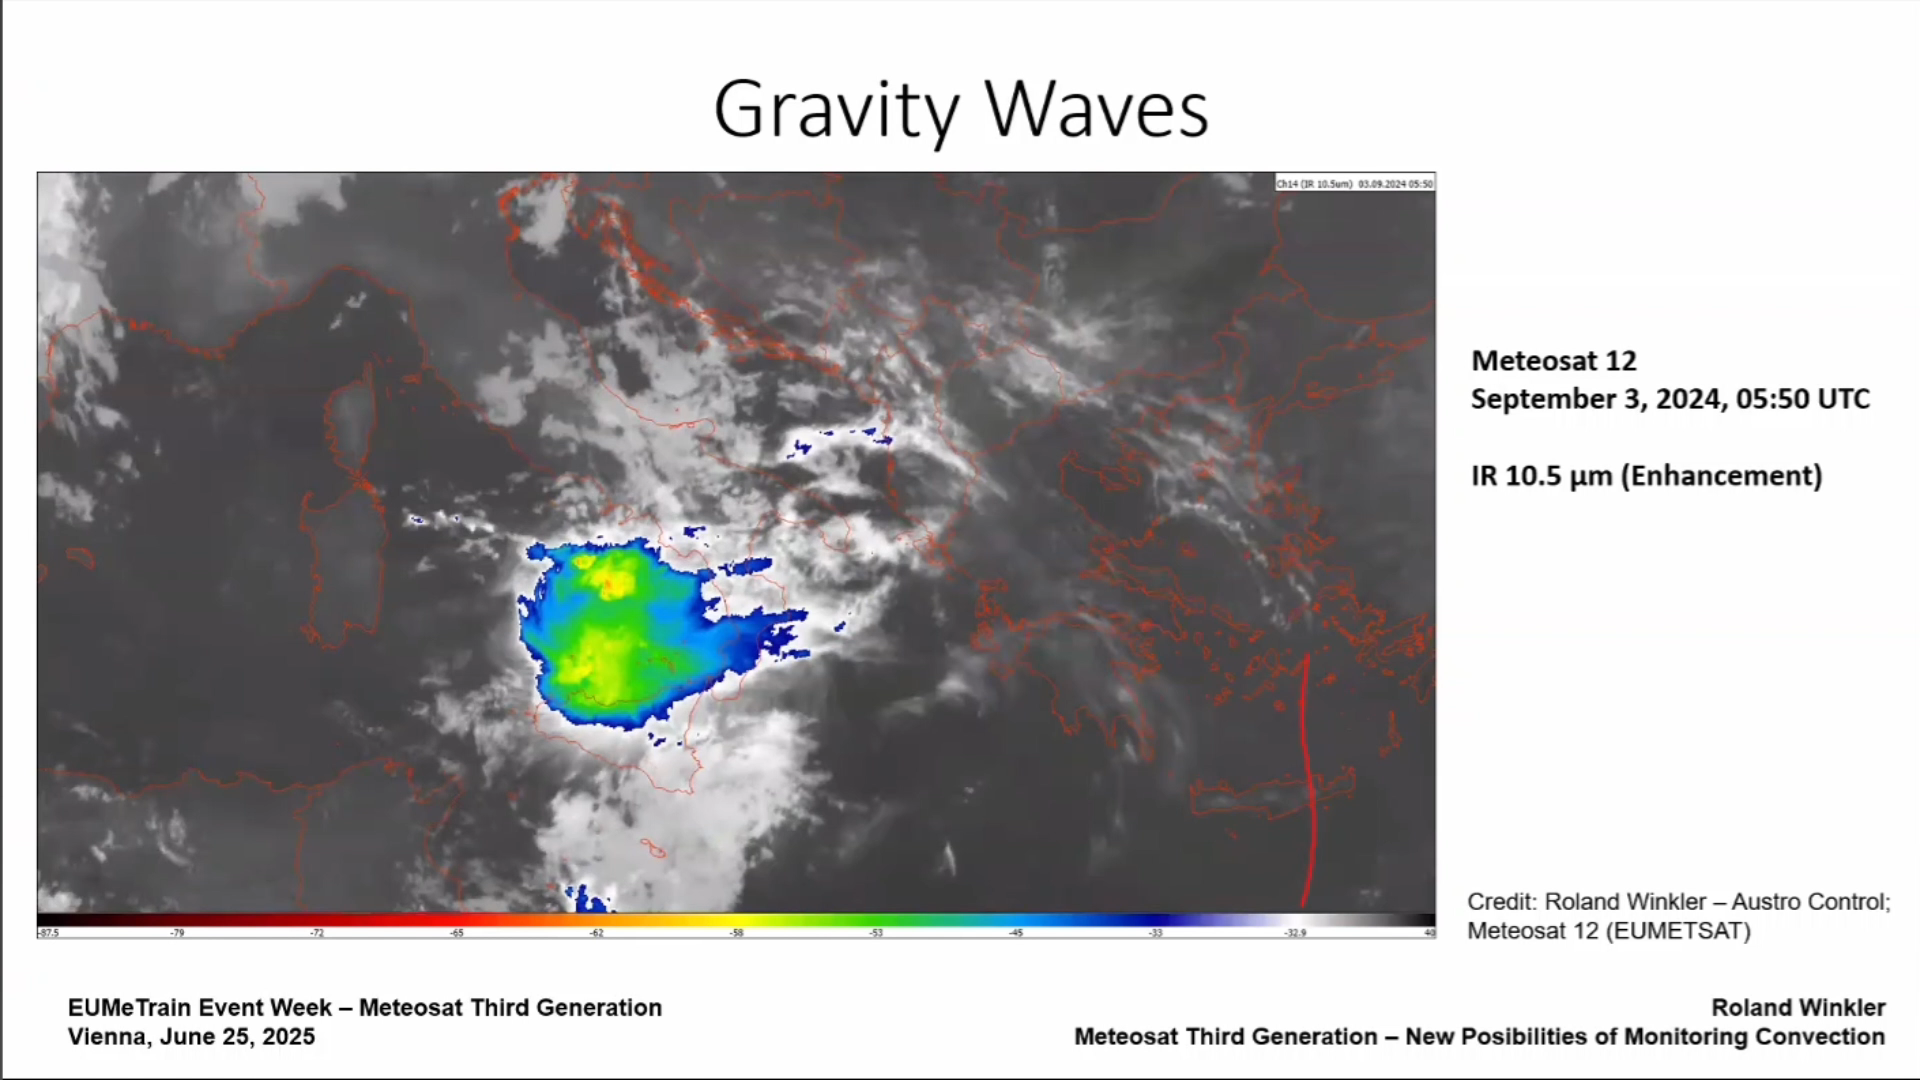
Roland Winkler shows examples of overshooting tops, gravity waves etc. using MTG FCI products.
Satellite images are now indispensable for analyzing storms and the atmospheric physical processes that emanate from them. New satellite generations, such as the third generation of European weather satellites, support this analysis with their higher spatial and temporal resolutions, as well as new spectral channels. This presentation highlights these new possibilities using examples using old and especially new spectral channels or channel combinations (RGBs and images in the blended technique).
Go to lecture slides
Andreas Wirth shows the benefits and drawbacks of new RGBs that are now possible with FCI and how to use them.
Besides better temporal and horizontal resolution, the FCI sensor on-board MTG-I also offers additional spectral bands mainly in the short infrared and visible range. These new channels were used to create RGB composite images such as the Cloud Type RGB, the Cloud Phase RGB, the Fire RGB and the True Color RGB. This presentation will highlight the benefits coming from these new RGB types. Application examples will be given and the impact of the new channels will be explained. The focus of this presentation will lay on the information provided by the new RGB types as well as on the limitations and challenges forecasters are confronted with when using them.
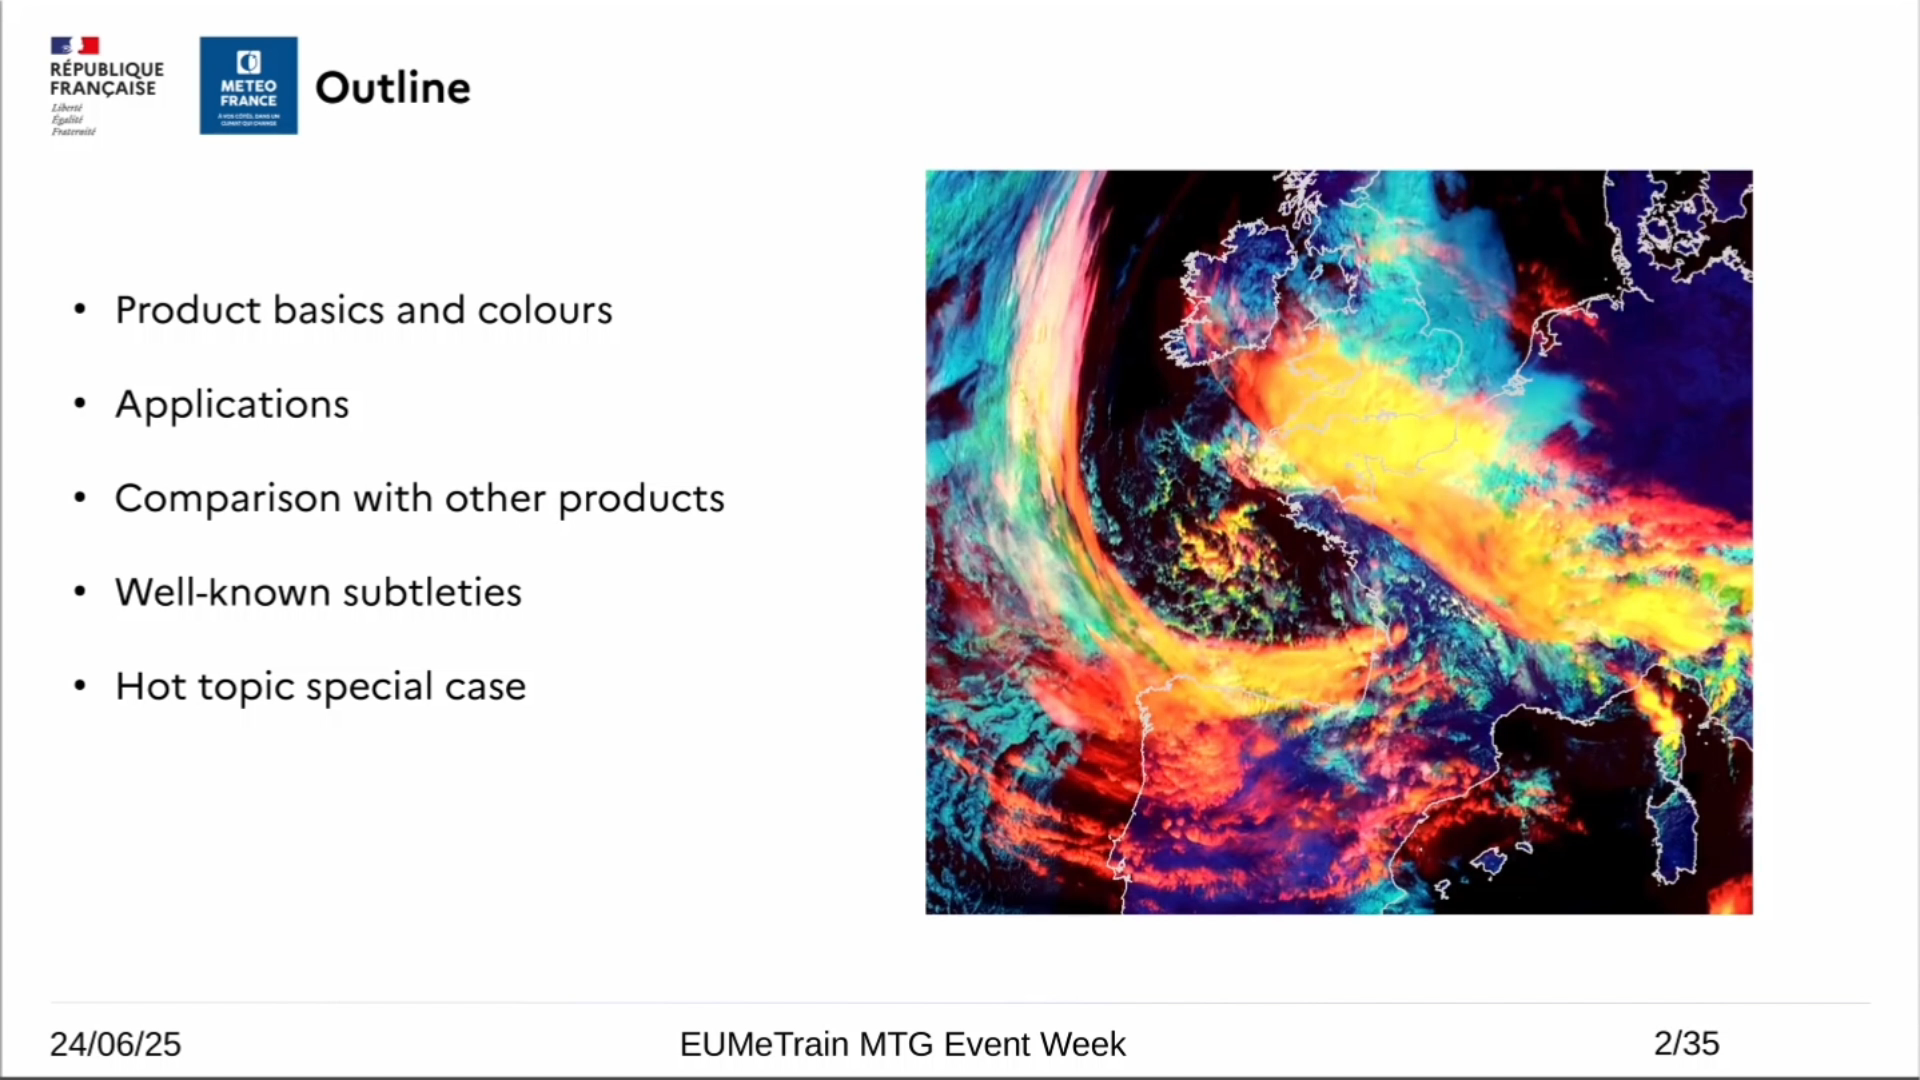
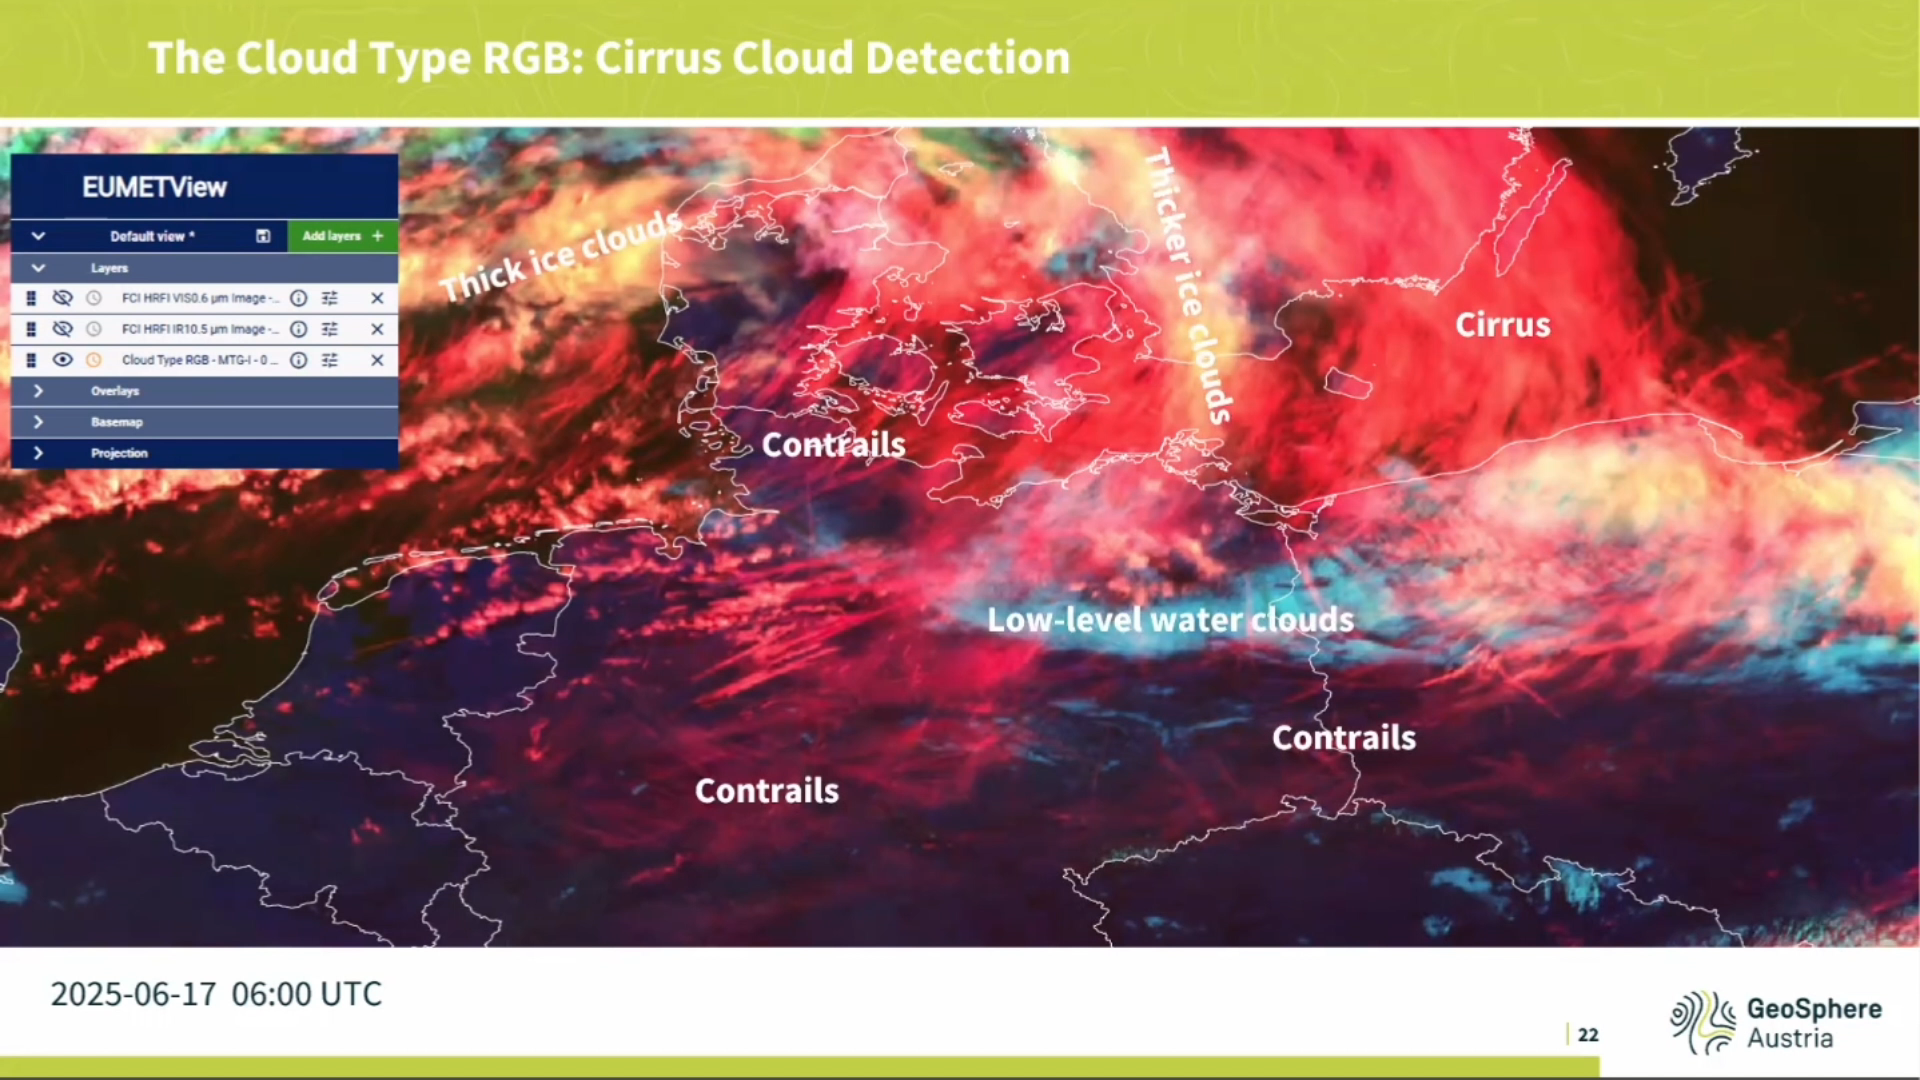
Roxane Desire gives a complete overview on the new Cloud Type RGB.
While it may seem simple to use at first glance, with its very distinctive and contrasting colors, the Cloud Type RGB product is nonetheless full of subtleties. A review of everything it is capable of and a comparison with other products.
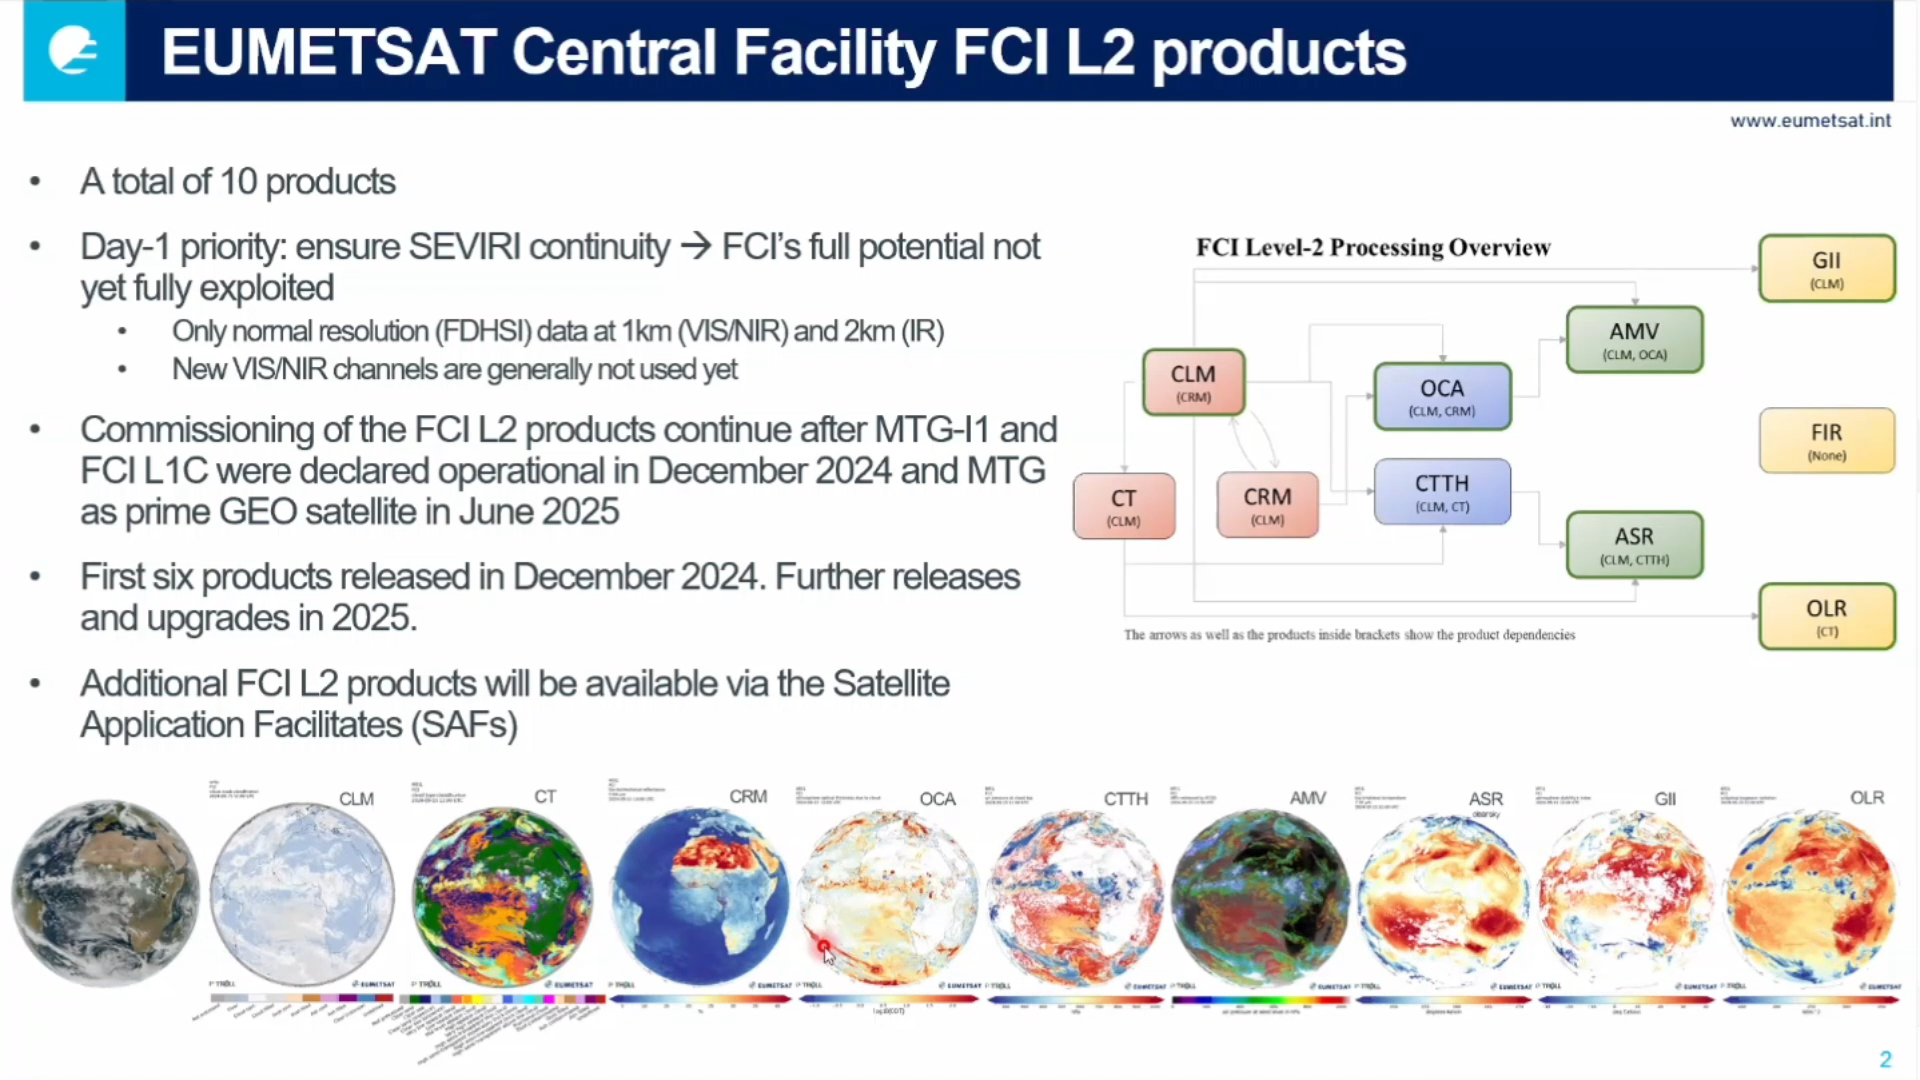
Johan Strandgren talks about the EUMETSAT Level-2 Products.
This presentation outlines the MTG-I FCI Level-2 (L2) products generated at the EUMETSAT Central Facility and disseminated to users. These products support applications such as cloud analysis, atmospheric instability, fire detection, atmospheric motion vectors, and all-sky radiances, serving data assimilation, nowcasting, and research communities. We will present early validation results from the ongoing L2 commissioning and plans for future enhancements.
Carla Barroso gives a presentation on EUMETSAT data visualization resources and repositories.
Meteosat Third Generation (MTG) imagery can be easily explored using EUMETView, EUMETSAT’s user-friendly web-based visualisation tool. Users who wish to go beyond visual inspection can access EUMETSAT's flexible portfolio of data services. One of these is the Data Store, which enables users to easily locate and download both near-real-time and historical datasets. This presentation will begin with a brief overview of EUMETView, followed by an introduction to several Jupyter notebooks designed to bridge the gap between data discovery and practical application. The first notebook focuses on the process of accessing and downloading data from the EUMETSAT Data Store, while the subsequent notebooks delve into the exploitation and visualisation of data from the Flexible Combined Imager (FCI) and the Lightning Imager (LI) sensors on board MTG.