
Satellite skills and knowledge for operational meteorologist
Listed here are other resources related to Satellite skills and knowledge for operational meteorologist tag:
Note: click on an image to open the Resource
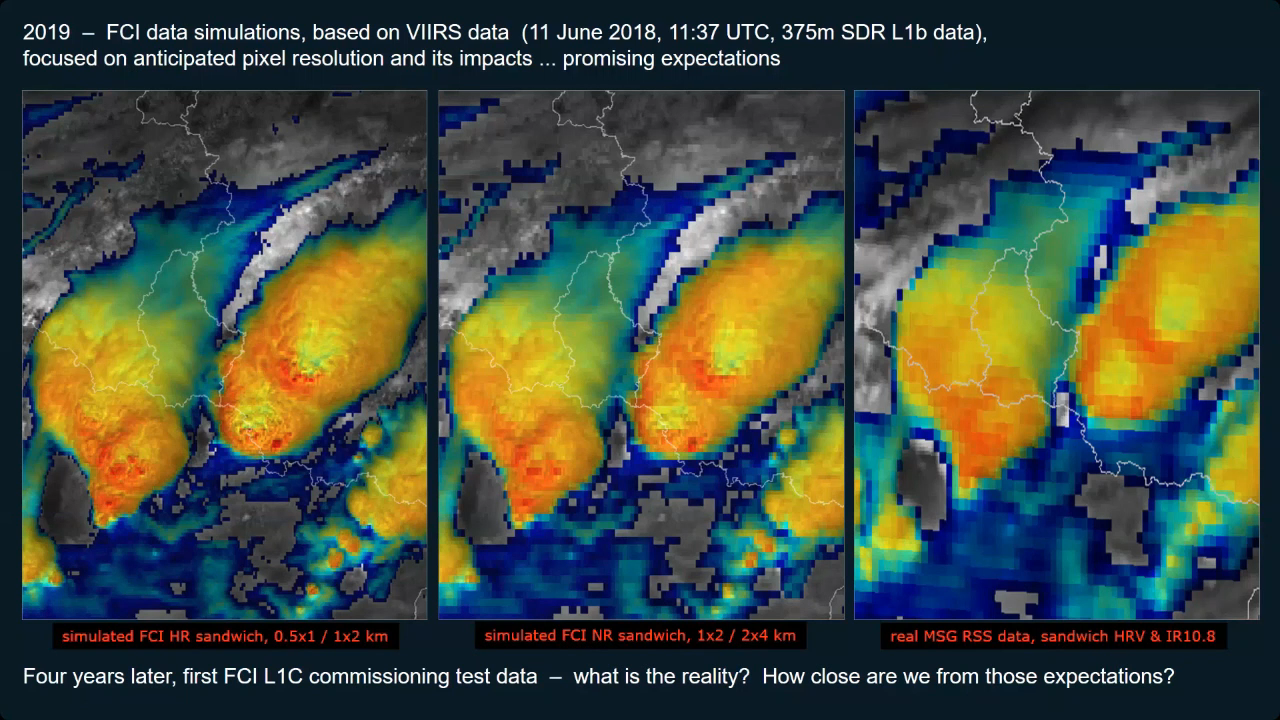
Martin Setvak demonstrates comparison between new FCI data with MSG and VIIRS, focusing on convective storms.
The presentation will address preliminary comparison of the MTG-I1 FCI imagery (based on FCI commissioning data) with MSG SEVIRI and NPP/JPSS VIIRS data, with focus on convective storms.
Cloud Phase RGB is a new product for European users of GEO satellite data, which can be constructed using data from the Flexible Combined Imager (FCI) on the Meteosat Third Generation (MTG) satellite system. The aim of this RGB is to provide improved microphysical information on cloud tops, in particular discrimination between thick water clouds and thick ice clouds, and cloud top particle size.
This extended guide is about the Cloud Phase RGB, a new product for European users of GEO satellite data, which can be constructed using data from the Flexible Combined Imager (FCI) on the Meteosat Third Generation (MTG) satellite system. It uses one of the new FCI channels, not available with the SEVIRI instrument. This document is an extended guide discussing its characteristics in detail; a quick guide is also available on the EUMeTrain webpage. In this guide, the imagers of Japanese and American geostationary satellites (Himawari/AHI and GOES/ABI) and polar satellites (NPP and NOAA-20/VIIRS) are used to provide proxy data for the FCI.
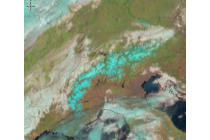
Learn how to detect areas covered with snow, ice or cloudy areas.
In this module you will be able to identify geographical features and surface characteristics and conditions through images and satellite products. Although surface features are not the main purpose of meteorological forecasting, being able to identify and distinguish them from atmospheric features can be useful.
To access the resource click here.
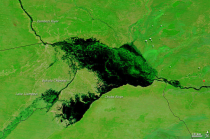
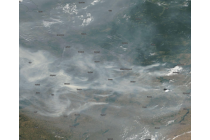
Learn how to recognize areas of flooding.
In this module you will be able to identify geographical features and surface characteristics and conditions through images and satellite products. Although surface features are not the main purpose of meteorological forecasting, being able to identify and distinguish them from atmospheric features can be useful.
To access the resource click here.
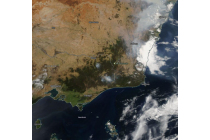
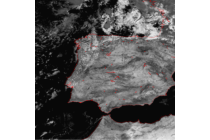
Learn how to recognize burnt areas.
In this module you will be able to identify geographical features and surface characteristics and conditions through images and satellite products. Although surface features are not the main purpose of meteorological forecasting, being able to identify and distinguish them from atmospheric features can be useful.
To access the resource click here.
Learn how to identify hotspots.
In this module you will be able to identify geographical features and surface characteristics and conditions through images and satellite products. Although surface features are not the main purpose of meteorological forecasting, being able to identify and distinguish them from atmospheric features can be useful.
To access the resource click here.
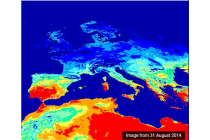
Learn how to identify areas of drought and heatwaves.
In this module you will be able to identify geographical features and surface characteristics and conditions through images and satellite products. Although surface features are not the main purpose of meteorological forecasting, being able to identify and distinguish them from atmospheric features can be useful.
To access the resource click here.
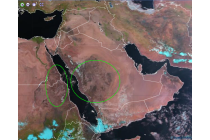
Learn how to identify vegetation free areas as well as how to identify different types of desert surface such as sand or desert pavement.
In this module you will be able to identify geographical features and surface characteristics and conditions through images and satellite products. Although surface features are not the main purpose of meteorological forecasting, being able to identify and distinguish them from atmospheric features can be useful.
To access the resource click here.
Learn how to distinguish between natural and human modified areas.
In this module you will be able to identify geographical features and surface characteristics and conditions through images and satellite products. Although surface features are not the main purpose of meteorological forecasting, being able to identify and distinguish them from atmospheric features can be useful.
To access the resource click here.
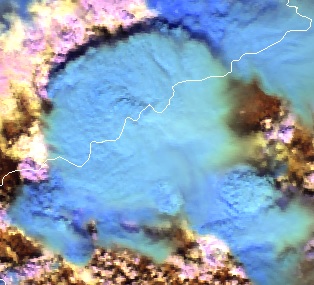
Learn how to discriminate between land and areas of water like oceans, seas, lakes, rivers or inlets.
In this module you will be able to identify geographical features and surface characteristics and conditions through images and satellite products. Although surface features are not the main purpose of meteorological forecasting, being able to identify and distinguish them from atmospheric features can be useful.
To access the resource click here.
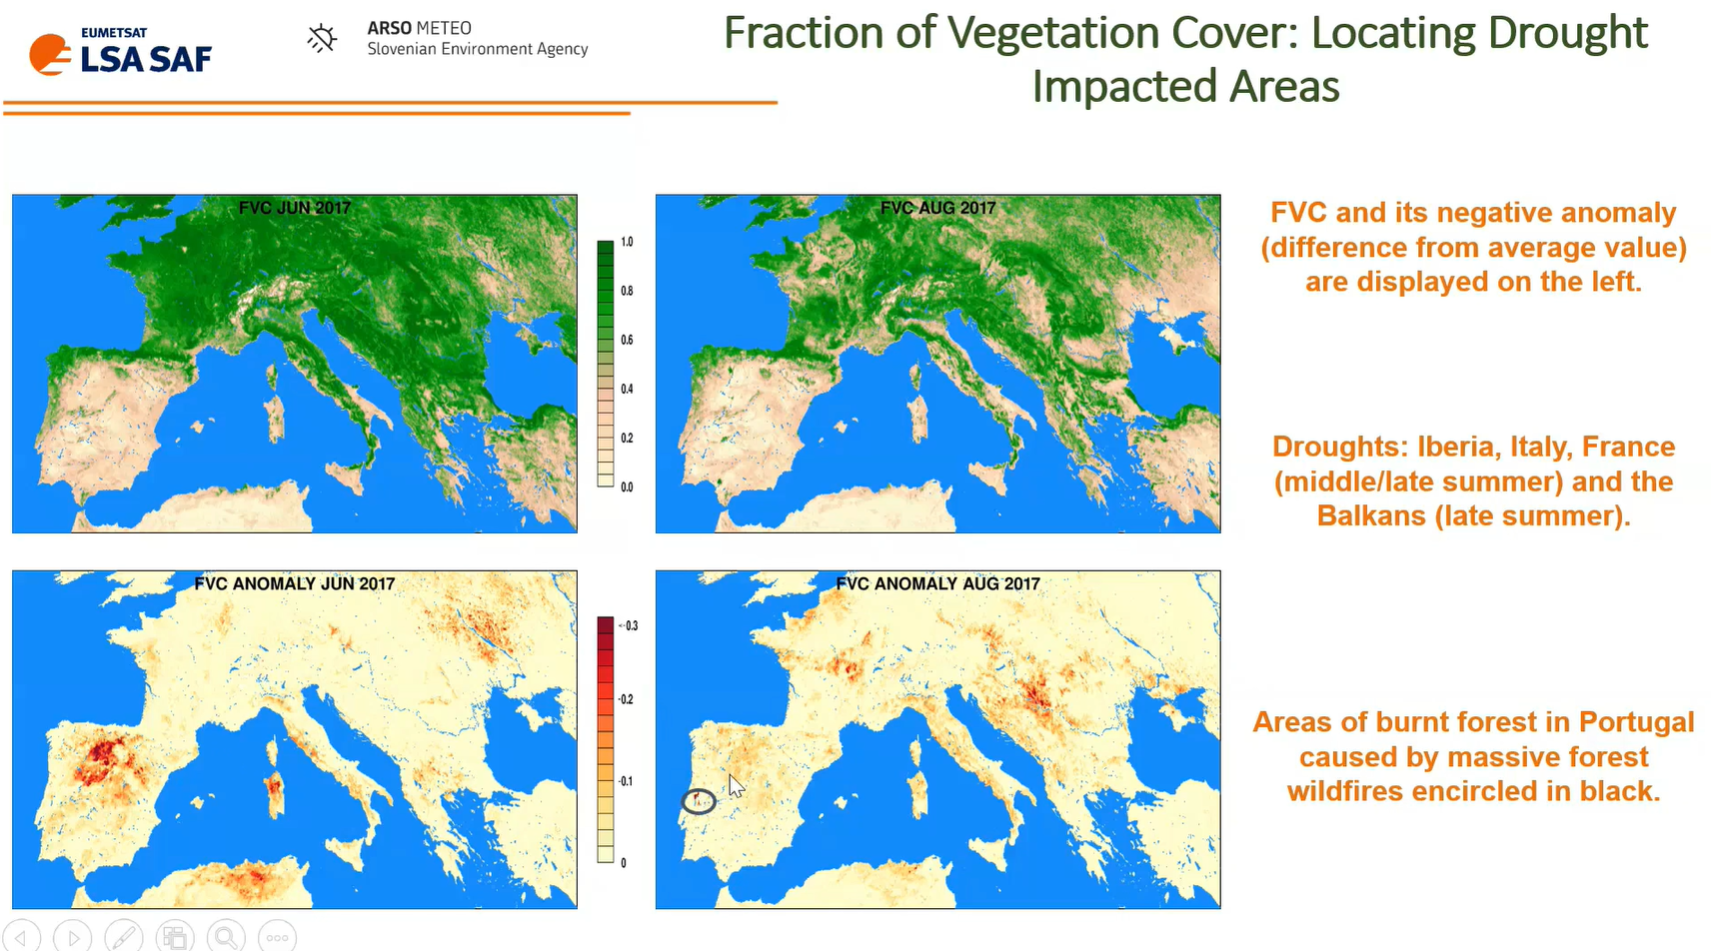
Bostjan Muri talks about using LSA SAF data and vegetation anomalies for drought monitoring.
In this presentation, we explore numerous real world applications of the use of LSA SAF data. Our focus is identifying heatwaves and droughts based on satellite data. Vegetation anomalies can be particularly helpful for drought monitoring. These show cases are selected in order to highlight the benefits of specific applications using LSA SAF data and its added-value when compared with other existing sources of observations (either satellite or meteorological stations) as well as model output.
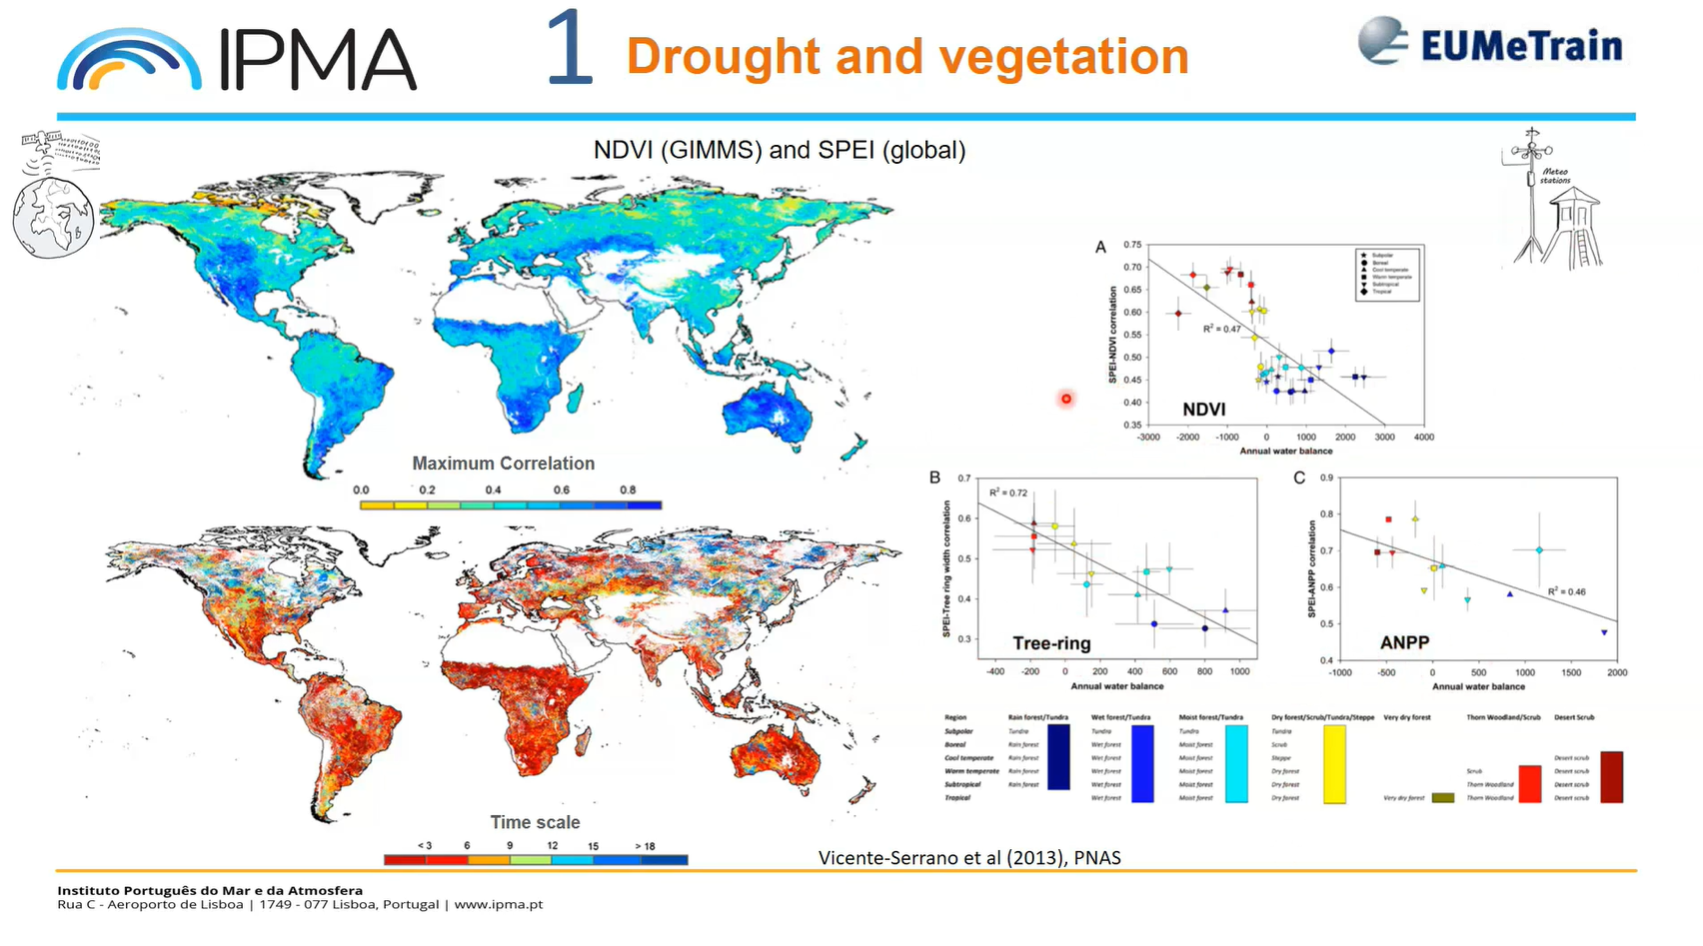
Célia Gouveia presents about heatwave and drought impacts on crops and vegetation.
The frequency and intensity of extreme hot and dry events have increased worldwide, particularly over the past couple of decades. The interaction between co-occurring drought and hot conditions is often particularly damaging to vegetation and crop's health and may cause crop failure. This lecture will provide insights on the impacts of compounded and separated dry and hot extremes on vegetation activity, and crop production and yield. Examples of the detection, monitoring and evaluation of such impacts using remote sensing products will be shown.