
Weather
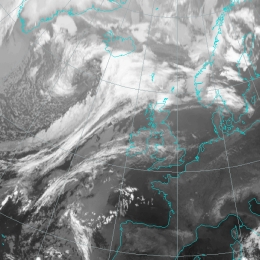
A Split Front is very similar to a Cold Front cloud band but shows a distinct double structure with cold (high) tops at the leading and warm (low) tops to the rear.
A Split Front is accompanied by a cyclonically curved cloud band, which, contrary to a classical Cold Front, contains a distinct double banded structure with cold cloud top temperatures at the leading edge and warmer cloud top temperatures at the rear edge. The conceptual model of a Split Front is strongly associated with jet streaks and sinking of very dry stratospheric air. The initial stage of a Split Front is generally an Ana Cold Front type. In contrast to the Ana Cold Front, the Warm Conveyor Belt is overrun aloft by the relative stream of the dry intrusion. This process takes place as the warm air ascends ahead of the surface cold front with a forward component relative to the frontal system.
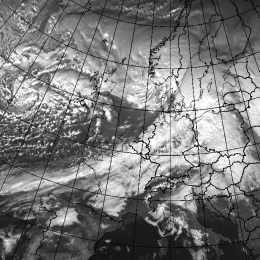
Cloud bands of Cold Fronts in Cold Advection are very similar to those of Cold Fronts, but because of their relationship with temperature advection, they are often weaker and have a higher tendency for weakening.
Usually Cold Fronts are associated with cold advection behind the frontal zone and warm advection ahead of it, but sometimes the whole front is under cold advection. These are called Cold Fronts in Cold Advection. Cold Fronts in Cold Advection form mostly over the Atlantic, and are more common in the winter than during the summer season. The stage of Cold Fronts in CA last generally 0,5-2 days. In the earlier stages there is often a significant dark stripe behind the front due to the very cold dry air.
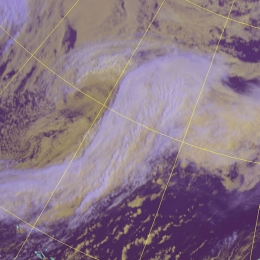
Cold Fronts are accompanied by synoptic scale multilayered cloud bands.
Fronts generally form within a baroclinic boundary between cold and warm air masses. The main physical process for the development of Cold Fronts is the movement of the cold air against warm air. The warm air ascends along the boundary while the cold air sinks below it. If there is enough humidity, the upward motion leads to condensation and to the development of clouds and precipitation. Cold Fronts can be devided into two types: Ana and Kata Cold Fronts. The main feature which separates the different types of Cold Front is the orientation of the jet relative to the front in the middle and upper levels of the troposphere. It is generally considered that a Kata Cold Front evolves from an Ana Cold Front. As baroclinic disturbances often develop over the Atlantic, the newly developed Ana Fronts can mainly be found there, whereas older, continental fronts are mostly Kata type. Another reason for the spatial differences might be that the lower parts of the front are decelerated due to the friction of the continent, while the upper parts continue with higher speed.
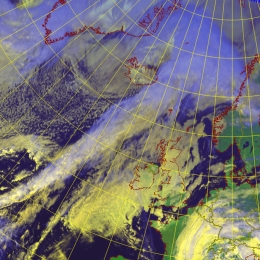
A CCB Occlusion is accompanied by a distinct cloud spiral; the cloud of the CCB Occlusion protrudes below the WF-CF cloud band and has lower tops.
An occlusion cold conveyor belt is characterized by a lower ceiling in comparison to the corresponding frontal system. In satellite imageries this lower cloudiness seems to be separated to the frontal cloud band. This is a result of the cold conveyor belt that transports cold sinking air into that region. Additionally the jet crosses the boundary between frontal system and the occlusion which is in contrast to general frontal systems. In consequence in the area of the occlusion the upper leves are rather dry (dry intrustion) due to sinking of dry, stratospheric air masses. This is the second reason why the occlusion cold conveyor belt appears in darker shades of grey than the corresponding frontal system.
Mahmood Al-Khayari gives an overview of typical weather situations in the Sultanate of Oman.
Length: 30 min
Author: Mahmood Al-Khayari
Mahmood Al-Khayari graduated at Saint Louis University (Missouri State), USA, with BS in meteorology in 2003. He is also holding MS in an engineering field from Sultan Qaboos University. Mahmood Al-Khayari works at Oman Met Service since Feb 2004 until now as meteorologist specialized in forecasting. He has done different kinds of forecasting: General, Aviation and Marine. Also he worked as a lecturer during this period in many courses such as: Met Technician course, aviation courses for Royal Force courses, marine courses for Oman Royal Navy, and many others. Mahmood Al-Khayari was recently selected to take care of the chief's duties of Remote sensing and research section.
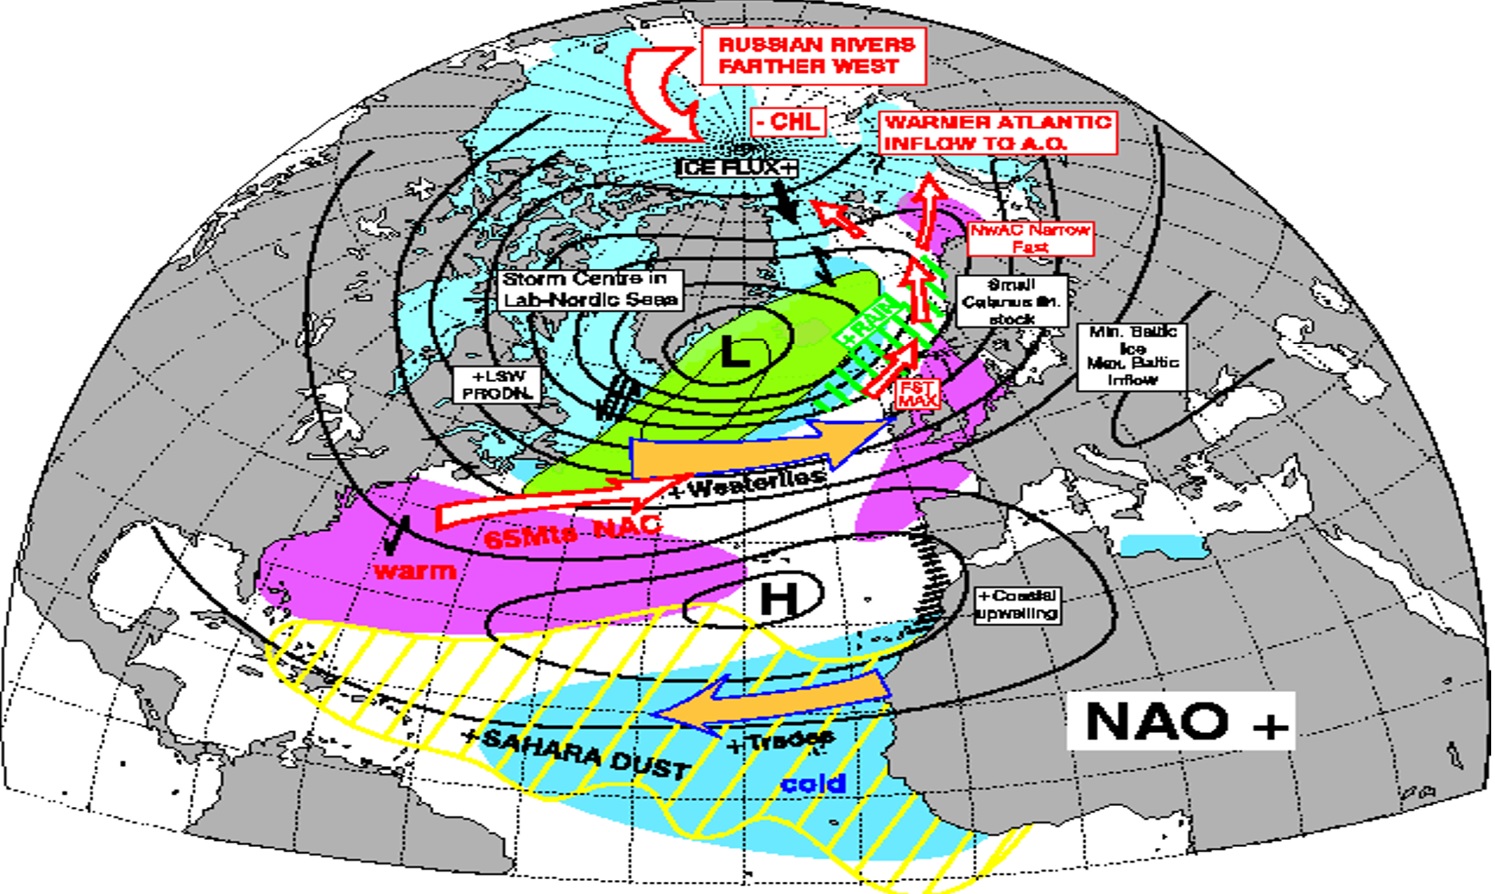
Humberto Barbosa focusses in his weather briefing on climate variability and teleconnection processes. He explains how weather anomalies like El Nino affect distant regions.
Length: 55 min
Author: Humberto Barbosa
Humberto A. Barbosa received his BS in Meteorology at the University Federal of Campina Grande (1995), and his MS in Remote Sensing from the Brazilian Institute for Spatial Research (INPE) – São José dos Campos (1998) and his PhD in Soil, Water and Environmental Sciences from the University of Arizona – Tucson (2004). Currently, he is an adjunct professor III of the Federal University of Alagoas. He has experience in the area of Geosciences, with emphasis in Climatology, concentrating mainly on the following subjects: interactions atmosphere-biosphere, satellite- and ground-based remote sensing of agricultural and environmental areas for extraction of soil and vegetation biophysical parameters and remote sensing techniques.
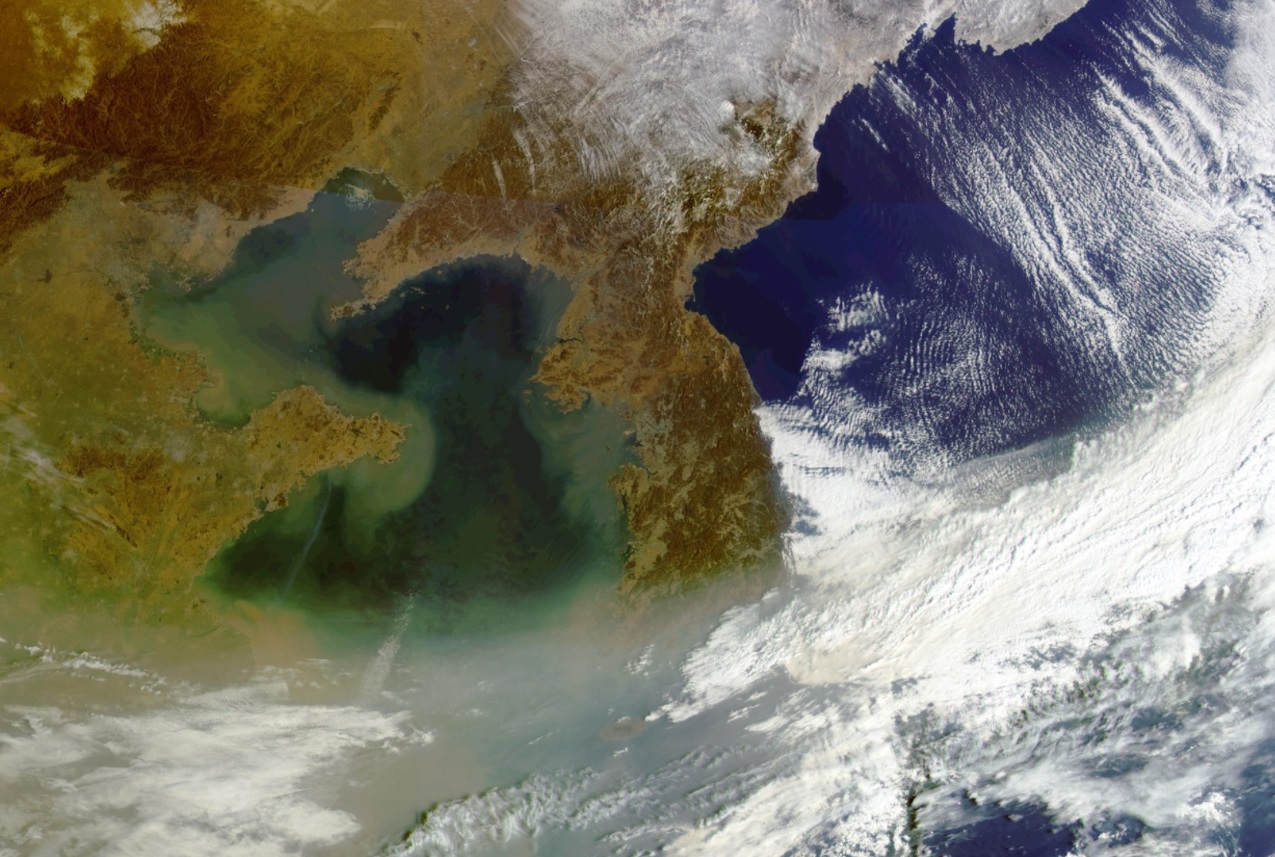
Ok Hee Kim holds the weather briefing for the South Korean region. Her topics are: Asian Dust, Typhoons and typical weather phenomena in East Asia.
Length: 50 min
Author: Ok Hee Kim
Ok Hee received her BSc in Astronomy at the Chungbuk National University at Chungchungbukdo the province of South Korea (1992), and MSc in Meteorology from the Seoul National University in Seoul South Korea (2004). She is preparing for the PhD. Her areas of interest include severe weather, lake-effect snow, Asian dust, fog and applications of satellite imagery to weather forecasting, particularly on the mesoscale. She worked at weather forecasting division as assistant for weather forecaster for 3 years from 1992 and satellite image analyst 3 years from 1996. She has been a research associate at NMSC (National Meteorological Satellite Center) KMA (Korea Meteorological Administration) since 2006. She is currently working as a meteorological satellite image trainer and analyzer of COMS (Communication Ocean Meteorological Satellite) image for KMA's weather forecaster in NMSC. Presently, she is trying to develop Conceptual Models which are applicated in East Asia after training SATREP in ZAMG.
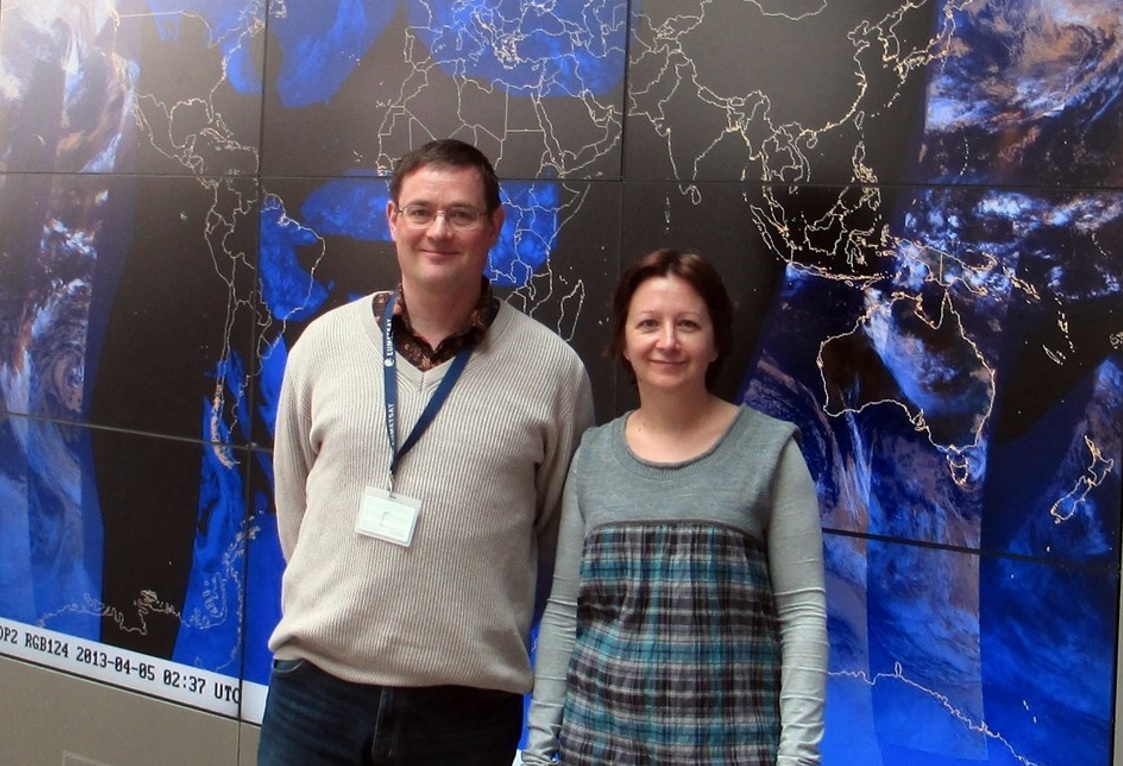
Vesa Nietosvaara and Larisa Nikitina give a weather briefing for the European region, Larisa focusses on the preparations for the 2014 Olympic Games in Sochi.
Length: 55 min
Author: Vesa Nietosvaara, Larisa Nikitina
Vesa Nietosvaara has worked as an operational weather forecaster for twenty years in 1988-2008. Since 1998 Vesa has been working within several training projects and created learning resources for operational meteorologists. Particularly, he is interested in satellite image interpretation and conceptual models for weather diagnosis. Most of his career Vesa has done at the Finnish Meteorological Institute, but since 2012 he works as a Training Officer at EUMETSAT. He assists the EUMeTrain monthly weather briefing team and regularly participates or lead the European online weather briefings (ePort weather briefings).
Larisa (Lara) Nikitina has been working as aviation weather forecaster in Rostov aviation center (Rostov-on-Don, south Russia) since 1985 after training as a weather forecaster in Russian State Hydrometeorological University (RSHU). And since 2010 she became the weather forecaster for Sochi 2014 Winter Olympics. Her special interests are the satellite meteorology applications for nowcasting and distance learning.
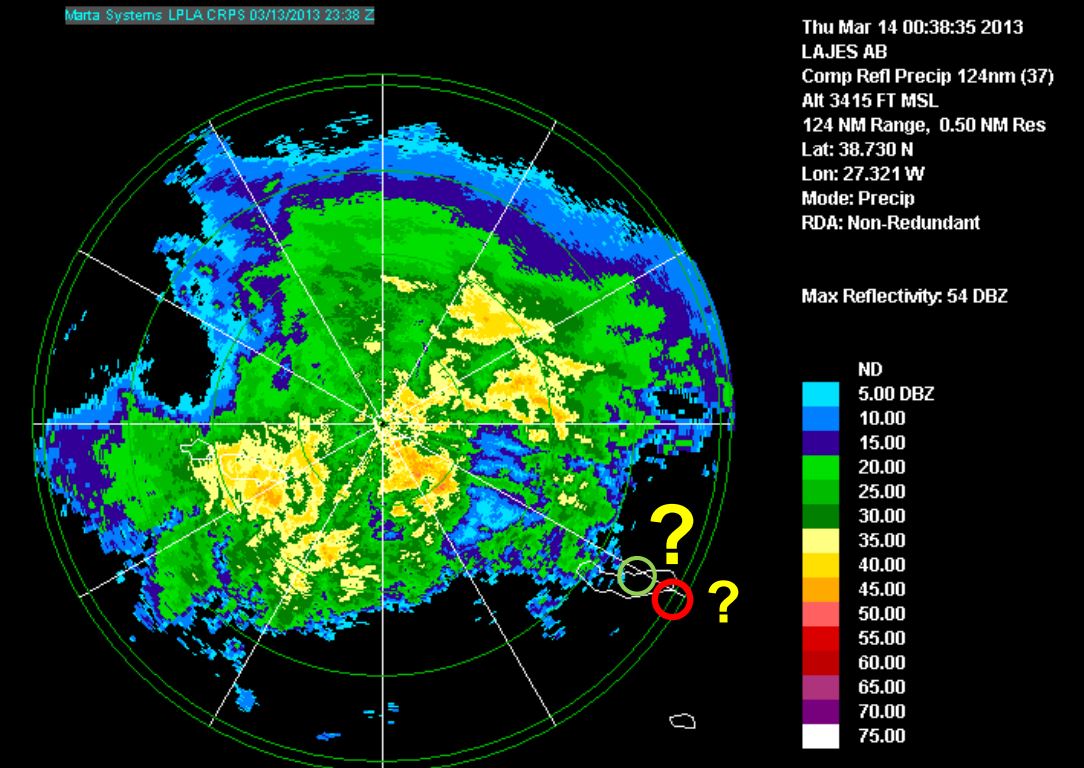
Diamantino Henriques gives a weather briefing for the Azores and looks back to the heavy rain event on 13th and 14th March 2013.
Length: 30 min
Author: Diamantino Henriques
Diamantino Henriques, received his degree in Atmospheric Physics at the University of Aveiro (1986) and his MS in Meteorology from the University of Lisboa (1996). From 1987 to 2003 he worked in Lisbon as meteorologist on atmospheric ozone and UV radiation issues. He has represented Portugal on several international meetings related with atmospheric composition and has participated in several projects and programs related with atmospheric ozone (GAW), atmospheric pollutants transport (EMEP) and UV radiation (EDUCE). In 2003 he moves to the Azores and worked at Ponta Delgada Airport as a senior meteorologist and forecaster. Later in 2008 he was nominated Head of the Regional Delegation of the Portuguese Institute of Meteorology (IM) in the Azores. Currently, he is the Head of the Azores Regional Delegation of the Portuguese Sea and Atmosphere Institute (IPMA, former IM) that includes the weather forecast service for the Azores.
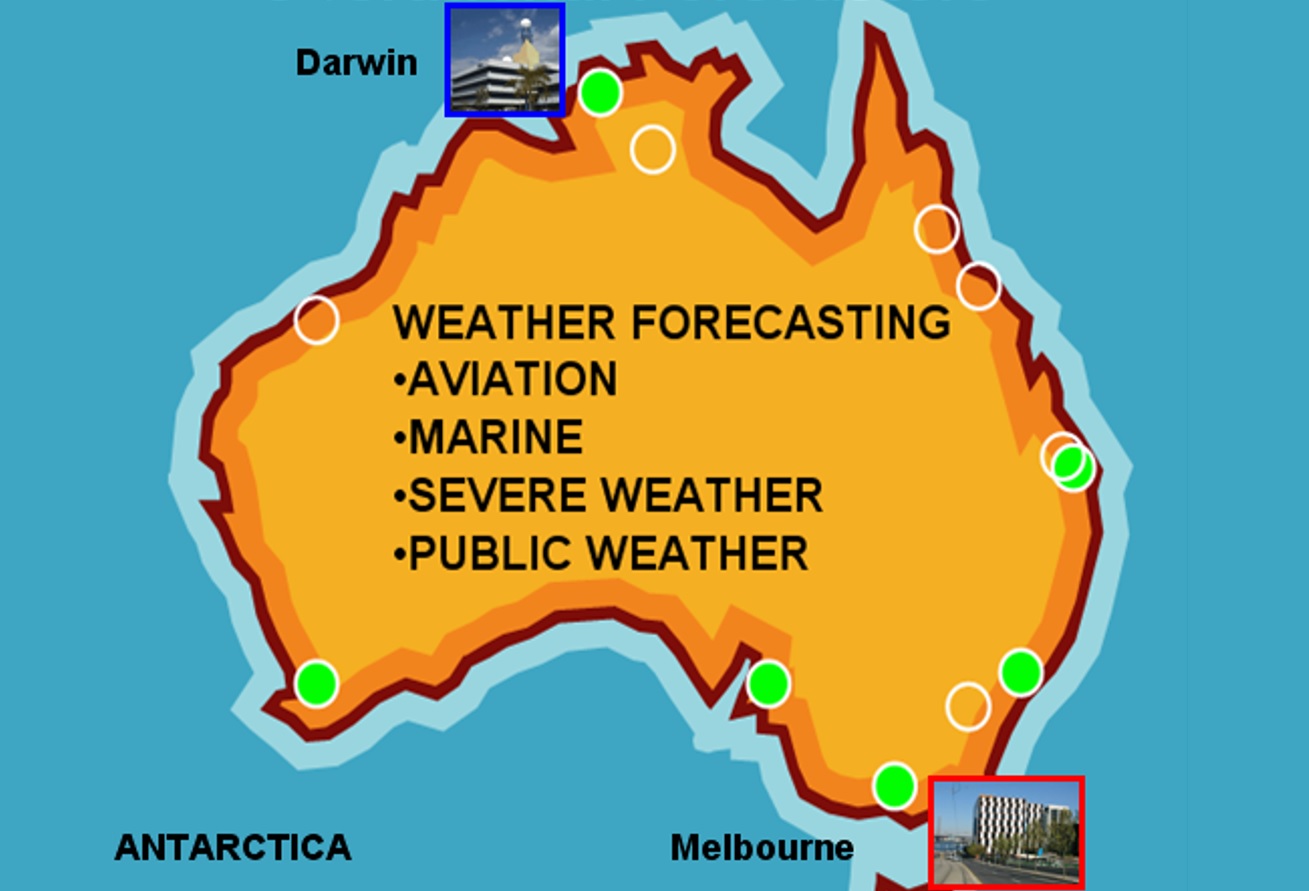
Bodo Zeschke gives a comprehensive overview of the technical facilities available at the Australian Bureau of Meteorology followed by a weather briefing and a short lecture on shallow cold fronts.
Length: 50 min
Author: Bodo Zeschke
Bodo Zeschke received his BS in Physics at the University of New South Wales and MS in Meteorology at Monash University (2001). From 2001 to 2009 he worked as a forecaster at the Darwin Regional Forecasting Centre. During this time Bodo developed an interest in fog and low cloud nowcasting and forecasting for northern Australian regions. Since 2009 he has been engaged as a Lecturer to Australian and International postgraduate students studying for the Diploma of Meteorology at the Bureau of Meteorology Training Centre. Bodo has lectured in Tropical Meteorology, Satellite Meteorology and Weather Discussion training. Duties also include presenting lectures on related topics at World Meteorology Organisation courses and at the Bureau's annual Advanced Forecaster Workshop. He is the point of contact for the Australian VLab Centre of Excellence. Present topic of interest includes the integration of the satellite multichannel RGB products generated from MODIS imagery into Bureau forecast and training resources. This in preparation for the effective use of RGB products generated by the future Himawari 8 satellite.

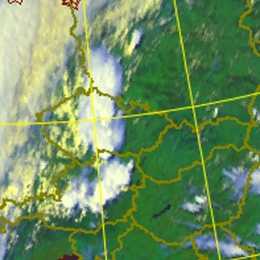
Phil Chadwick introduces his home country Canada and talks about the challenges a forecasters has to face in this large coutry. He puts most emphasis on satellite images and water vapour patterns.
Length: 50 min
Author: Phil Chadwick
Trained at Queen's University as a nuclear physicist, "Phil the Forecaster" has been a professional meteorologist since 1976. Officially retired in 2011 Phil still continues to advance his research efforts with COMET and the Meteorological Service of Canada (MSC). Satellite and radar meteorology are his forte. Much of this research has been published by COMET under the Satellite Palette banner. Phil has also completed original and extensive research on performance measurement. This large body of work resides in the Case Studies section of Northern Latitude Meteorology (NorLatMet/COMET). Aside from the above Phil has been painting en plein air forever - Philtheforecaster.blogspot.com - art and science are indeed similar endeavours. A sense of humour bundles all of this together and makes learning and teaching fun.
Cb Clusters consist of a cluster of thicker and larger cloud cells within the usual cold air cloudiness behind fronts. It differs from ECs by a looser structure and different cell sizes.
This chapter contains information about Cb and Mesoscale Convective System at small and mesoscale size. Additionally there exist another chapter (CONVECTIVE CLOUD FEATURES IN TYPICAL SYNOPTIC ENVIRONMENTS) which addresses larger scale features. Cbs and Mesoscale Convective Systems form in strong convective processes. The life time and intensity of a Cb and Mesoscale Convective System depend upon the vertical wind shear. Most important is the shear in the lowest layer reaching from the surface up to 2-3 km. Cells developing within strong vertical shear have long lifetime and produce severe weather.