
Understand NWP outputs
Peter Schmitt analyses the different aspects of CAT and presents a CAT forecasting method.
Length: 40 min
Author: Peter Schmitt (DWD)
Clear air turbulence (CAT) is the term for medium- or high-level turbulence in regions with significant wind shear. CAT is an important factor for the aviation safety.
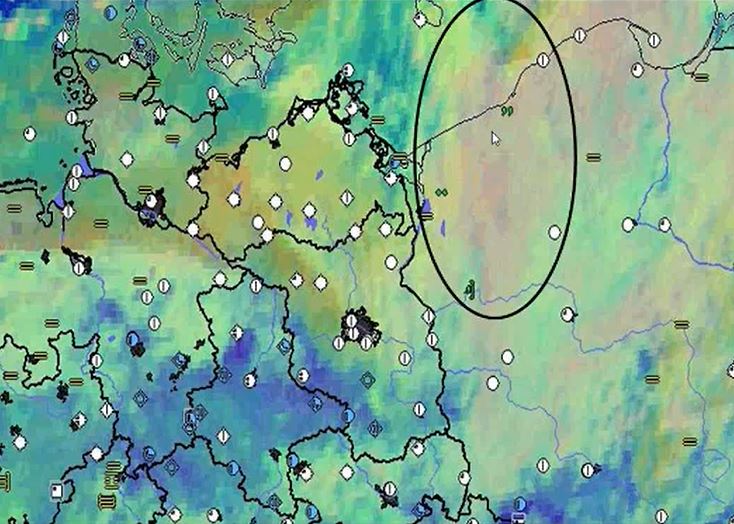
In the first part of the presentation, I will show you typical parts of CAT in relation with the 300 hPa geopotential analysis. Furthermore you get an overview to the correlation between CAT and characteristic cloud patterns in satellite images. In many cases satellite images provide the first clue or a confirmation for the presence auf CAT.
The second part is dedicated the forecast of CAT in Deutscher Wetterdienst (DWD) with the ICON model. DWD has been applying a forecast method based on Eddy Dissipation Rate (EDR). This real property of atmospheric turbulence is the main sink term of Turbulent Kinetic Energy. In a case study you will see the typical working process in practice with consideration of the model output, typical cloud pattern in satellite image and the use of the conceptual model and the structure of geopotential field.

Ab Maas shows which items are of main importance for balloon forecast e.g. accurate wind forecasts, starting and dying out of thermals and convection.
Length: 60 min
Author: Ab Maas (former KNMI)
Aviation meteorology is a wide field in terms of forecasting and forecasting product. Not only is there a big difference between the civil aviation part and General Aviation (GA), but also in GA there are a lot of specific customers who needs specific forecasts; VFR forecasts for small planes, gliding, paragliding, ultra-lights, ballooning etc.
Ballooning forecasts can also differ, e.g. the commercial balloonists need other forecasts than balloonists in competitions and championships and gas balloons can fly in weather circumstances where it is impossible for hot air balloons.
In the presentation it will be shown which items are of main importance for balloon forecast e.g. accurate wind forecasts, starting and dying out of thermals and convection. And also how surface observations, radio soundings, satellite and radar can be of help.
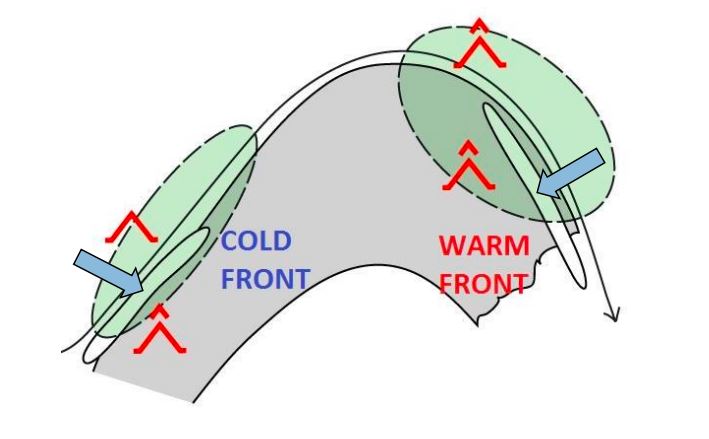
Lovro Kalin focusses on the prediction of freezing rain as an essential factor in road weather forecast.
Length: 26 minutes.
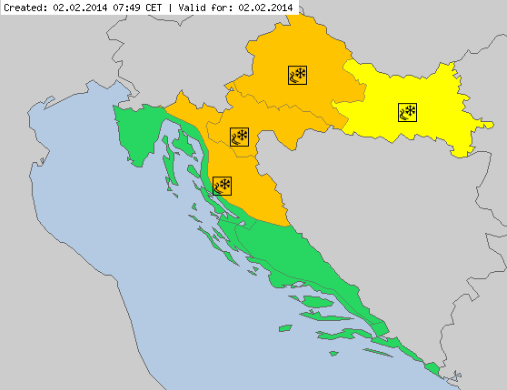
Freezing rain is a relatively complex phenomenon, with rare occurrence but often related to serious damages and threats. With only few tools available, it has always been a strong challenge for the operational forecasters - in terms of appearance, intensity and impacts. Croatia - as well as Slovenia and Hungary - experienced an extreme and disastrous event in winter 2014, with several hundreds million Euro damage, and temporal collapse of the traffic and energy system.
This paper presents recent developments and experiences in freezing rain operational forecasting. A major tool used recently is the new 'precipitation type' product provided by ECMWF, and so far with overall very good performance. It is accompanied by other diagnostic tools defined in the Croatian Hydrological and Meteorological Service. Several recent cases will be presented, and experiences and forecast performance will be discussed.
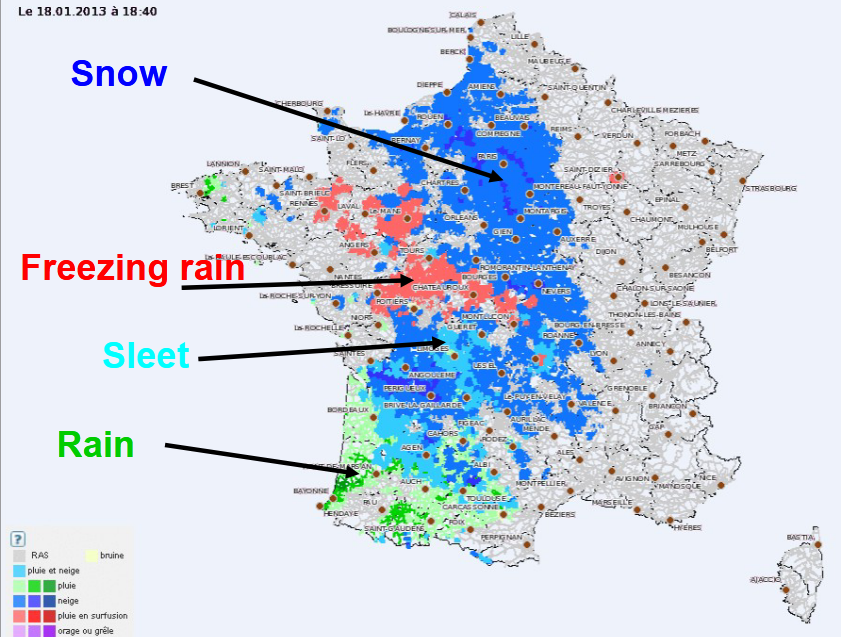
Three different approaches to forecast road weather at Meteo-France are presented.
Length: 36 minutes.
During winter, snow or ice presence on the road might have serious consequences on road traffic and security and many efforts were done for several years to develop decision-making tools for road management in winter. For this purpose, Météo-France uses, in an operational way a specific system dedicated to the road weatherforecast.
The first one, OPTIMA is a high-frequency (5 min) nowcasting system providing 1 hour forecasting and based on data fusion approach. It is dedicated to real time and short range anticipation of road impacting phenomenon. It was specially developed to work at the road network resolution (5km).
The data OPTIMA uses for the forecast process:
- Radar observation and nowcasting
- Surface observation network and road weather stations observations from customers
- Best available weather forecast (i.e. expertized by human forecasters)
- Specific road weather forecast
As an input for this decision-making tool, Météo-France uses numerical road models, which permit to simulate the behavior of a road under the influence of atmospheric conditions and the behavior of the snow on the road. Since 2012, road models are forced by human expertized atmospheric forecast instead of a direct coupling with numerical weather prediction models. Thissystems, called PEIR (Expertise Predictions for ISBA-Route), are the basis of road conditions forecasting products for French road managers.
Since the beginning of operational road weather forecast in Météo-France, all the products were based on deterministic forecasts, however since 2018/2019 winter, a new approach is tested, based on ensemble forecast.
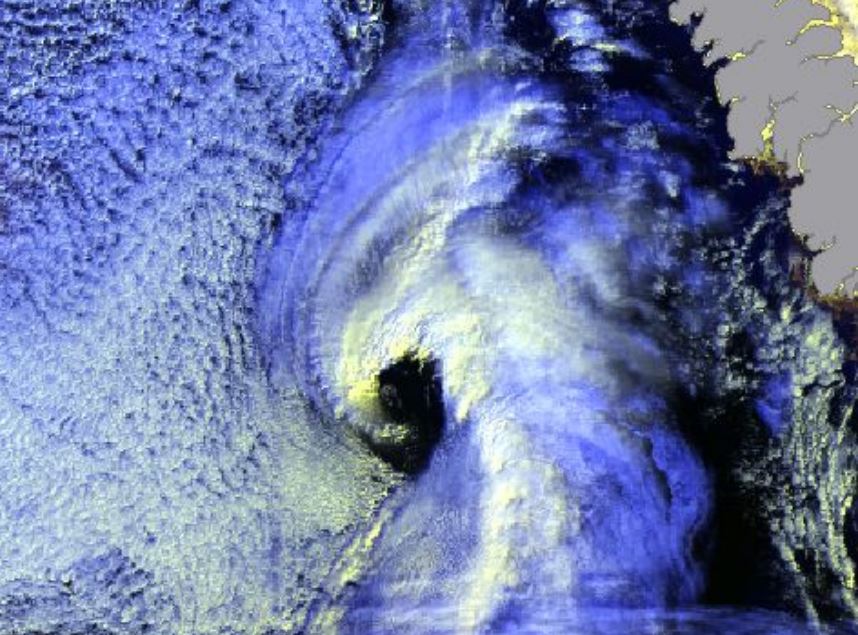
Gunnar Noer presents facts on Polar Lows, how they are forecasted, and gives examples of interpretation of satellite imagery.
Length: 55 min
Author: Gunnar Noer (MetNo)
Polar Lows can be seen as small Arctic hurricanes, and they have a severe impact on shipping and coastal communities in Scandinavia. They are most common in the Barents Sea and the Norwegian Sea, but are also known to occur in the central North Sea and surrounding coastal areas. Polar lows are the most intense type of wintery convection weather phenomenon in this area. Thus, a familiarity with Polar Lows will also increase our ability to forecast the more common snow shower events in the winter season. This talk will present some facts on Polar Lows, how they are forecasted, and give examples of interpretation of satellite imagery.
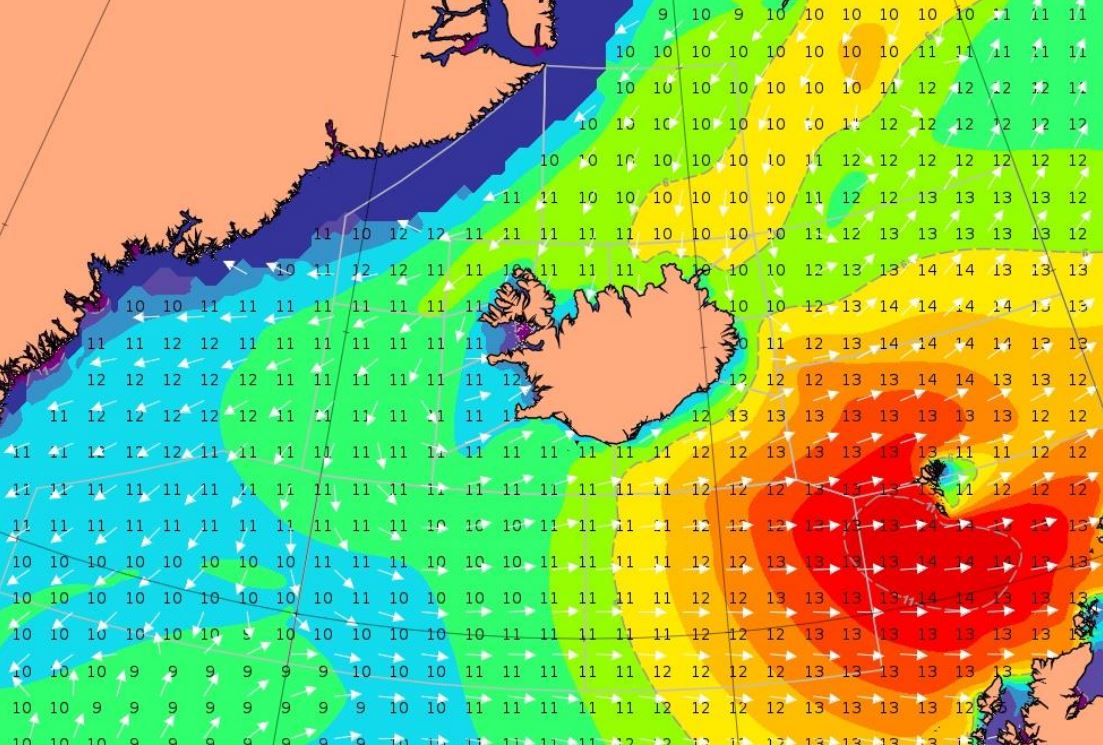
Björn Einarsson analyzes a storm moving south-east of Iceland.
Length: 30 min
Author: Björn Einarsson
Case 1. Between April 2. and April 4. 2018, gale to storm force winds from the west propagated from Cape Farewell, the southernmost point of Greenland over 1000 nautical miles across the Atlantic towards and past the Faroes Islands with high waves. This type of eastward wind/wave field propagation south of Iceland happens few times a year with varying intensity. Case 2. A showcase of the westerly Greenland tip jet creating large waves – but looking at the forecasted winds and waves versus observations, they seem contradictory, making the forecaster think twice.
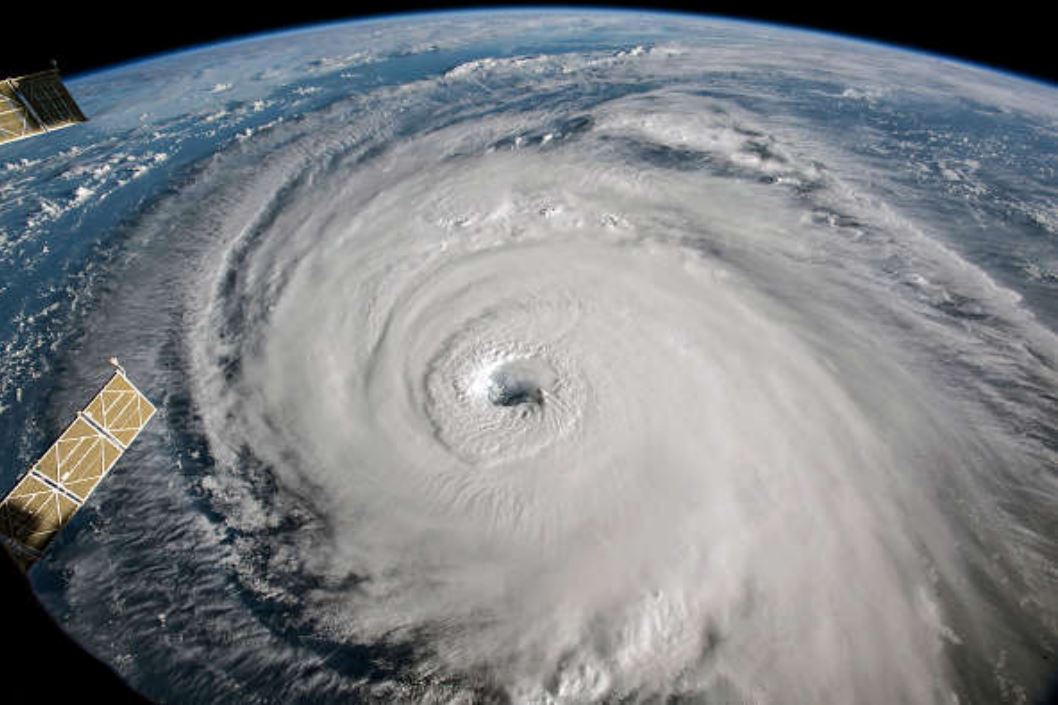
Carlos Ramalho presents some tropical and extra-tropical cyclones that affected the Azores and the challenges forecasters face in this situations.
Length: 30 min
Author: Carlos Ramalho (IPMA)
Due to the Azores geographical location, this archipelago is occasionally affected by strong Extratropical cyclones and Tropical cyclones. Extratropical cyclones are more frequent in winter and are often associated with strong winds, heavy precipitation and heavy waves which can be damaging and contribute to social and economic distress. Tropical cyclones, on the other hand occur mostly in September and October and in the past have caused loss of lives and property damage. Forecasting this type of systems is very challenging, mostly because a small variation in path can cause large difference in the impacts. This talk presents some tropical and extratropical cyclones that affected the Azores and also the challenges that forecasters face in this situations.
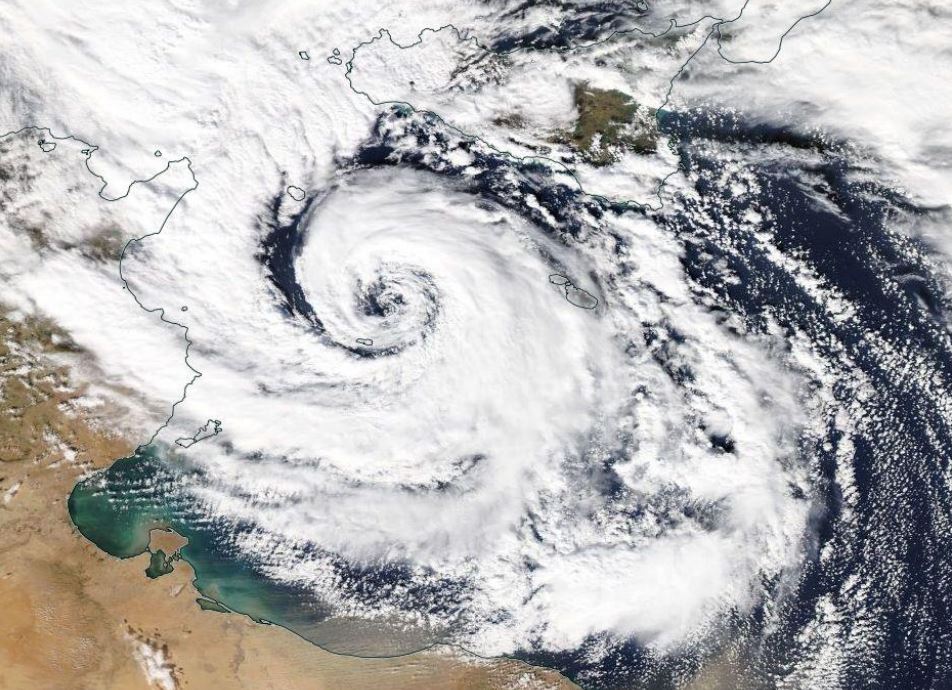
Ioannis Pytharoulis shows past cases of Medicanes, the description of their structure and characteristics.
Length: 50 min
Author: Ioannis Pytharoulis (Aristotle University of Thessaloniki)
The Mediterranean tropical-like cyclones are intense sub-synoptic maritime lows with strong winds, axisymmetric warm-core structure and tropical cyclone features, such as a cloud-free eye and spiral deep convection. They are frequently referred to as medicanes (MEDIterranean hurriCANES) due to their resemblance to tropical cyclones. Despite their low frequency (of about 1.1-1.6 systems per year), medicanes constitute a serious natural hazard to life, property and the environment of the coastal regions of the Mediterranean basin and the Black Sea. Their accurate prediction is a challenge for the numerical weather prediction models. This presentation includes some past cases of medicanes, the description of their structure and characteristics, criteria that are used to define them, the development mechanisms, climatology, consequences and finally a detailed case study of medicane Qendresa (November 2014).
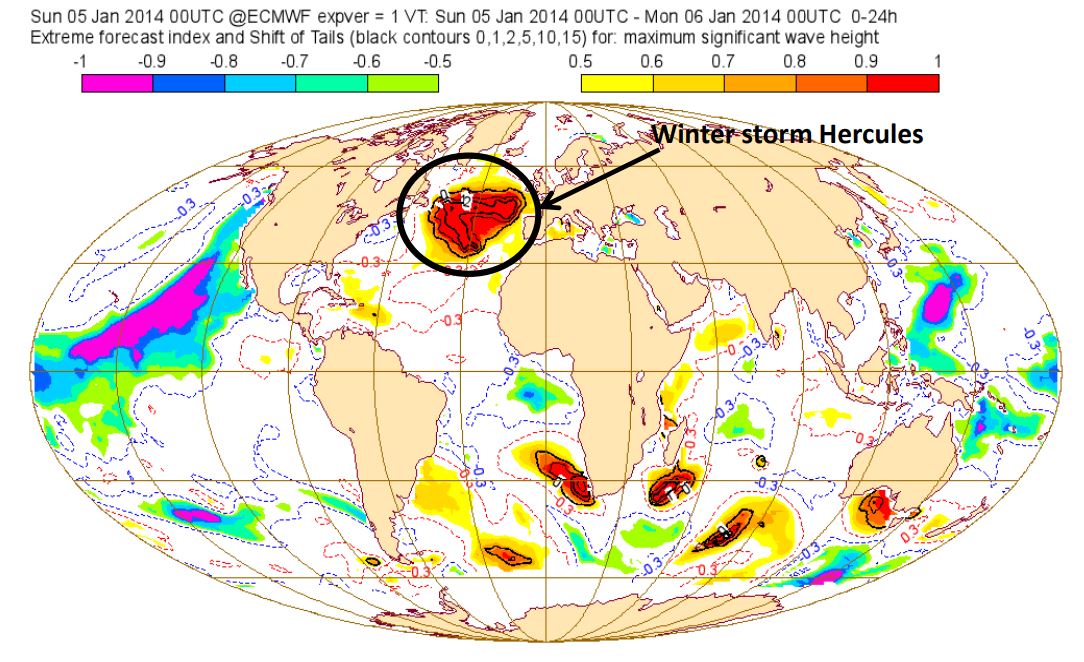
Ivan Tsonevsky demonstrates two recent EFI/SOT products for forecasting severe thunderstorms, their interpretation and practical use.
Length: 50 min
Author: Ivan Tsonevsky (ECMWF)
ECMWF provides the Extreme Forecast Index (EFI) and Shift Of Tails (SOT) as tools to help forecasting anomalous and extreme weather by measuring the difference between the Cumulative Distribution Function (CDF) of the real-time ensemble forecast and the model climate (M-climate) CDF. The definition of the EFI and SOT will be presented alongside the M-climate configuration. Verification results and EFI/SOT products will be shown with examples to demonstrate their use and interpretation. Some advantages and limitations of the EFI and SOT will be discussed. Examples focused on the available EFI/SOT for marine forecasting will be given as well. Two recent EFI/SOT products for forecasting severe thunderstorms and their interpretation and practical use will be demonstrated.
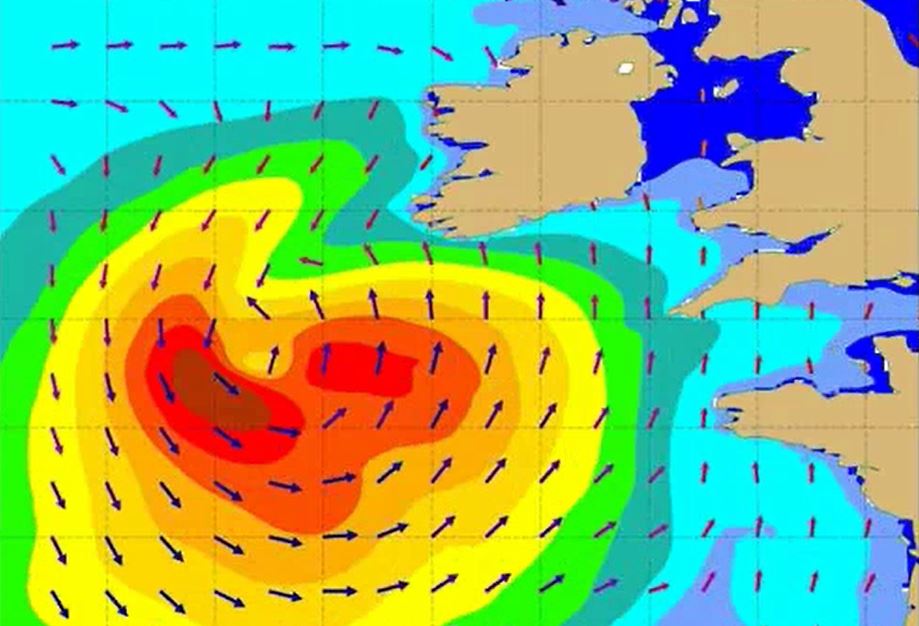
Jean Bidlot gives an overview on the ECMWF wave model products.
Length: 50 min
Author: Jean Bidlot (ECMWF)
Wave models are able to give a very detailed description of the conditions at the surface of the oceans. The mean sea state is fully described by the 2d wave spectrum. This detailed description is however not always very practical and the bulk of the information contained in the 2d spectrum is usually reduced in the form of a set of integrated parameters, from a simple few such as significant wave height, mean wave direction and mean wave period, to more sophisticated parameters that described distinct part of the wave fields. Recent advances in the understanding of wave dynamics have lead to the development of new set of parameters that give information on the possible largest single wave that might exist over a certain area within a certain time frame. It is now possible to describe the sea state with different level of complexity depending on the user needs.
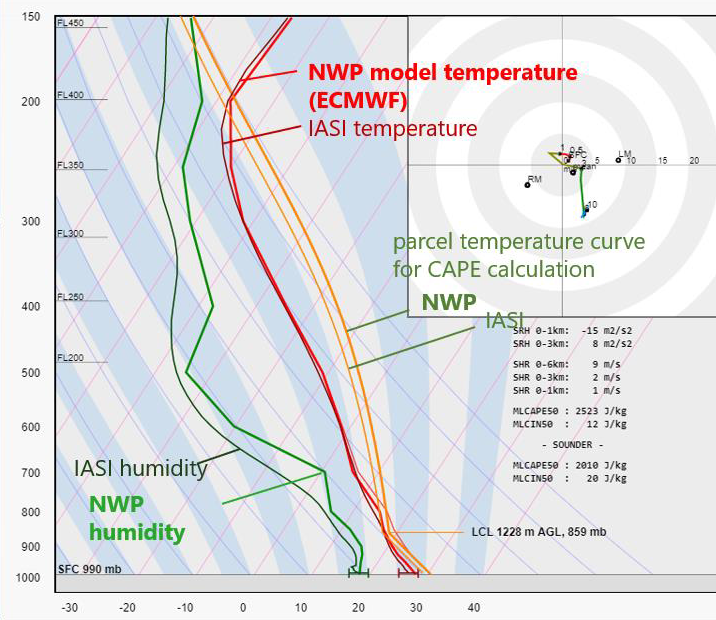
Pieter Groenemeijer reports of the tests ESSL has undertaken to check the usability of ISAI L2 temperature and humidity profiles in storm forecasting.
Length: 44 minutes.
ESSL studied the use of retrieved temperature and humidity profiles available from the Infrared Atmospheric Sounding Interferometer (IASI) instrument on the polar-orbiting Metop satellites for storm forecasting during the 2019 Testbed and for a number of cases. Parameters relevant to convective storm prediction such as CAPE, CIN and humidity at various levels were computed and a direct visual comparison between the satellite-derived and NWP-modelled profiles was made possible. We present the main conclusions of this study, addressing the usability of the products, preferred derived parameters and observed limitations.
Synoptic and Mesoscale Analysis of Satellite Images 2018 Course
Length: 59 min
Author: Wilfried Jacobs (DWD)
Satellite image interpretation of shallow clouds and related weather phenomena is a very important task for nowcasting because NWP-models and statistical methods exhibit still deficiencies in simulating these phenomena in a proper way. Especially over oceans but also over land observation networks are often too coarse meshed for nowcasting.
The theory and the most suitable satellite products will be explained first. In combination with other data (e.g., observations, radio soundings, radar products) examples will be discussed for the following application areas:
- Diagnosing shallow clouds in respect to water content and related weather, e.g., drizzle of different intensities;
- Identifying fog and low stratus and how to estimate the fog/stratus layer’s thickness. The likelihood of dissolving and connected weather phenomena (e.g., freezing drizzle) will be covered, too.