
Identify cloud types and their characteristics
Presentation during the event week on Fog and Low Clouds in January 2009.
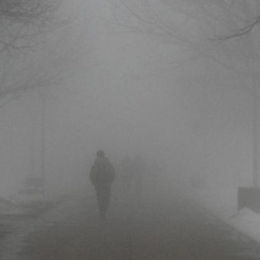
Anna Eronn from the Swedish Hydrological and Meteorological Institute will talk about cold event Fog.
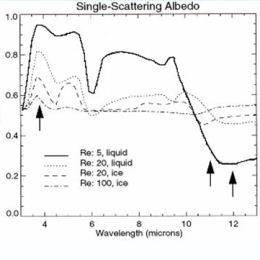
The most common way to detect fog and low clouds at night is by using of the brightness temperature difference between IR10.8 and IR3.9. Unfortunately this method does not work in very cold winter situations because the IR3.9 channel is very noisy for cold scenes. Therefore it is recommended to replace the IR3.9 with the IR8.7 channel which is significantly less noisy for cold scenes. The theory behind this and practical examples will be presented.

Presentation during the event week on Fog and Low Clouds in January 2009.
Nuno Moreira from Portugal will talk on how IM (Portugal) deals with fog, with focus in summer fog in comparison to (our) winter fog.
Presentation during the event week on Fog and Low Clouds in January 2009.
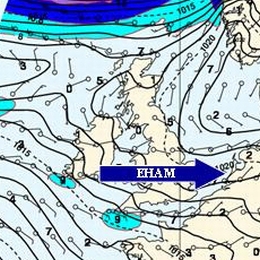
Jan Hemink from KNMI will give a practical session on fog in respect to the Aviation Meteorologist with an example from visibility observations and forecast of Fog at Amsterdam Airport Schiphol.
On a satellite image low layered Stratus is often compared to Fog. To actually know if there is Fog underneath this Stratus cover you have to know about the visibility. A problem than arises: When do we talk about Fog? The criteria for this is that the visibility should be below 1000 meters, but how do we defines this criteria during day and night.
The measurements of visibility in relation to the forecast will be a central point that is discussed in this presentation.
Presentation during the event week on Fog and Low Clouds in January 2009.
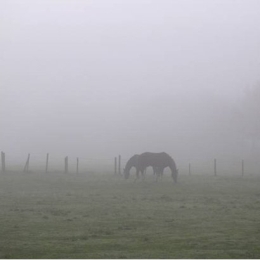
Paul de Valk, researcher of the remote sensing department at KNMI, will talk about radiation fog and shallow fog. Radiation fog is barely observable from satellite observations. Ground based observations are used to detect radiation fog. The satellite information is used to extrapolate the ground based point observations to a spatial distribution.
The forecaster is provided with information over fog favourable conditions deduced from observations and with information about visibility and ceiling. The tool is developed to support the forecaster in his decisions with respect to fog.
Presentation during the event week on Fog and Low Clouds in January 2009.
Practical session done by Stjepko Jancijev from the Croatian air-traffic control who will talk about Products and techniques used on Zagreb airport for fog forecasting. This talk will be followed by a colleague from the Croatian Weather Service DHMZ who will talk about the use of MSG and the derived Fog products in the operational shifts.
Presentation during the event week on Fog and Low Clouds in January 2009.
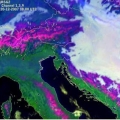
Jan Cermak (ETH) will talk about the operational detection of fog and low stratus from satellite data. The research presented my may help the forecasters and application experts to get out of the traditional thinking you cannot differentiate fog from low stratus with satellite images alone.
Presentation during the event week on Fog and Low Clouds in January 2009.
Ljubljana airport is located in the basin, surrounded by high mountains with peaks over 2500 m. The formation of radiation fog at the airport is therefore very common, especially in the wintertime. This greatly impacts the safety and effectiveness of aviation traffic.
The method used in Slovenia is based on statistical methods of interpreting observations and numerical weather prediction models output. In two methods, discriminant analysis and decision trees, they use three types of predictors - observations, MOS and PPM. They do not use the results directly but rather as a guide for the real forecast.
Presentation during the event week on Fog and Low Clouds in January 2009.
Wilfried Jacobs (DWD) will talk about COST-722. A project in which 14 countries worked together from November 2001 to May 2007. After an inventory phase about the requirments of customers and forecasters a research and development phase followed during which advanced methods of very short range forecasts of fog, visibility and low clouds were developed. In this presentation an overview about activities and the most important results will be given.
Presentation during the event week on Fog and Low Clouds in January 2009.
Andreas Frank, a forecaster from ZAMG, will give a presentation on the forecast experience of fog at the Austrian Weather Institute. A good description of the different input data is presented and how these add up to make a forecast.
Presentation during the event week on Fog and Low Clouds in January 2009.
Andreas Wirth (ZAMG) will start the event week with a presentation about fog and low stratus detection from SEVIRI and AVHRR images. The presentation will deal with fog detection during night-time and day-time conditions. A recipe for daytime low cloud detection using several SEVIRI channels will be presented. A rough comparison between different low cloud detection products is planned.
Presentation during the event week on Convection in June 2009.
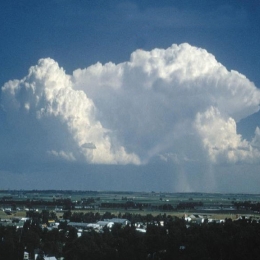
Luiz Machado will talk about the use of SEVIRI satellite on the nowcasting of convection in Brazil and Africa.
After this presentation it is back to Europe with a presentation by Maria Putsay from Hungary on the use of MSG SEVIRI data to nowcast convection at her institute. She will speak on the benefit of Meteosat-8 Rapid Scan data.
Presentation during the event week on Convection in June 2008.
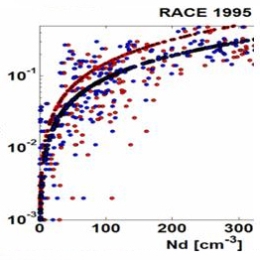
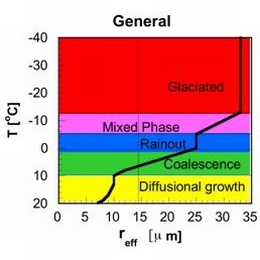
Guy Kelman (Hebrew University of Jerusalem) explained the relationship between cloud top temperature and effective radius and emphasised the advantage this can have on the lead time and the possibility to nowcast areas with a high potential of severe convection. The session was followed by Wilfried Jacobs (DWD) on the Automatic weather and product monitoring (Automon).