
Identify and interpret atmospheric phenomena
Bartolomeo Viticchie talks about the new Lightning Imager on the MTG.
Ivan Smiljanic shows how to detect low level moisture with the FCI.
This talk will provide insights into how FCI instrument can be used to detect moisture in the layers close to the surface. Up until the introduction of FCI instrument, the concept of low-level moisture estimation, using solely data from imagers on board GEO satellites was to high degree limited to so-called split window difference (e.g. SEVIRI BTD12.0-10.8). Perhaps the biggest down side of this approach is the fact that BT difference relies heavily on the vertical temperature profiles of the atmosphere (the temperature of moisture level). With introduction of water vapour absorption channel in the NIR spectral region this dependency is avoided. Hence the novel NIR0.91 FCI channels is seen as one of the crucial tools for nowcasting of severe storms, i.e. assessment of pre-conditions and moisture feeding dynamics of convective systems.
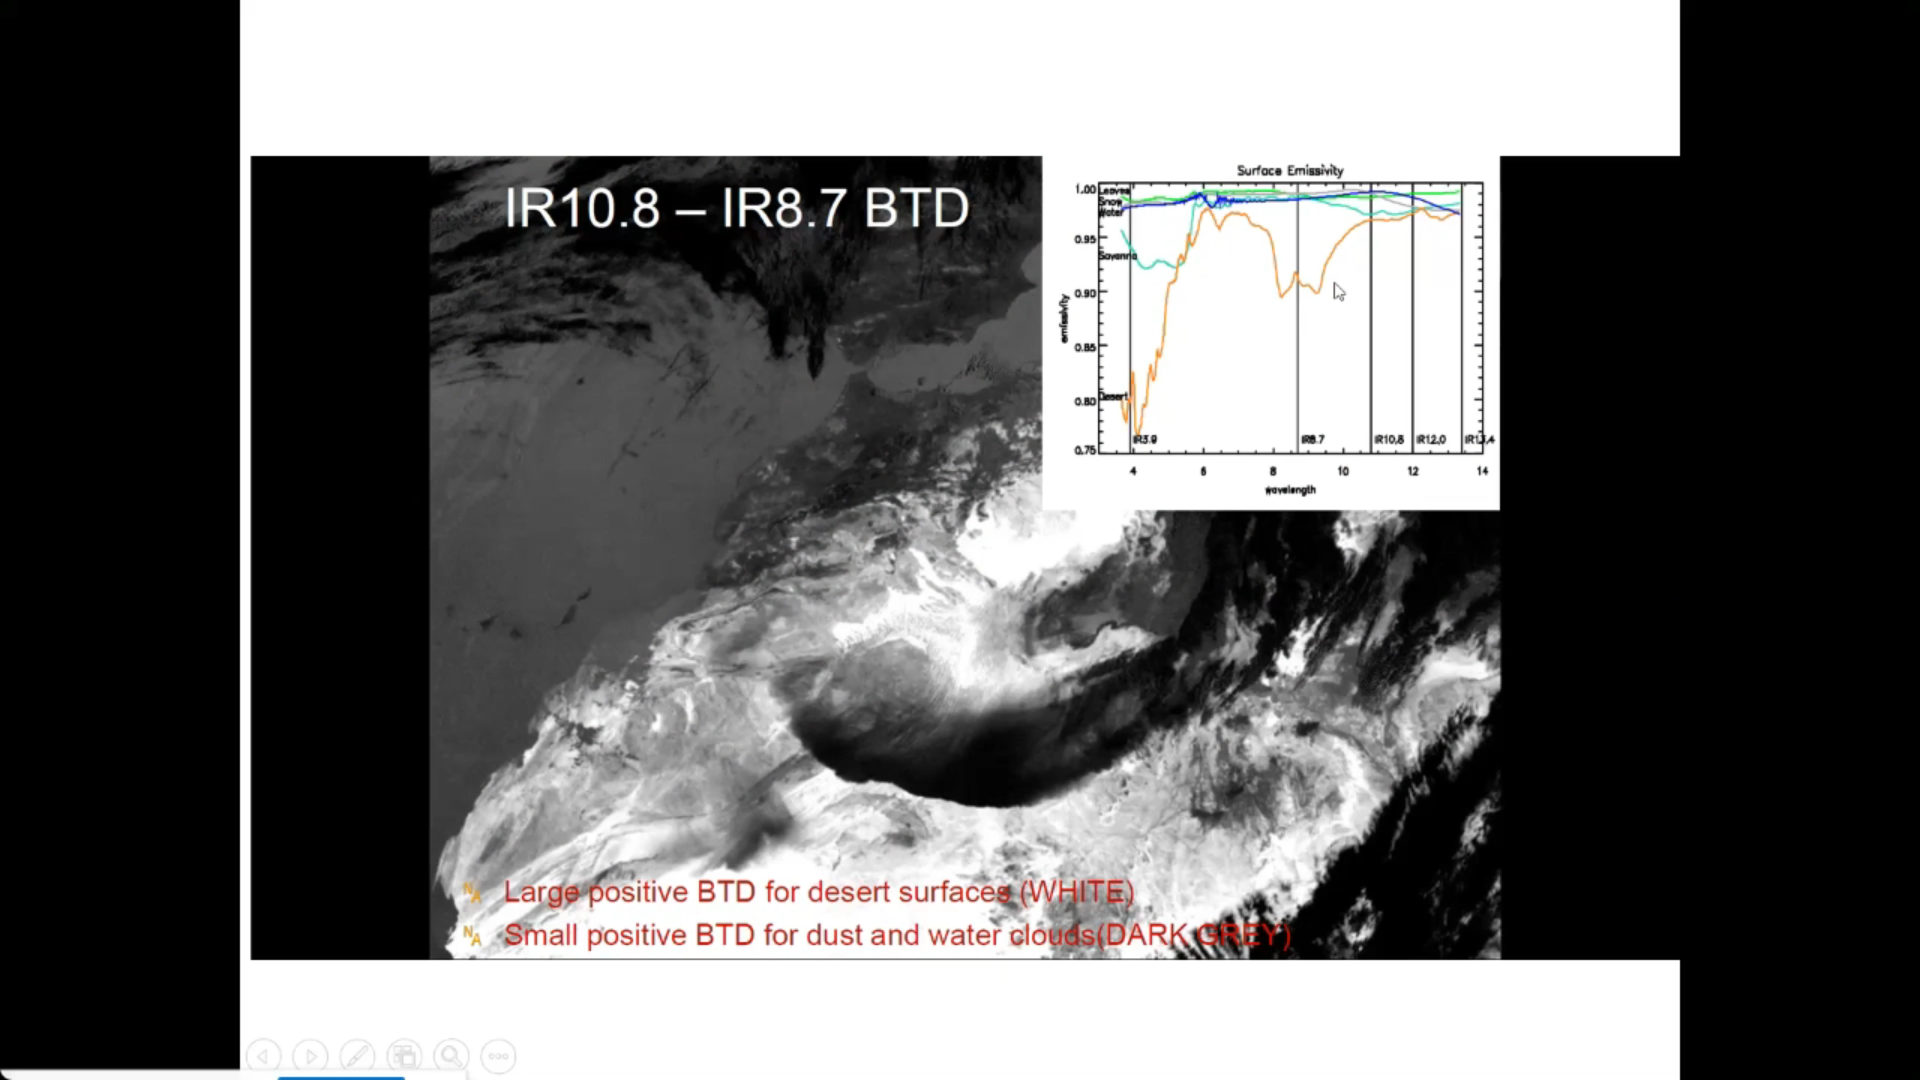
Federico Fierli shows how to use satellite imagery for observing aerosol.
Aerosol particles are a key component of weather and climate atmospheric system. Satellite offer the unique advantage to provide a global view with a long-term continuity. We will explore the methods to retrieve aerosol burden with the associated uncertainties for several cases as dust plumes and wildfire emissions. The presentation addresses the data chain from retrieval using different orbital geometries, spectral regions and geophysical products to advanced products as Climate Data Records to the assimilation process.
Lecture slides
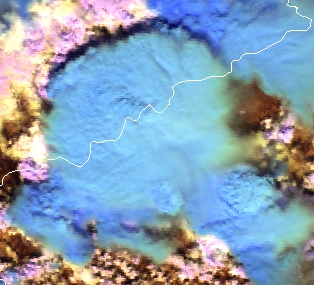
Cloud Phase RGB is a new product for European users of GEO satellite data, which can be constructed using data from the Flexible Combined Imager (FCI) on the Meteosat Third Generation (MTG) satellite system. The aim of this RGB is to provide improved microphysical information on cloud tops, in particular discrimination between thick water clouds and thick ice clouds, and cloud top particle size.
This extended guide is about the Cloud Phase RGB, a new product for European users of GEO satellite data, which can be constructed using data from the Flexible Combined Imager (FCI) on the Meteosat Third Generation (MTG) satellite system. It uses one of the new FCI channels, not available with the SEVIRI instrument. This document is an extended guide discussing its characteristics in detail; a quick guide is also available on the EUMeTrain webpage. In this guide, the imagers of Japanese and American geostationary satellites (Himawari/AHI and GOES/ABI) and polar satellites (NPP and NOAA-20/VIIRS) are used to provide proxy data for the FCI.
Identify and locate features indicating regions of possible turbulence.
This module teaches you how to use satellite data to observe and analyze atmospheric phenomena. It will show you which products can be used to identify dust storms, smoke, fires, precipitation, etc.
To access the resource click here.
Note: all resources are provided as an external link which redirects you to https://eumetcal.eu where you will need to create a user account in order to gain access to the course
Identify and locate aerosols and particulate pollution.
This module teaches you how to use satellite data to observe and analyze atmospheric phenomena. It will show you which products can be used to identify dust storms, smoke, fires, precipitation, etc.
To access the resource click here.
Note: all resources are provided as an external link which redirects you to https://eumetcal.eu where you will need to create a user account in order to gain access to the course

Identify and locate moisture features, precipitation types and amounts.
This module teaches you how to use satellite data to observe and analyze atmospheric phenomena. It will show you which products can be used to identify dust storms, smoke, fires, precipitation, etc.
To access the resource click here.
Note: all resources are provided as an external link which redirects you to https://eumetcal.eu where you will need to create a user account in order to gain access to the course
Learn to distinguish between dust and smoke.
This module teaches you how to use satellite data to observe and analyze atmospheric phenomena. It will show you which products can be used to identify dust storms, smoke, fires, precipitation, etc.
To access the resource click here.
Note: all resources are provided as an external link which redirects you to https://eumetcal.eu where you will need to create a user account in order to gain access to the course

Identify and locate fires and smoke.
This module teaches you how to use satellite data to observe and analyze atmospheric phenomena. It will show you which products can be used to identify dust storms, smoke, fires, precipitation, etc.
To access the resource click here.
Note: all resources are provided as an external link which redirects you to https://eumetcal.eu where you will need to create a user account in order to gain access to the course
Identify and locate dust and sand storms and plumes and areas of raised dust.
This module teaches you how to use satellite data to observe and analyze atmospheric phenomena. It will show you which products can be used to identify dust storms, smoke, fires, precipitation, etc.
To access the resource click here.
Note: all resources are provided as an external link which redirects you to https://eumetcal.eu where you will need to create a user account in order to gain access to the course
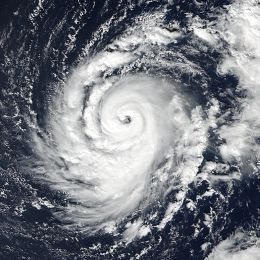
This case study describes the evolution and the life cycle of hurricanes in general and the evolution of hurricane Ophelia (2017) in particular.
This module and the adjoined simulator treat the hurricane Ophelia that threatened Europe in 2017 and hit the coast of Ireland in October that year.
In this module, you will learn more about hurricanes in general and about the evolution of Ophelia in particular from the very beginning over the Atlantic until its final stage over Ireland.
In the adjoined simulator, you will forecast the warnings related to hurricane Ophelia and the dangers that arose with this weather situation.
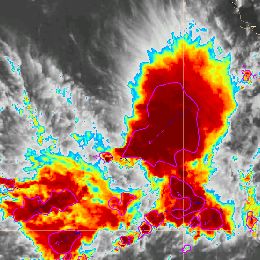
Jean-Marc Moisselin and Frédéric Autones talk about rapidly developing thunderstorms (RDT and applications available for forecasting them.
RDT-CW (Rapid Development Thunderstorm Convection Warning) product is an object-oriented diagnostic for convective clouds or cells. RDT-CW is mainly based on satellite data. RDT-CW software tracks clouds, identifies those that are convective (discrimination), and provides some descriptive attributes for their dynamics. Year after year many attributes have been added to the convection object. These improvements offer end-users the possibility to focus on specific parameters according to their center of interest: dynamic of the system (cooling rate, motion vector) lightning activity, rainfall, main cloud phase of the cell, etc. These attributes may come from various sources such as NWP data, other PGEs (Product Generation Element), lightning network. In the v2013 release, an overshooting top detection inside RDT cell is proposed to users. This new attribute allows to focus on potentially hazardous areas.
In the future releases the description of convective cells will be enriched, giving a high priority to the use of other SAFNWC products. A nowcast of RDT up to one hour will be implemented.
Several SAFNWC processing chains are implemented at Meteo-France over various geographical areas: those covered by MSG of course, but also those covered by other geostationary satellites, like overseas territory where Meteo-France centers are still implemented. Forecasters in these centers are the main users to benefit from RDT as an additional product. Productions over Europe and Africa benefit to Aeronautical forecasters from Meteo-France’s National Forecast center, to French Army, and also to ACMAD, Niamey.
A target visualization tool with nowcasting capabilities will be presented, which allows taking advantage from RDT end-product. Presentation of RDT for various situations and over various areas will also be undertaken, and the latest development implemented in v2013 release will be highlighted.