
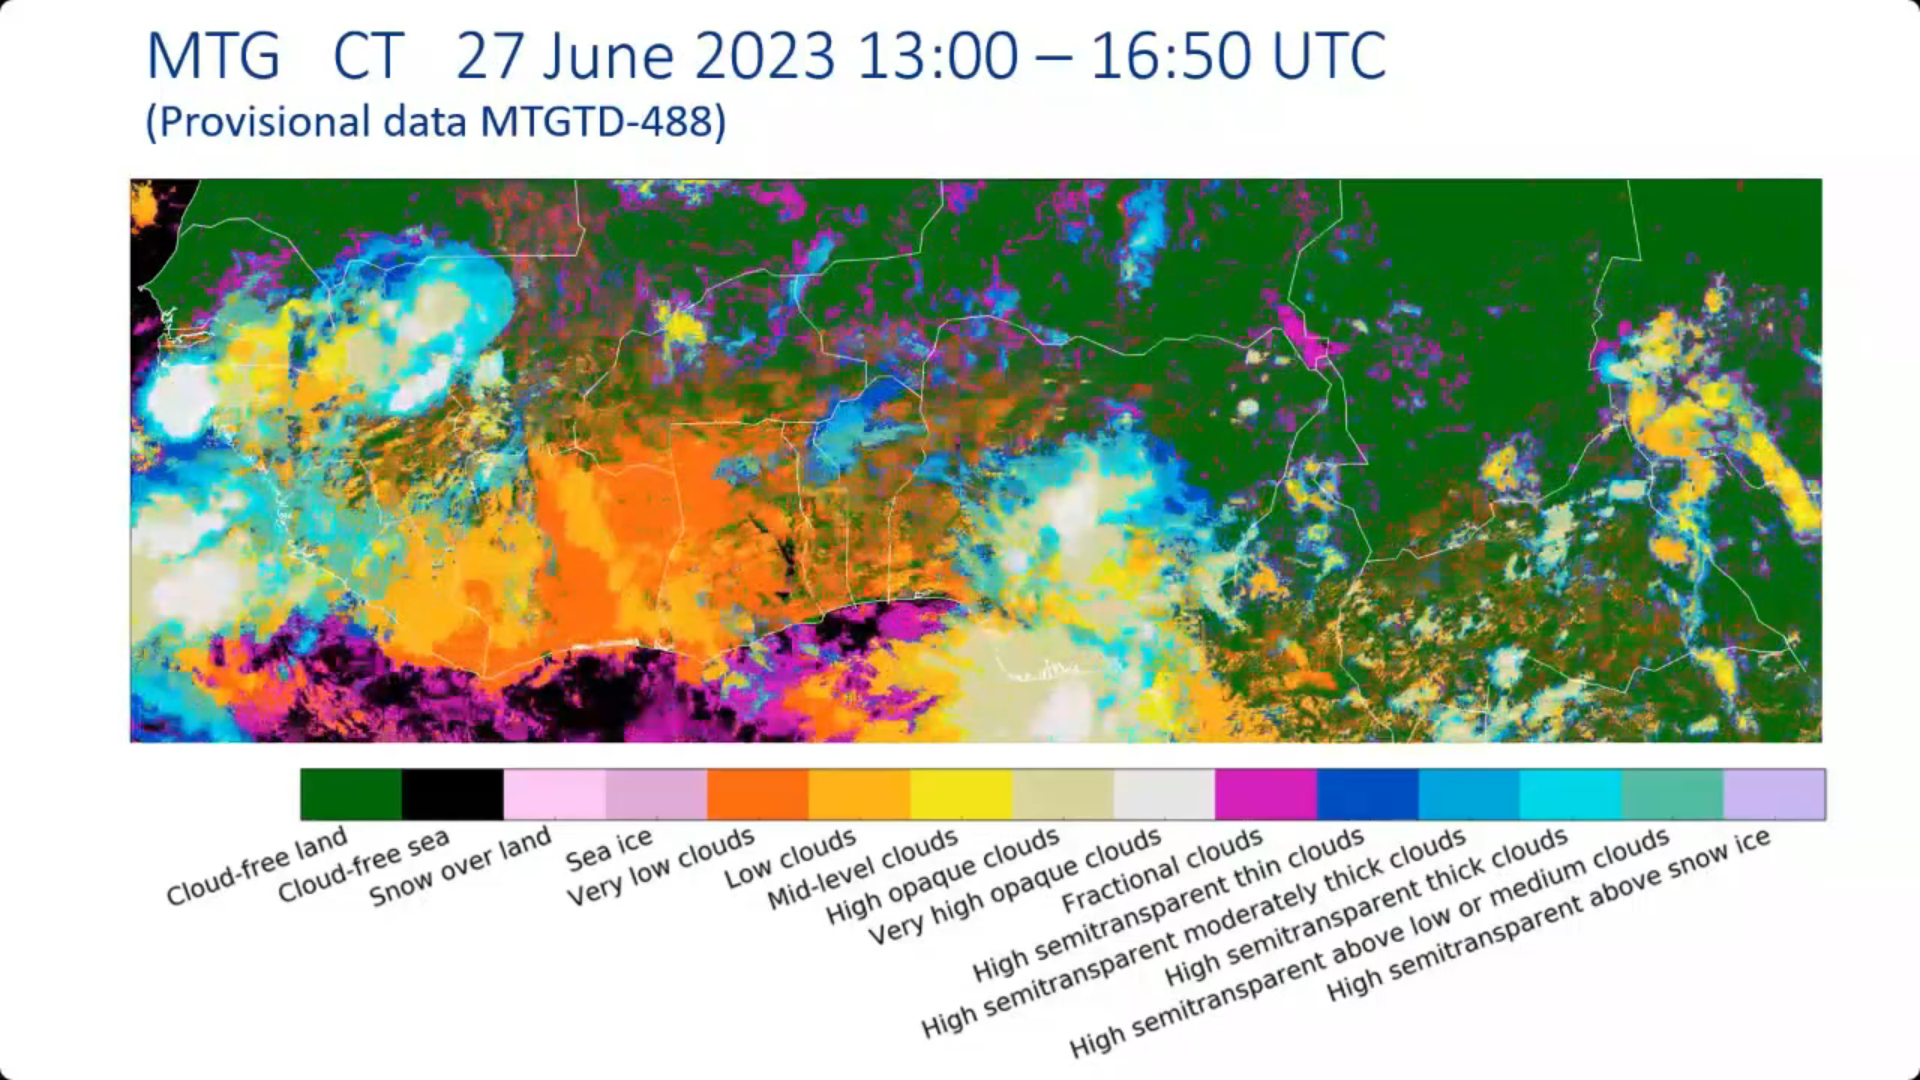
Identify cloud types and their characteristics
Vinko Šoljan talks about forecasting and nowcasting of deep moist convection, satellite products used, NWP outputs and more.
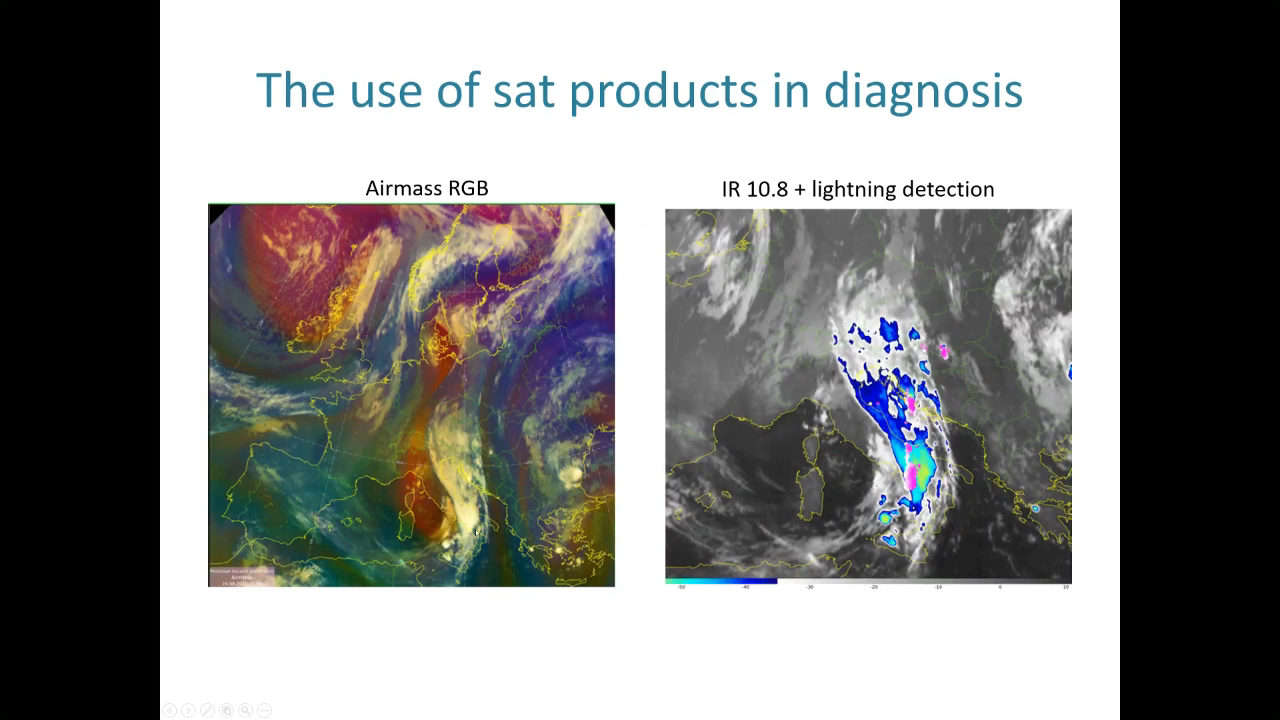
In this presentation, we will demonstrate the process of forecasting deep moist convection (DMC) at Croatia Control and how satellite products are utilized in this process. This includes large-scale analysis and diagnosis using satellite data, as well as monitoring and nowcasting existing DMC using satellite products and radar data. In DMC forecast we primarily rely on the ingredients-based methodology and NWP guidance.
Andreas Wirth goes over the topic of Dust Infused Baroclinic Storms (DIBS) and explains the current forecast model inconsistencies regarding DIBS as well as their impact on weather.
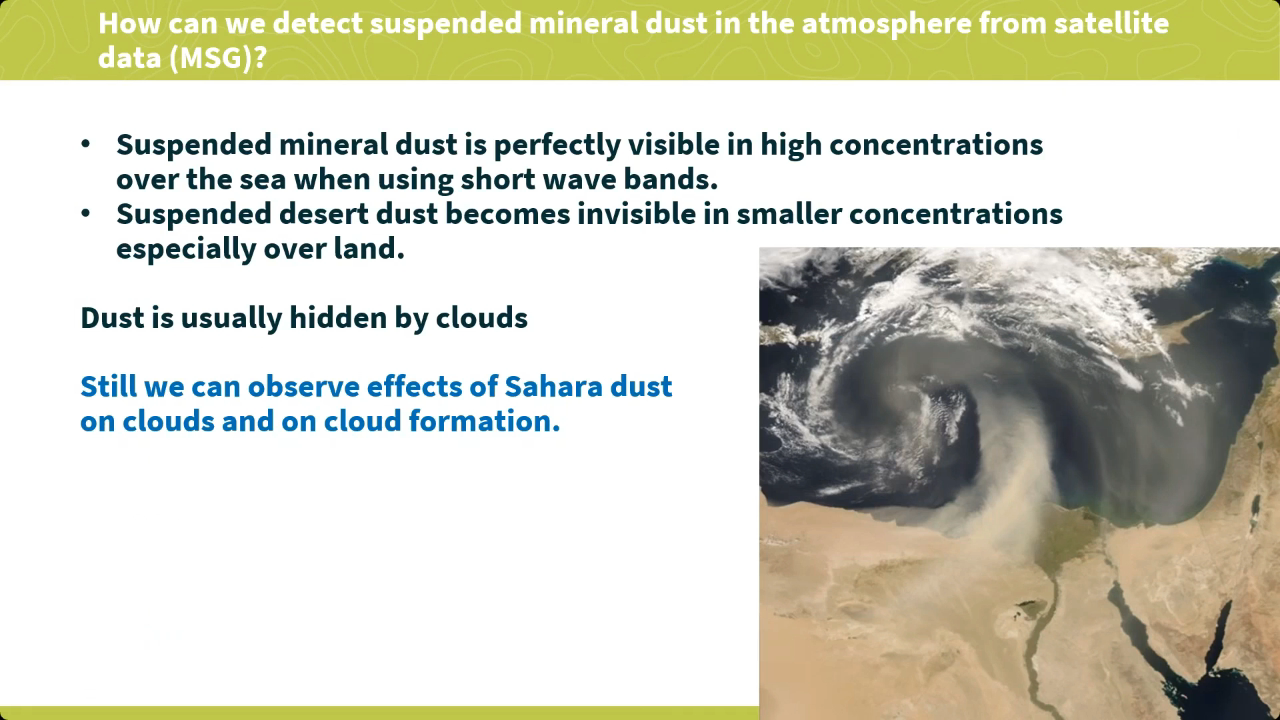
Dust Infused Baroclinic Storms (DIBS) have a high impact on weather. Mineral dust particles in the atmosphere reduce sunlight at lower levels, reduce visibility and damp daily temperature maxima. Dust particles can have an impact on forecasted precipitation too, and in higher concentrations, dust particles can cause respiratory problems.
This presentation focuses on circulation pattern that causes dust transport towards Europe and on how to detect high dust loads in- and outside clouds from geostationary satellite imagery on the basis of recent examples.
Lecture slides
Georg Pistotnik covers the topic of drylines, shows it's relevance in severe weather development.
Drylines are boundaries separating warmer and drier from cooler and moister air, usually resulting from differential diurnal heating and therefore vertical mixing. The most common and distinct dryline in the Alpine region is the boundary between Foehn winds (dynamically driven) and upvalley/upslope circulations (thermally driven). Thunderstorms often form along drylines and intensify when they move onto their moist side, where CAPE and vertical wind shear are systematically enhanced and favor convective organization. This presentation highlights how station and readiosonde data, high-resolution satellite imagery and even webcam images can be integrated into the nowcasting of drylines and resulting thunderstorms, using some prominent cases of the past few years in the eastern Alpine region.
Lecture slides
Liliane Hofer speaks about prognostic service of Austria, work organization, regional weather forecast specifics such as southerly föhn winds and others.
Various phenomena, some of which are regionally specific, such as southerly föhn winds or precipitation in northern or southern congestion, make the weather forecast in Austria very challenging at times. In addition, the topographically highly structured landscape also results in quite small-scale differences, for example in inversion weather conditions. All this and special customer products are highlighted in this presentation, as well as the basic working environment of the forecasters and, of course, the satellite products used for this purpose.
Lecture slides
Marco Stoll shows the importance of mountain waves in aviation forecasting.
Meteorological information is crucial for flight safety and efficiency. Mountain waves are an example of a potentially hazardous phenomenon for aviation that meteorological watch offices need to monitor and forecast. The typical appearance of the phenomenon in satellite imagery is illustrated, thereby making use of various MSG channels and RGB products. The difficult task of quantifying vertical speeds and estimating the degree of turbulence associated with breaking waves is discussed with the aid of NWP cross sections.
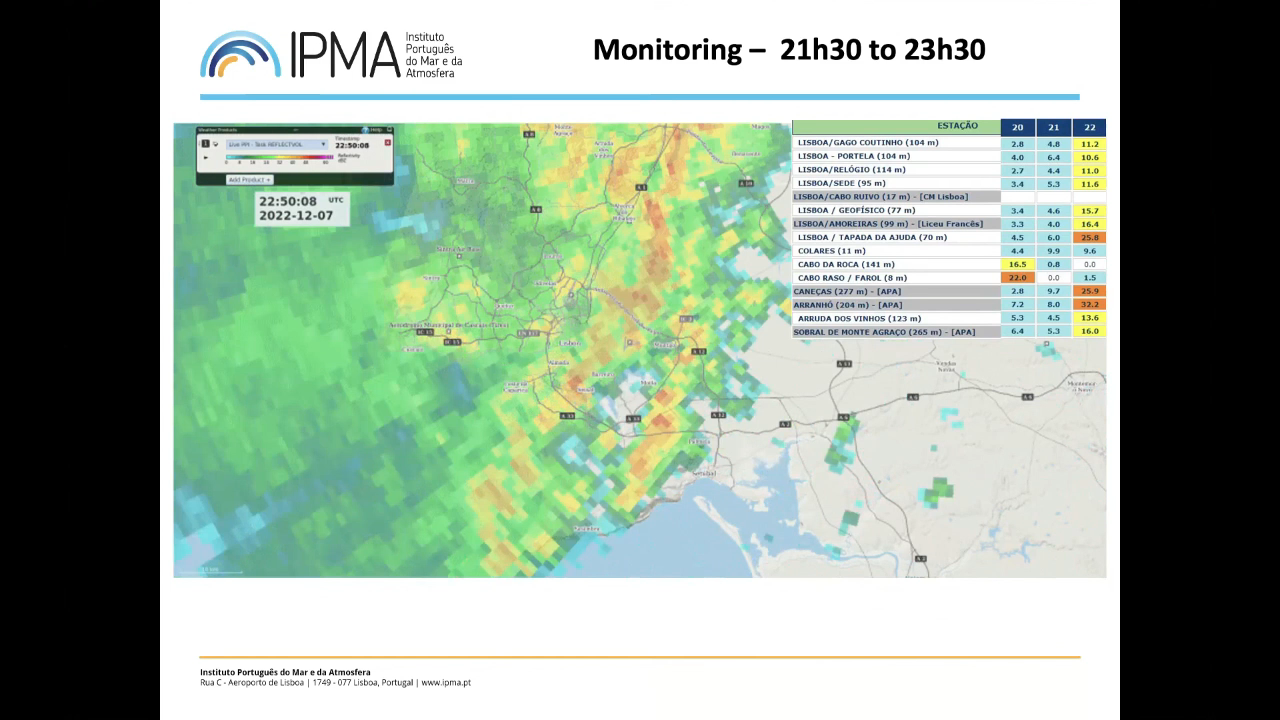
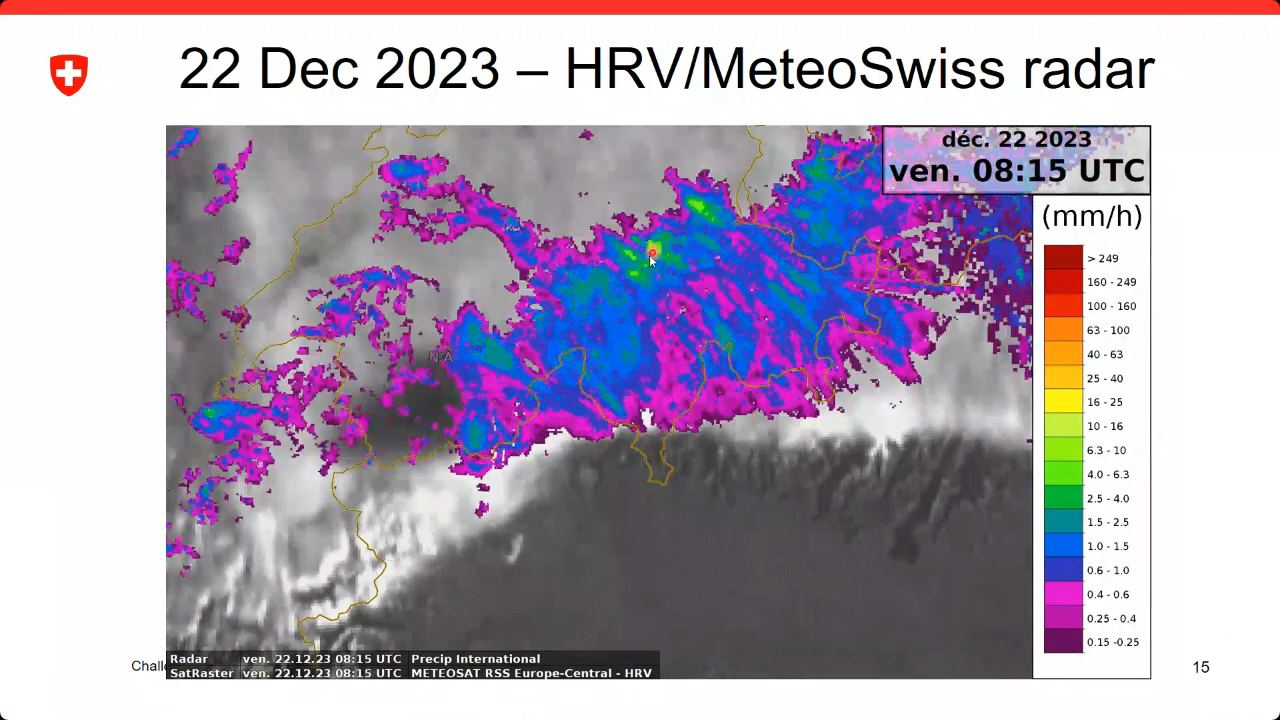
Jorge Ponte shows the challenges of being a forecaster, issuing warnings and discusses extreme precipitation event that affected Lisbon.
Extreme rainfall events in December 2022 caused significant losses in Lisbon, Portugal. This presentation examines these events to discuss whether it was possible (or not) to make a better forecast and issue earlier warnings. By analyzing various numerical model products from the preceding days alongside real-time monitoring data (satellite, radar, stations), the presentation will explore the operational forecaster's decision-making process during extreme weather situations.
Lecture slides
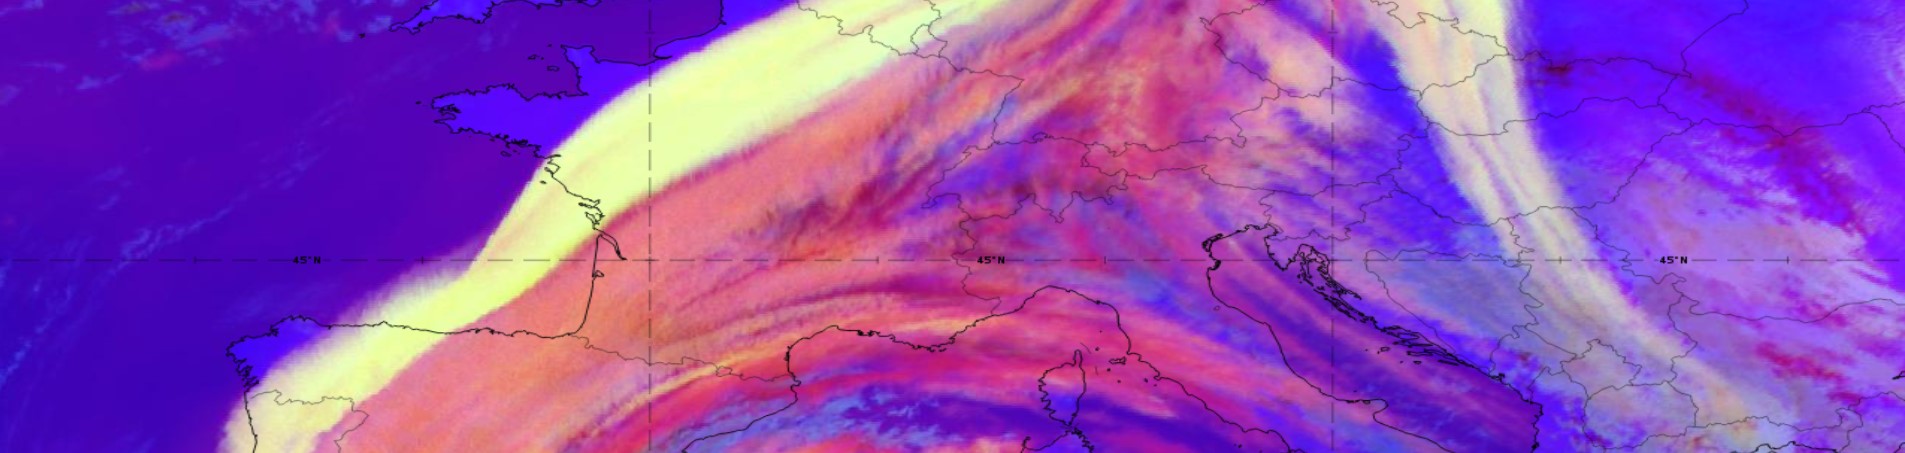
A conceptual model on DIBS: A special kind of Cirrus clouds formed by dust
The strongest influence of DIBS, and especially of dusty cirrus, on surface weather is mainly the reduced solar radiation reaching the ground as dust particles act as condensation nuclei and form clouds where otherwise no clouds would have been present. As current numerical weather prediction models do not accurately account for microphysical cloud formation processes caused by the additional dust at higher atmospheric levels, predicted maximum temperatures often have a considerable bias towards higher values.
Pilar Rípodas talks about the improvements that the MTG will bring in regards to NWC SAF products.
The Nowcasting SAF (NWC SAF) develops and distributes software packages to generate satellite derived products with application in nowcasting. Cloud products, precipitation products, stability product, wind product, convection products, products related to turbulence and extrapolation imagery are current products in the NWC SAF portfolio. A version of the NWC SAF software that supports the new EUMETSAT satellite MTG-I is been developed by the NWC SAF team. The first version (MTG day-1) is expected to be released early 2024. The improvements expected in the NWC SAF products in this version are presented. Some preliminary products with MTG-I data can be presented depending on the availability of data. A full exploitation of the new capabilities of MTG-I to improve the current NWC SAF products and to develop new ones will come in the following versions. The plans in this respect are presented.
Ivan Smiljanic shows how to detect low level moisture with the FCI.
This talk will provide insights into how FCI instrument can be used to detect moisture in the layers close to the surface. Up until the introduction of FCI instrument, the concept of low-level moisture estimation, using solely data from imagers on board GEO satellites was to high degree limited to so-called split window difference (e.g. SEVIRI BTD12.0-10.8). Perhaps the biggest down side of this approach is the fact that BT difference relies heavily on the vertical temperature profiles of the atmosphere (the temperature of moisture level). With introduction of water vapour absorption channel in the NIR spectral region this dependency is avoided. Hence the novel NIR0.91 FCI channels is seen as one of the crucial tools for nowcasting of severe storms, i.e. assessment of pre-conditions and moisture feeding dynamics of convective systems.

Mária Putsay talks about the new Cloud Phase RGB.
The presentation is about the Cloud Phase RGB, a new product for European users of GEO satellite data, which can be constructed using data from the Flexible Combined Imager (FCI) on the Meteosat Third Generation (MTG) satellite system. The aim of this RGB is to provide improved microphysical information about the cloud tops. This is achieved by using two near-infrared microphysical channels together. It is a daytime RGB and can be used in low-, mid- and high-latitude regions. The main application areas of the Cloud Phase RGB are in cloud analysis: convective clouds, fog and low clouds; aerosol-cloud interaction. The main characteristics of this RGB are demonstrated using proxy data from Japanese and American satellites: Himawari/AHI, GOES/ABI, NPP and NOAA-20/VIIRS.
Carl Jones talks about his experience with the Cloud Type RGB, that will be the RGB using the new 1.38 μm channel on the FCI.
The Day Cloud Type RGB (1.38, 0.64, 1.61) is a multispectral imagery product made with the original intent of more easily observing cirrus clouds. However, it has shown utility in monitoring convection, particularly through the use of the 1.38 μm channel. This presentation will explore potential convection applications offered by the Day Cloud Type RGB as seen by the Advanced Baseline Imager (ABI).
Johan Strandgren talks about the FCI True Colour Imagery.
The Flexible Combined Imager (FCI) on-board MTG-i1 introduces a unique capability: generating geostationary true colour imagery over Europe and Africa. This is typically achieved by combining data from three channels centred at red, green and blue wavelengths. However, FCI's green channel (0.51 microns) partially misses the spectral reflectance peak of chlorophyll around 0.55 microns, leading to inaccurate depiction of vegetation and barren surfaces. To address this limitation, a novel green band correction technique using the normalized difference vegetation index has been developed and utilized for the first release of true colour images from FCI. The new FCI true colour composite is also the corner stone for the ongoing development of the FCI GeoColor RGB composite. This composite incorporates the elements from the ABI GeoColor composite, by blending true colour imagery with night-time infrared imagery and city lights, as well as other relevant features such as wildfires and LI lightning events.
Lecture slides