
Identify cloud types and their characteristics
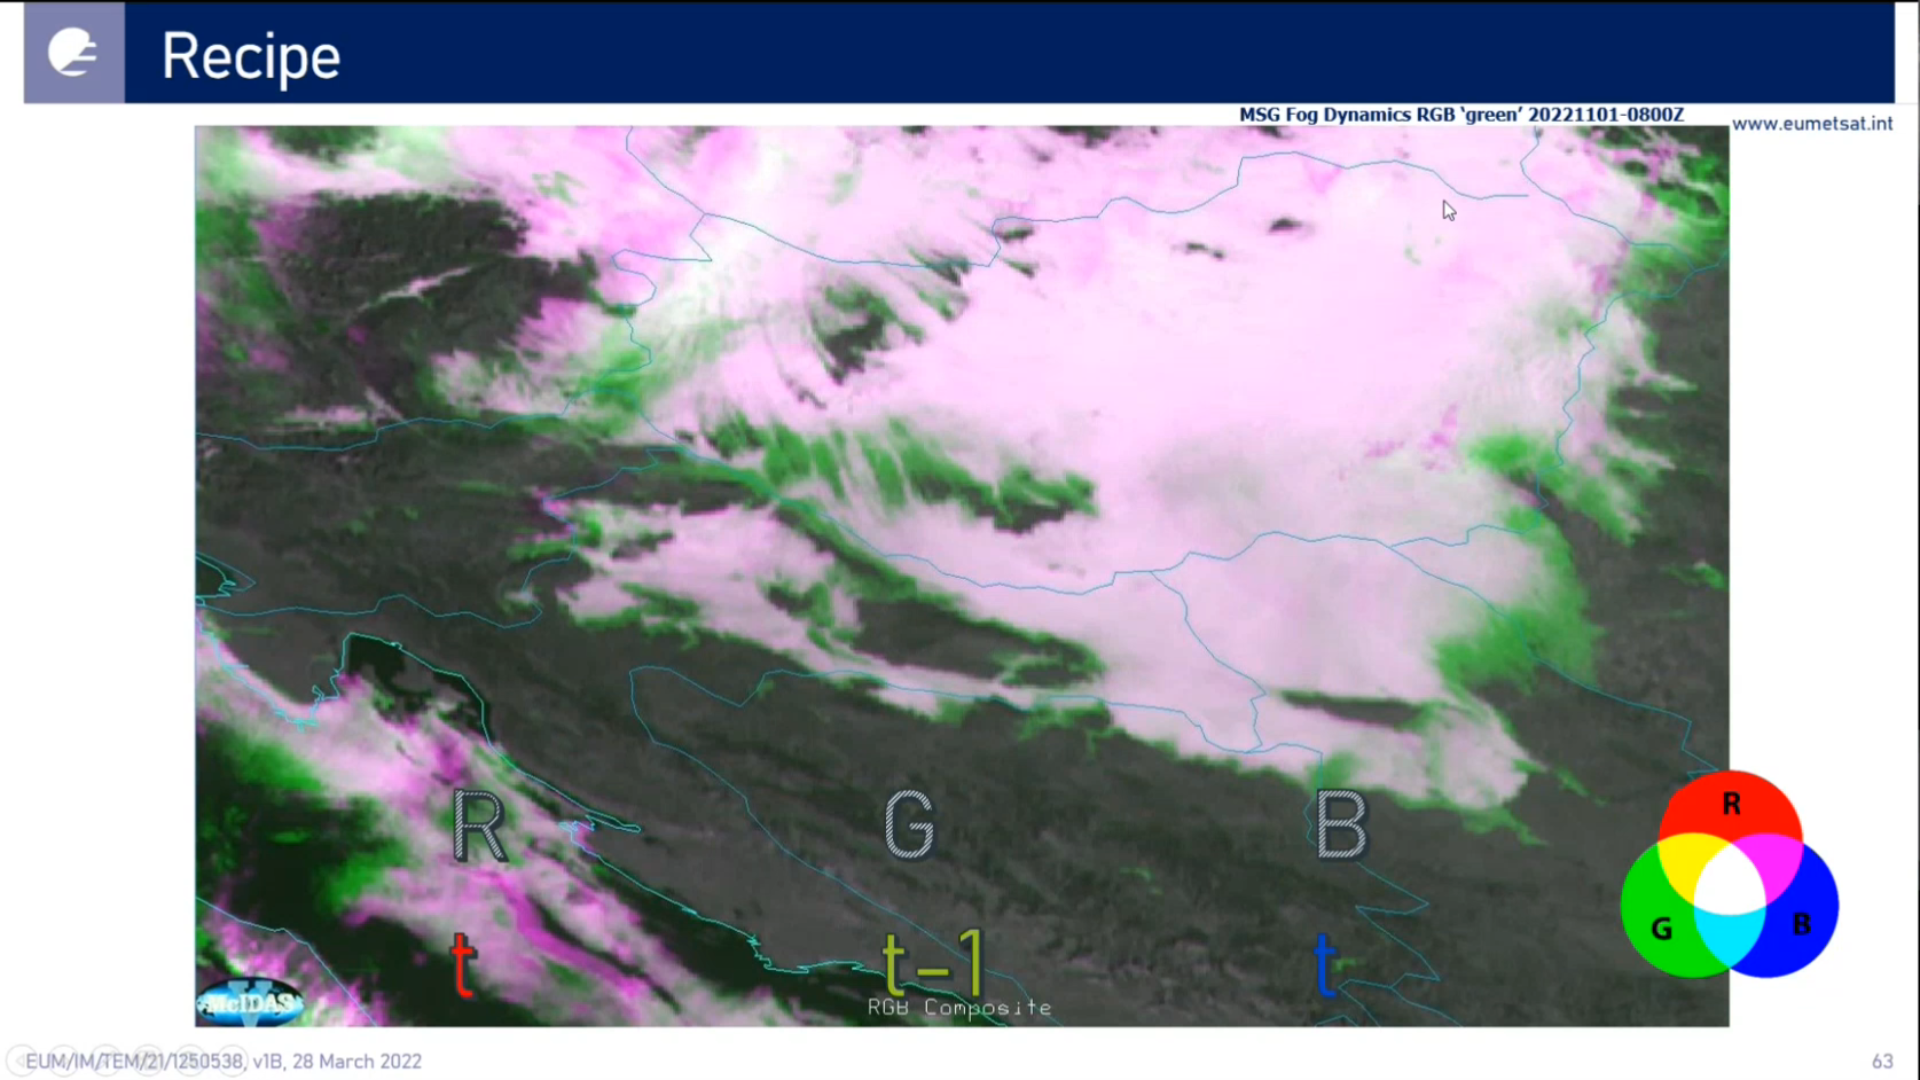
Djorjde Gencic shows the most useful RGBs for fog and low cloud detection, and mentions some "under development" products as well.
This presentation focuses on the detection of fog and low clouds with the Flexible Combined Imager (FCI) on Meteosat Third Generation. It highlights the significant advancements over SEVIRI — particularly the improvements in spatial, temporal, spectral, and radiometric resolution — that greatly enhance the ability to identify, monitor, and characterize fog and low cloud dynamics.
Go to lecture slides
Ivan Smiljanic talks about shadows in FCI imagery, that are now better observed than ever due to high spatial resolution.
When light travels through the atmosphere it can interact with it or with the features in it, leaving shadows that can be taken as clues and signatures on that interaction. From that, experts can read about different properties of various features that interacted with light, giving out the shape, height, distribution, optical thickness and even the dynamics of the features. In this session you will hear how advanced resolution of FCI reveals many new shadows, previously not well (or not at all) observed with SEVIRI imager, and you will learn how these shadows can assist experts and operational meteorologists in their daily work.
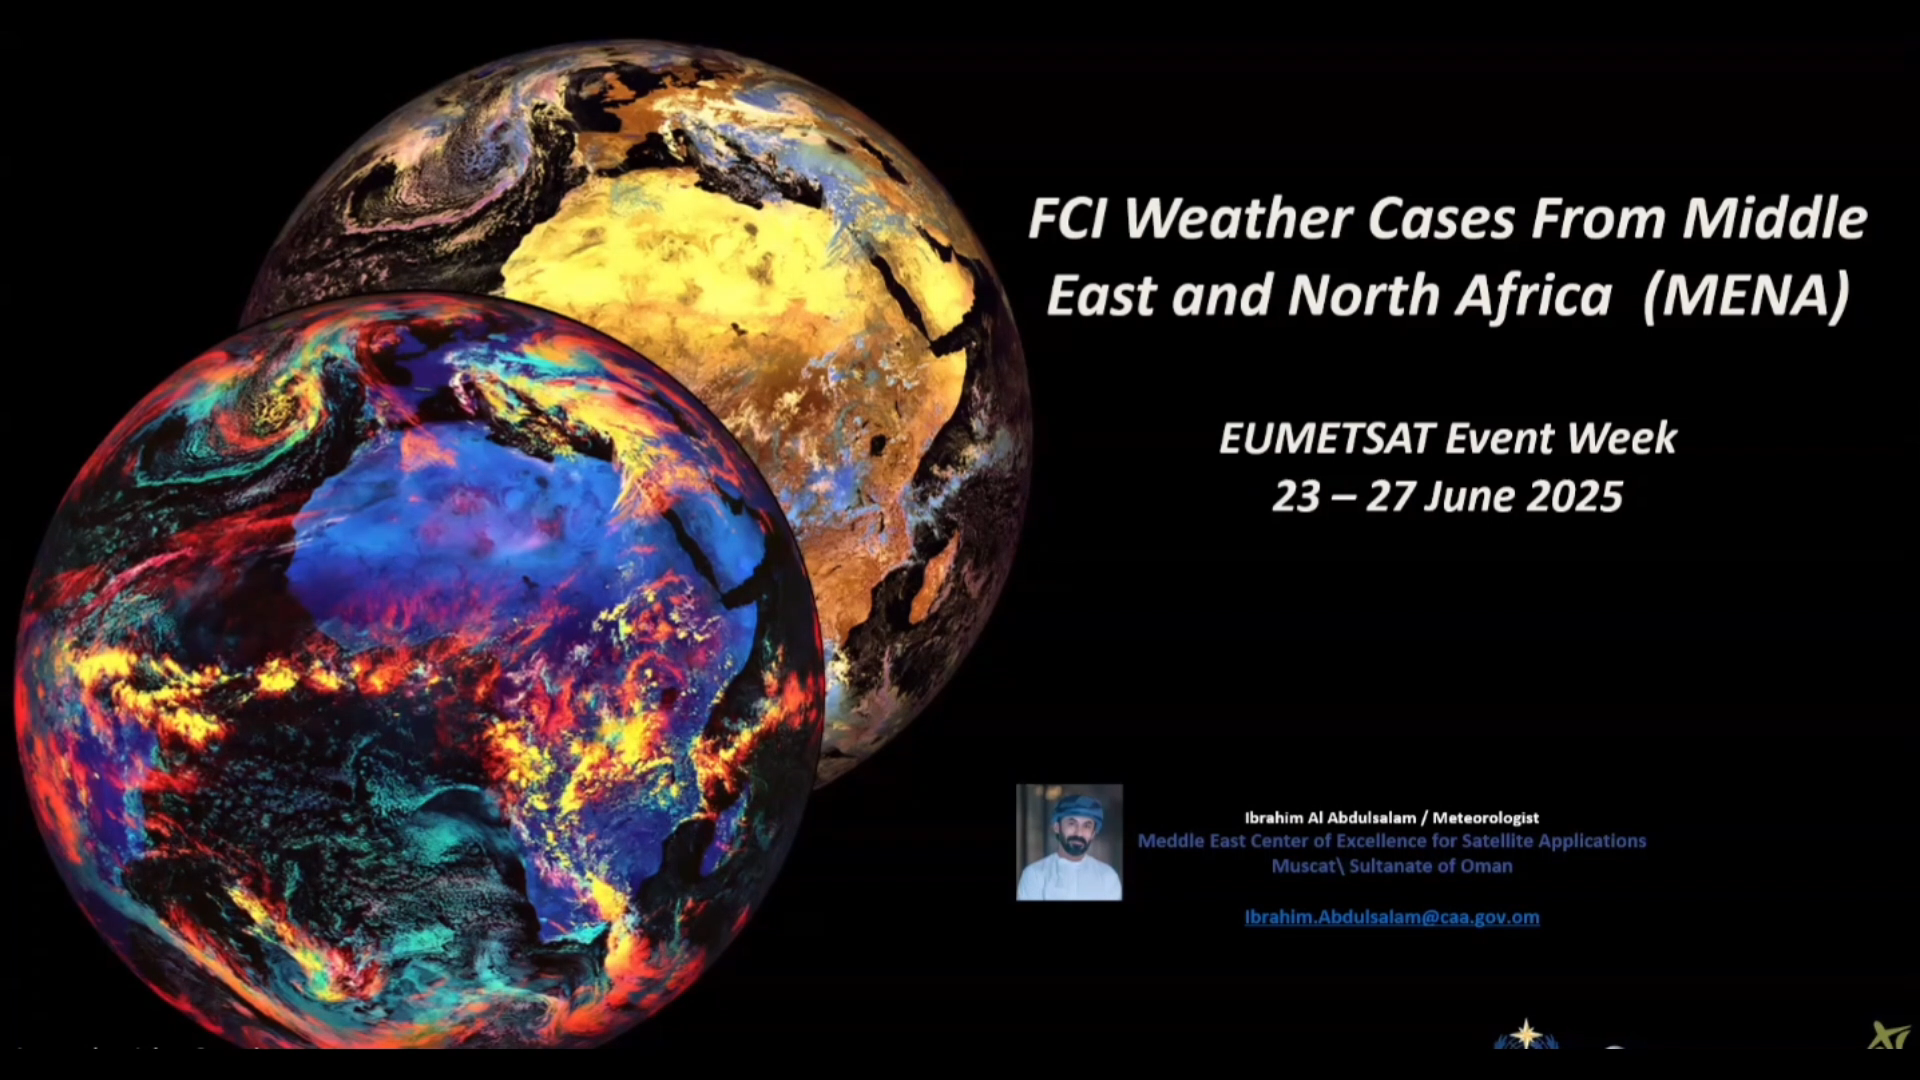
Ibrahim Mohammed Al-Abdul Salam shows a number of examples of MTG FCI Imagery during various weather situations over the Middle East and North Africa (MENA) region.
This presentation highlights early applications of Meteosat Third Generation (MTG) data across the Middle East and North Africa (MENA) region. Using regional case studies, it demonstrates how MTG supports the monitoring of convection, dust storms, fog, tropical cyclones, fires, and other key atmospheric features. The talk explores operational benefits, practical challenges, and the regional relevance of MTG products—while also recognizing the continued value of Meteosat Second Generation (MSG) data and its important role alongside MTG.
Ivan Smiljanic talks about aerosol detection with the new FCI instrument. Higher number of spectral channels coupled with increased spatial resolution make detection of aerosol better than ever.
Drawing from enhanced spectral coverage of the MTG FCI instrument (comparing with MSG SEVIRI), enhanced capabilities of aerosol detection are expected. Major improvements are during daytime related to existence of new channels with shorter wavelengths (namely VIS0.44 and VIS0.55), and to existence of new NIR1.38 that is specifically designed for detection of higher level features (including aerosols). During night time (ie 24h), enhanced spatial and radiometric resolution of IR channels offer better sensitivity to aerosols with larger particles like dust, volcanic ash or even a pollen.
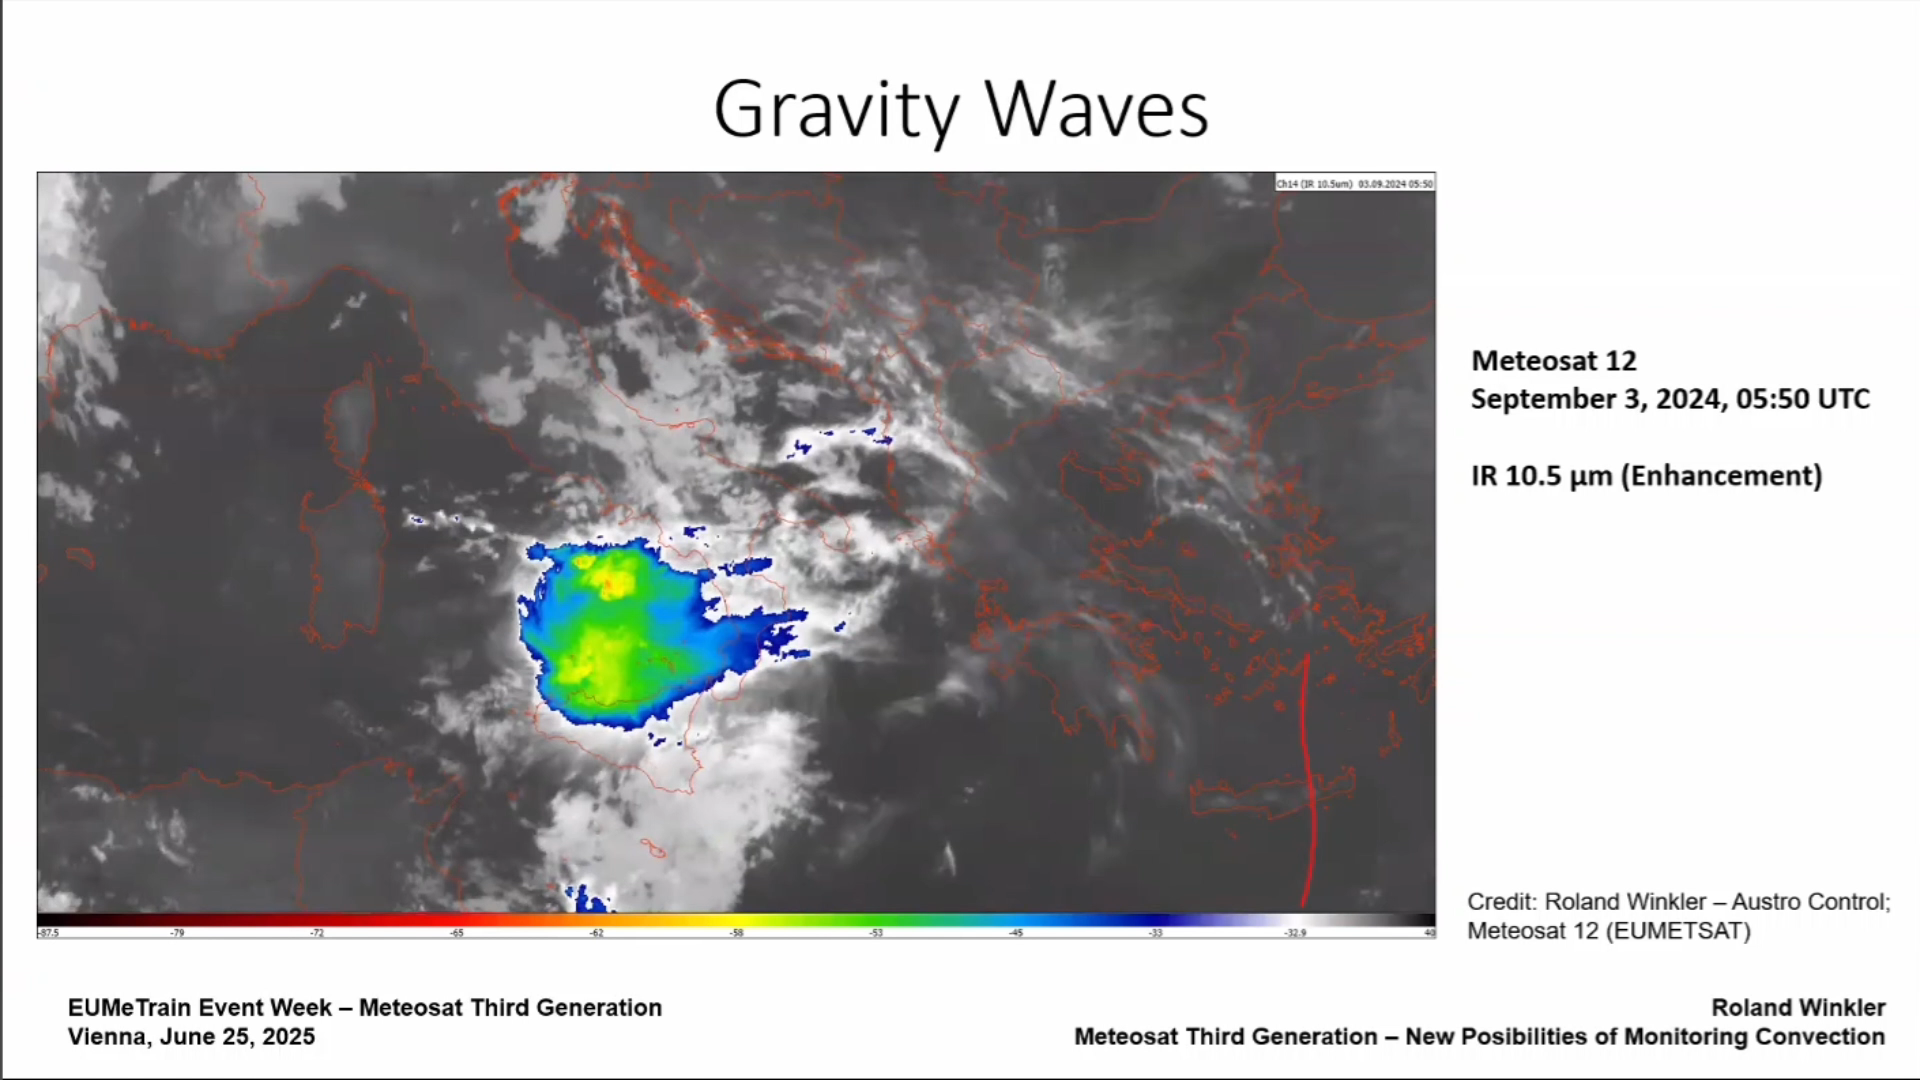
Roland Winkler shows examples of overshooting tops, gravity waves etc. using MTG FCI products.
Satellite images are now indispensable for analyzing storms and the atmospheric physical processes that emanate from them. New satellite generations, such as the third generation of European weather satellites, support this analysis with their higher spatial and temporal resolutions, as well as new spectral channels. This presentation highlights these new possibilities using examples using old and especially new spectral channels or channel combinations (RGBs and images in the blended technique).
Go to lecture slides
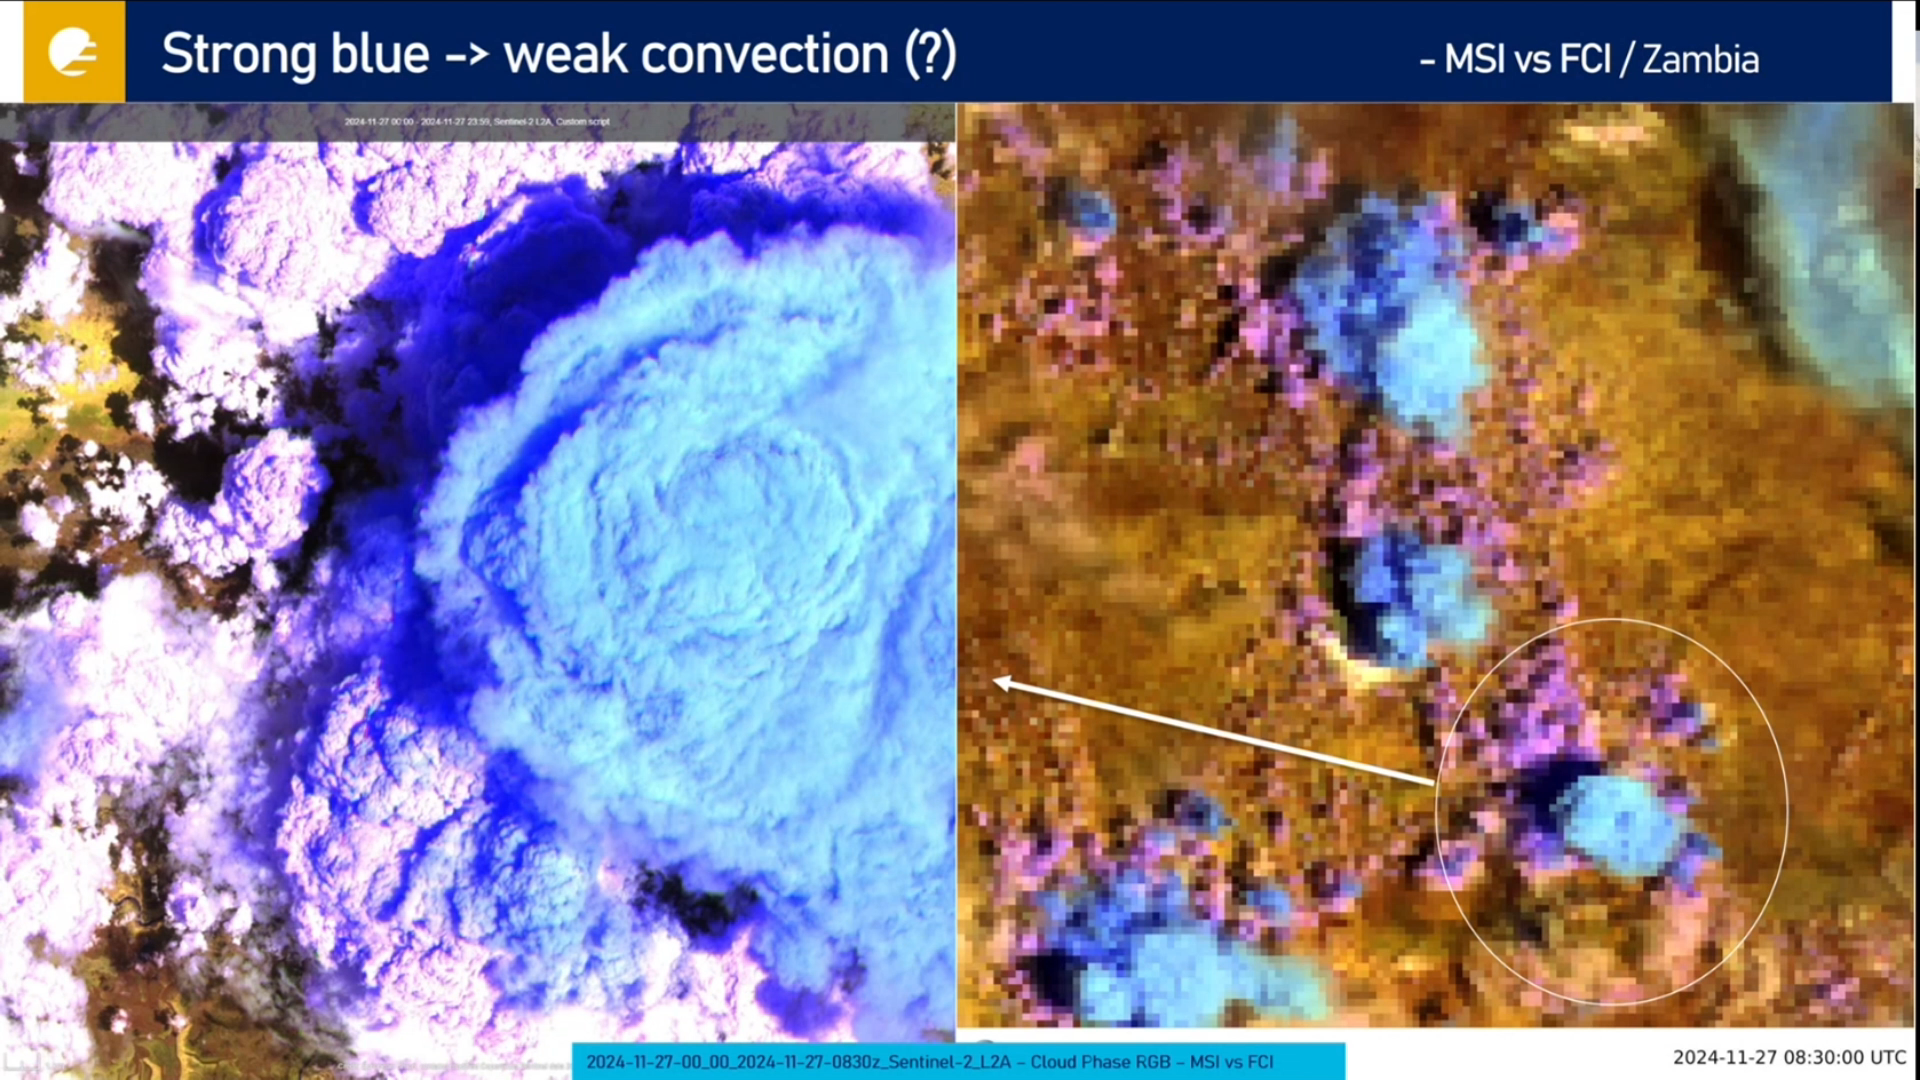
Andreas Wirth shows the benefits and drawbacks of new RGBs that are now possible with FCI and how to use them.
Besides better temporal and horizontal resolution, the FCI sensor on-board MTG-I also offers additional spectral bands mainly in the short infrared and visible range. These new channels were used to create RGB composite images such as the Cloud Type RGB, the Cloud Phase RGB, the Fire RGB and the True Color RGB. This presentation will highlight the benefits coming from these new RGB types. Application examples will be given and the impact of the new channels will be explained. The focus of this presentation will lay on the information provided by the new RGB types as well as on the limitations and challenges forecasters are confronted with when using them.
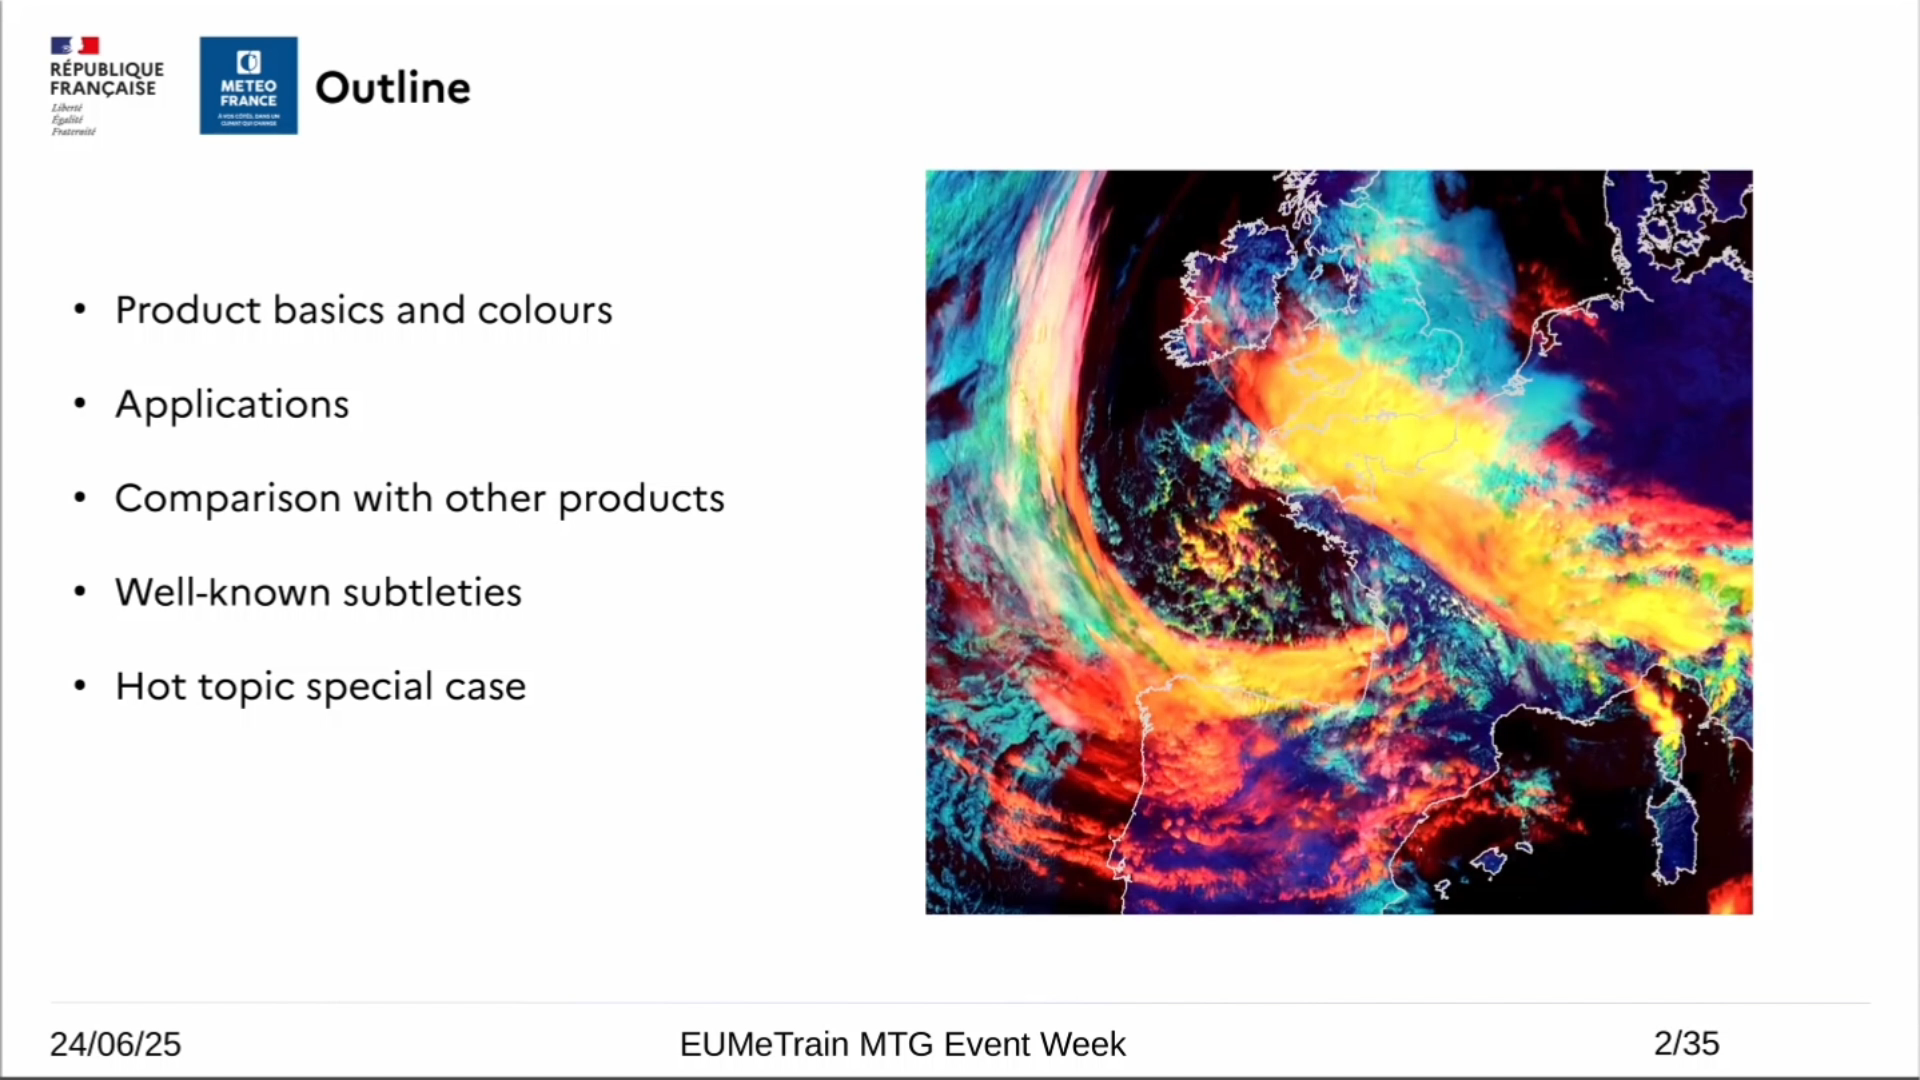
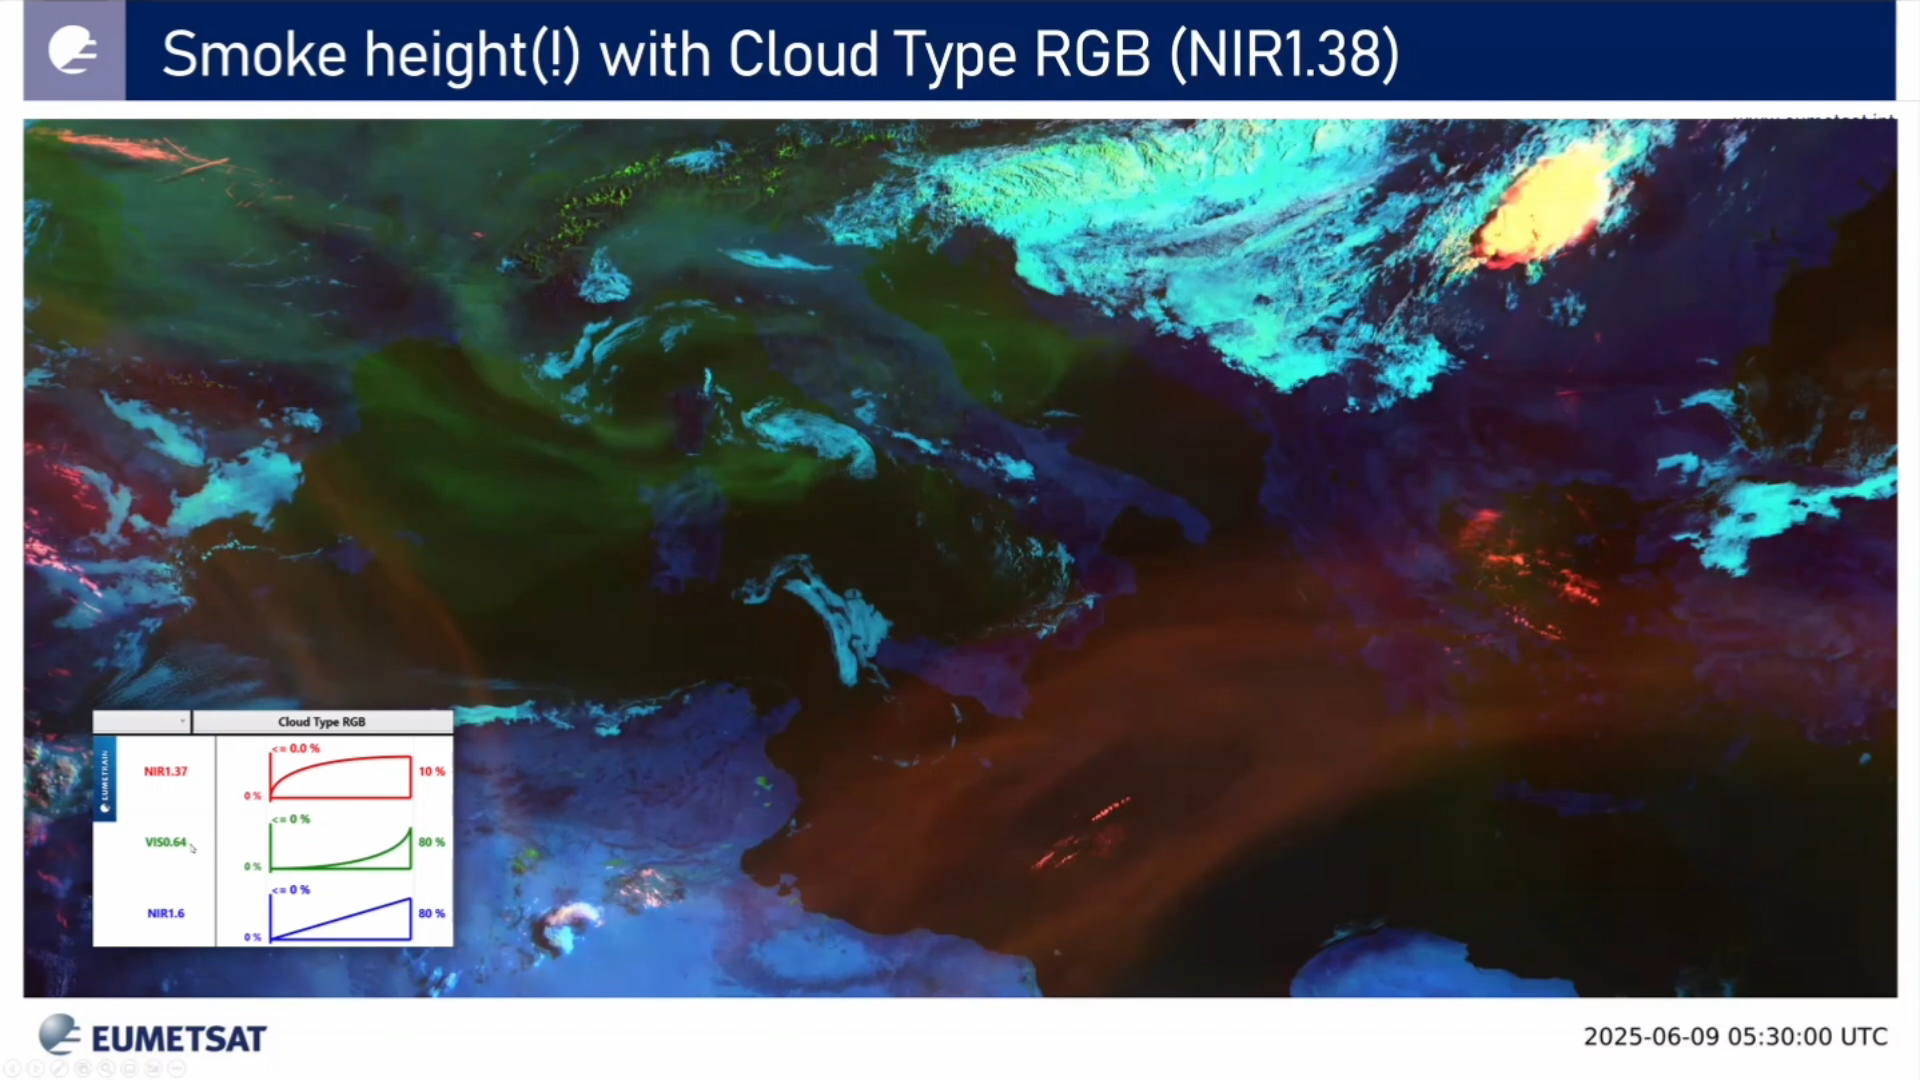
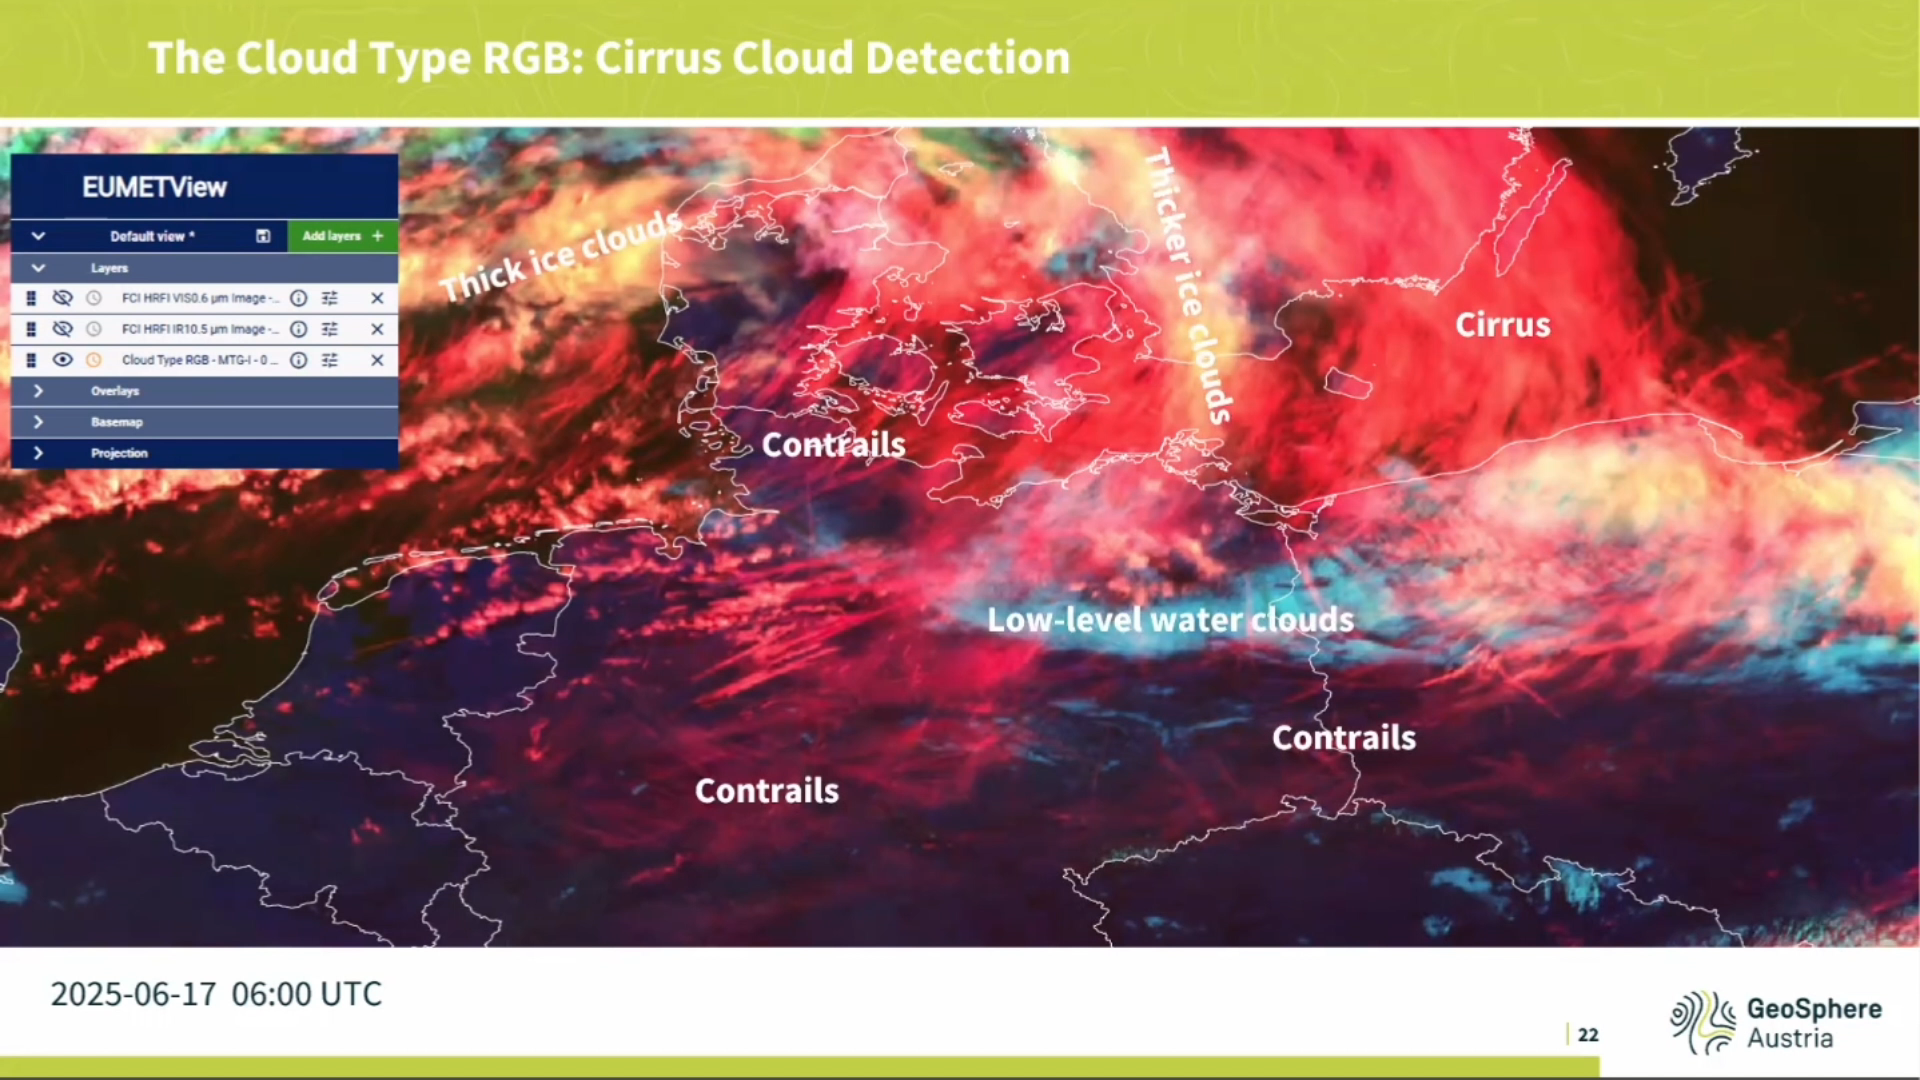
Roxane Desire gives a complete overview on the new Cloud Type RGB.
While it may seem simple to use at first glance, with its very distinctive and contrasting colors, the Cloud Type RGB product is nonetheless full of subtleties. A review of everything it is capable of and a comparison with other products.
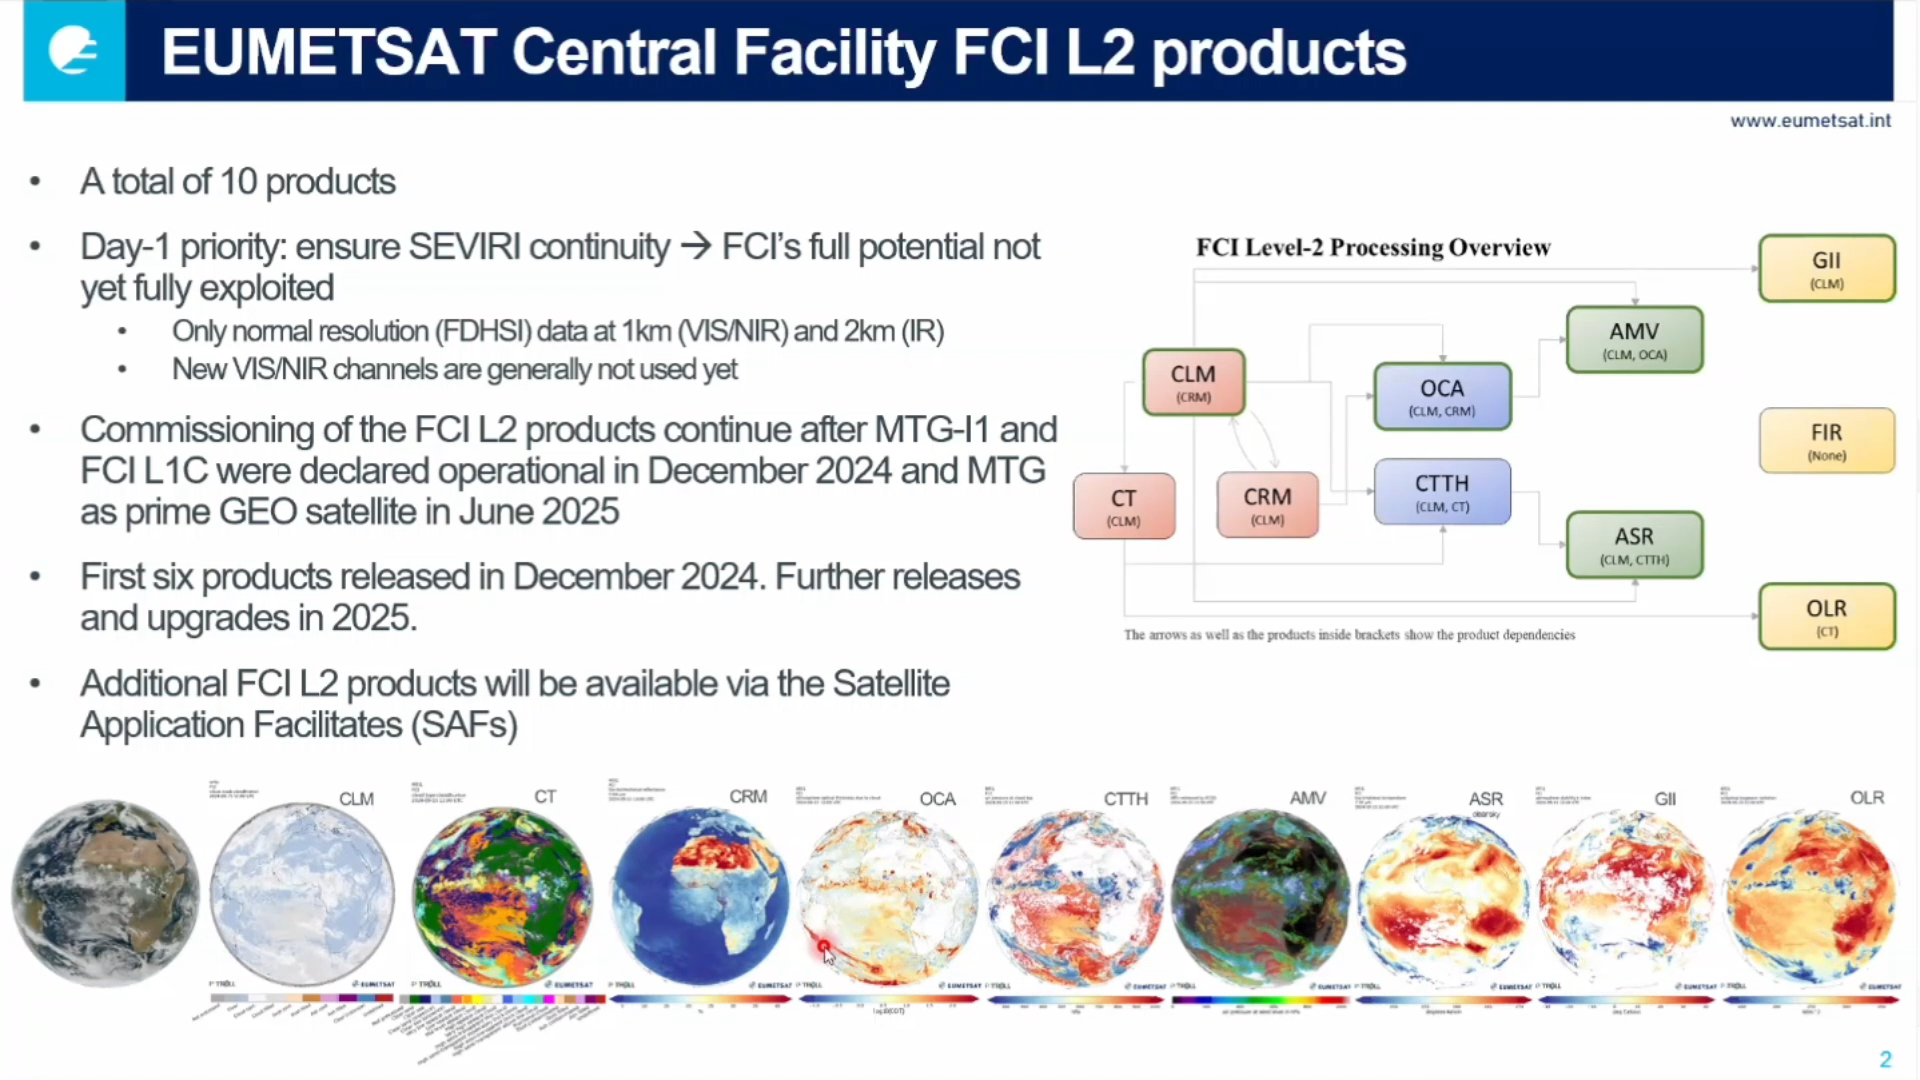
Johan Strandgren talks about the EUMETSAT Level-2 Products.
This presentation outlines the MTG-I FCI Level-2 (L2) products generated at the EUMETSAT Central Facility and disseminated to users. These products support applications such as cloud analysis, atmospheric instability, fire detection, atmospheric motion vectors, and all-sky radiances, serving data assimilation, nowcasting, and research communities. We will present early validation results from the ongoing L2 commissioning and plans for future enhancements.
Vesa Nietosvaara gives an overview on the MTG programme and discusses FCI instrument and it's uses onboard the MTG-I1.
The complete constellation of Meteosat Third Generation (MTG) consists of three spacecraft: two imaging satellites and one sounding satellite. The first imaging satellite, MTG-I1 is now operational under the name Meteosat 12. The satellite carries two important instruments – Flexible Combined Imager (FCI), a successor of SEVIRI on MSG, and a Lightning Imager (LI), the first space-based instrument monitoring lightning occurrence over Europe, Africa and South America from geostationary orbit. In this talk, we will focus on the FCI and how it can help monitoring the weather and improving nowcasting. Forecasters will now be able to track the development of storms in near-real time with better accuracy, issue more precise and timely warnings about severe and dangerous weather events but also monitor fog development and dissipation, dust outbreaks, forest fires and many other features.

This guide is about the Cloud Type RGB, a new product for European users of GEO satellite data, which can be constructed using data from the Flexible Combined Imager (FCI) on the Meteosat Third Generation (MTG) satellite system. It uses one of the new FCI channels.
At the time the guide was created, FCI was not yet operational, so the characteristics of the FCI Cloud Type RGB were tested using preliminary commissioning data. Similar features were found as with the proxy data. Some examples created from the FCI preliminary commissioning data are presented in this guide.
The main application areas of the Cloud Type RGB are detection of very thin cirrus and higher-level aerosol clouds, and visual differentiation of cloud types, with some limitations. It can also provide some information about areas with dry airmasses.
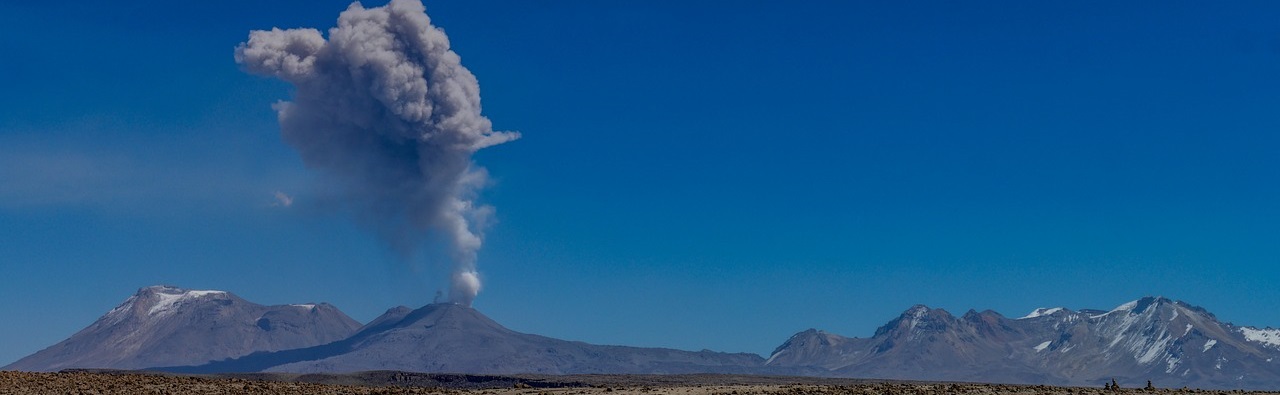
Training module focusing on identification of volcanic ash and sulfur dioxide plumes from satellite imagery.
Volcanic eruptions have a severe impact on human health, economy and traffic. They regularly cause natural disasters such as tsunamis and lava flows that are difficult to predict. Volcanic eruptions emit large amounts of gases, ash, and other aerosol particles into the atmosphere. In the short term, volcanic ash plumes have serious impacts on aviation. It is, therefore, very important to monitor the extent, height and duration of such events to properly estimate the impact of eruptions at various spatial and temporal scales, using data from different instruments on different satellites.
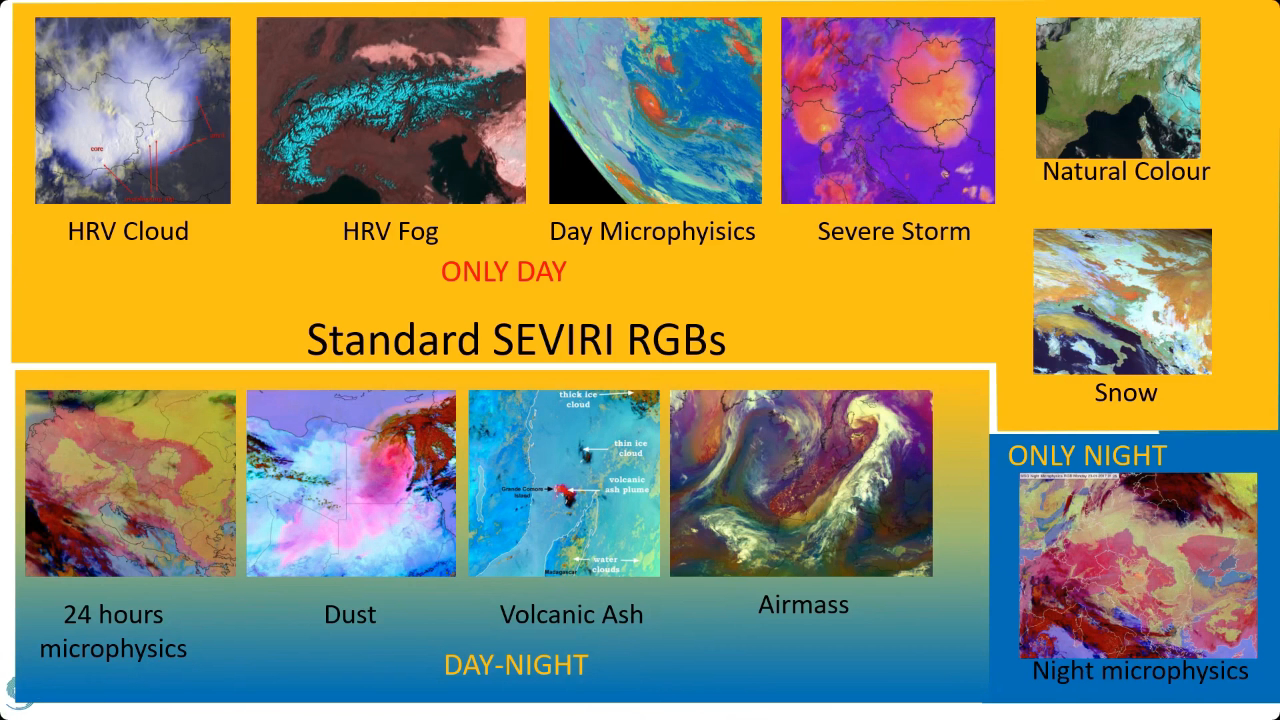
Zsofia Kocsis goes over the priniciples of RGB imagery, reasons for its use and guidelines for their creation.
This presentation covers what are the benefits of working with RGBs compared to single channels satellite data. We will cover how we can create RGBs, what makes an RGB good and we will also talk about what are the standard RGBs and why we like to use them.
Lecture slides