
Marine
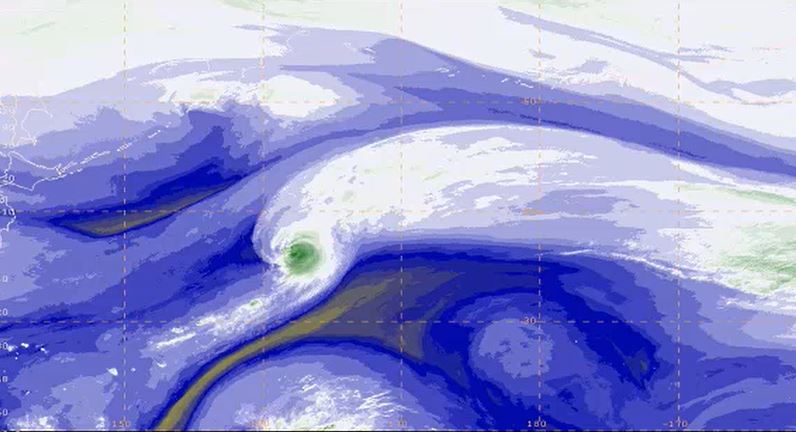
Ioannis Pytharoulis shows past cases of Medicanes, the description of their structure and characteristics.
Length: 50 min
Author: Ioannis Pytharoulis (Aristotle University of Thessaloniki)
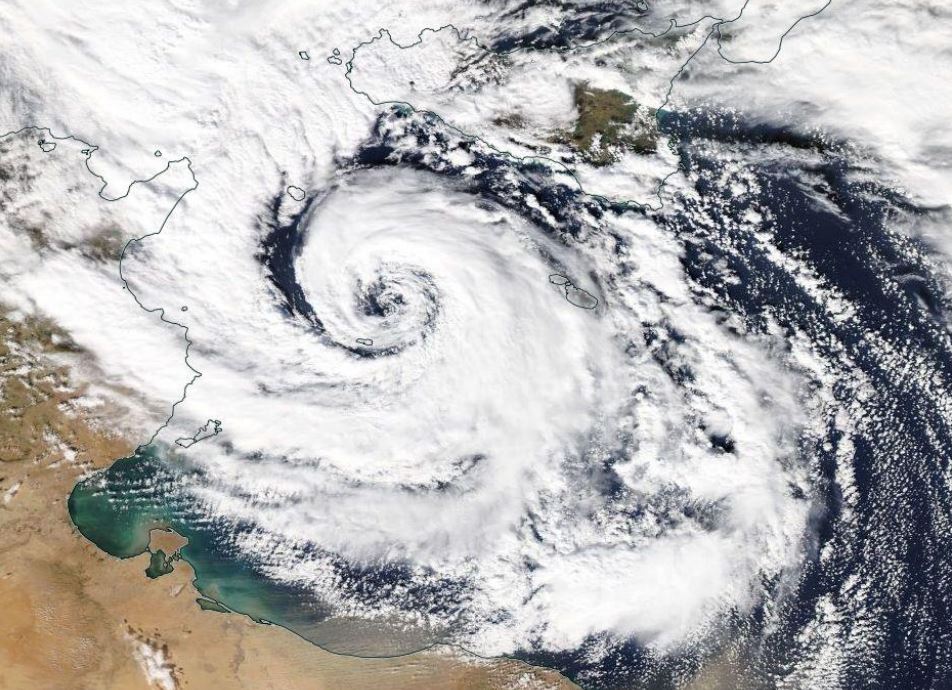
The Mediterranean tropical-like cyclones are intense sub-synoptic maritime lows with strong winds, axisymmetric warm-core structure and tropical cyclone features, such as a cloud-free eye and spiral deep convection. They are frequently referred to as medicanes (MEDIterranean hurriCANES) due to their resemblance to tropical cyclones. Despite their low frequency (of about 1.1-1.6 systems per year), medicanes constitute a serious natural hazard to life, property and the environment of the coastal regions of the Mediterranean basin and the Black Sea. Their accurate prediction is a challenge for the numerical weather prediction models. This presentation includes some past cases of medicanes, the description of their structure and characteristics, criteria that are used to define them, the development mechanisms, climatology, consequences and finally a detailed case study of medicane Qendresa (November 2014).
Ivan Tsonevsky demonstrates two recent EFI/SOT products for forecasting severe thunderstorms, their interpretation and practical use.
Length: 50 min
Author: Ivan Tsonevsky (ECMWF)
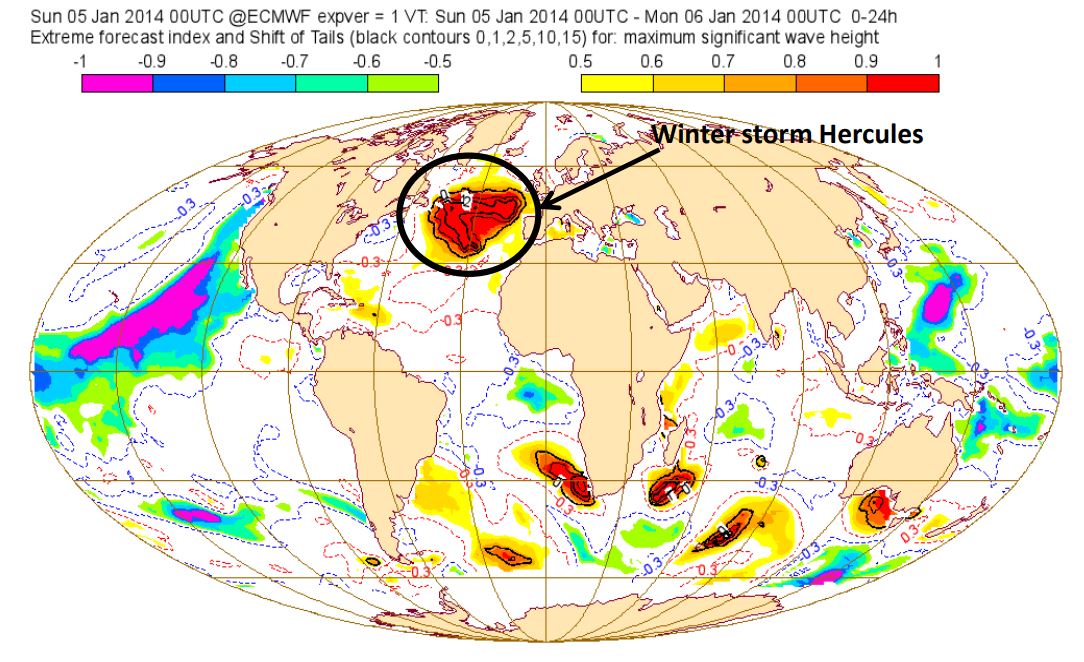
ECMWF provides the Extreme Forecast Index (EFI) and Shift Of Tails (SOT) as tools to help forecasting anomalous and extreme weather by measuring the difference between the Cumulative Distribution Function (CDF) of the real-time ensemble forecast and the model climate (M-climate) CDF. The definition of the EFI and SOT will be presented alongside the M-climate configuration. Verification results and EFI/SOT products will be shown with examples to demonstrate their use and interpretation. Some advantages and limitations of the EFI and SOT will be discussed. Examples focused on the available EFI/SOT for marine forecasting will be given as well. Two recent EFI/SOT products for forecasting severe thunderstorms and their interpretation and practical use will be demonstrated.
Zorana Jelenak describes how altimeters work, how data is used for everyday marine forecasting at NOAA and assimilation.
Length: 60 min
Author: Zorana Jelenak (NOAA)
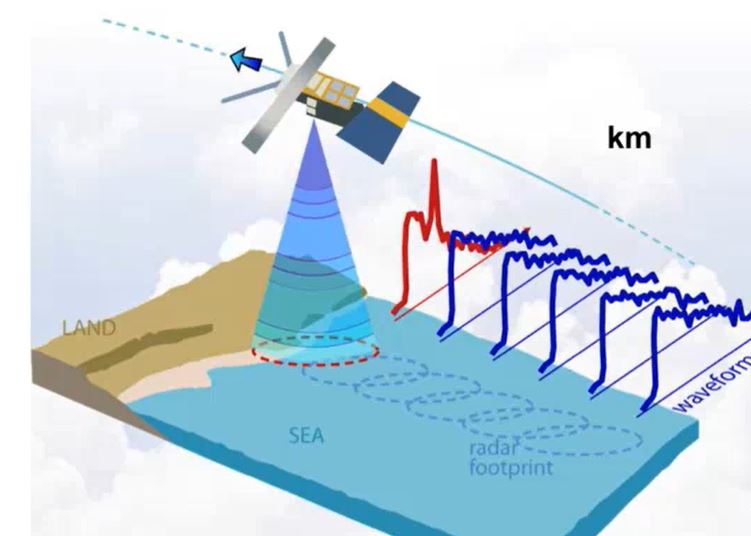
Altimeter data have been used to produce maps of sea surface height, geostrophic velocity, significant wave height and wind speed. This information is of proven use to mariners as well as to the scientific community. Uses of the data include commercial and recreational vessel routing, ocean acoustics, input to geographic information systems developed for the fishing industry, identification of marine mammal habitats, fisheries management and monitoring ocean debris. Such information is accessible in near-real time (within 3 to 48 hours) and to improve weather forecasting models by assimilation. 25 years of data makes it possible to study the whole ocean or regional areas for offshore industries or navigation. In hurricane studies altimetry measures very high waves and strong winds, but also helps identify sea surface height anomalies which can be used as proxies of the warm currents - hurricanes energy source. The lecture will describe how altimeters work, how data is used for everyday marine forecasting at NOAA and assimilation, devoteting special attention to data accuracy and limitations.
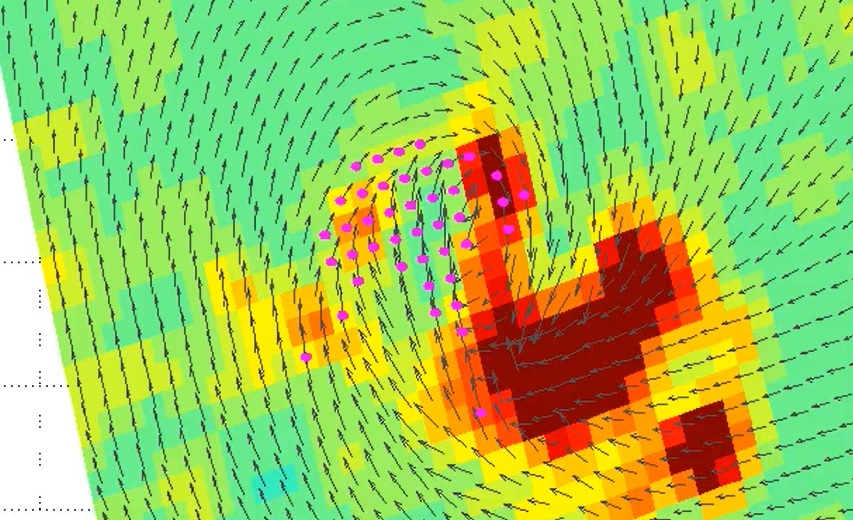
Jean Bidlot gives an overview on the ECMWF wave model products.
Length: 50 min
Author: Jean Bidlot (ECMWF)
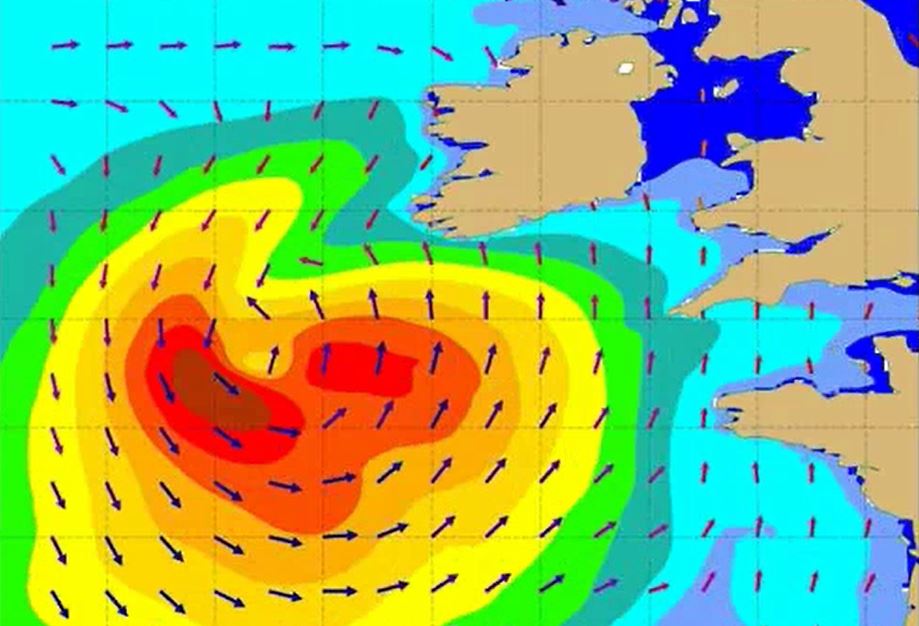
Wave models are able to give a very detailed description of the conditions at the surface of the oceans. The mean sea state is fully described by the 2d wave spectrum. This detailed description is however not always very practical and the bulk of the information contained in the 2d spectrum is usually reduced in the form of a set of integrated parameters, from a simple few such as significant wave height, mean wave direction and mean wave period, to more sophisticated parameters that described distinct part of the wave fields. Recent advances in the understanding of wave dynamics have lead to the development of new set of parameters that give information on the possible largest single wave that might exist over a certain area within a certain time frame. It is now possible to describe the sea state with different level of complexity depending on the user needs.
Michael Folmer presents examples of relevant applications of Sentinel-3A data.
Length: 55 min
Author: Michael Folmer (NOAA)
The EUMETSAT-operated Copernicus Sentinel-3A satellite has been providing near-real time data to the marine community since mid-2016, and will be soon be joined in operations by its sister, Sentinel-3B. This presentation will give an overview of the available Sentinel-3 marine products, with a primary focus on data streams associated by the altimeter (SRAL) and sea surface temperature radiometer (SLSTR). Examples of the relevant applications will be presented, along with a discussion of how users can best access data and monitor its quality.
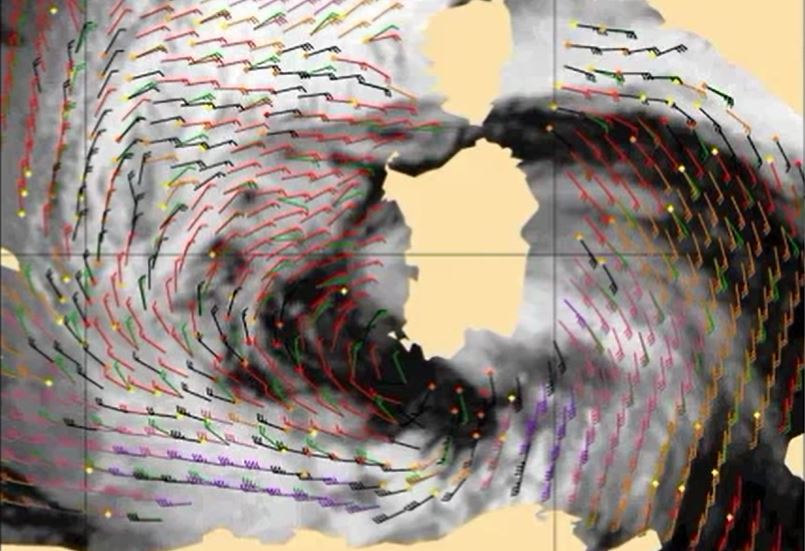
Ad Stoffelen focuses on scatterometer winds, how good they are and what aspects need attention.
Length: 60 min
Author: Ad Stoffelen (KNMI)
Winds over sea are essential for marine forecasting and used in nowcasting and numerical weather prediction (NWP) to aid in off-shore activities (energy sector, transport, fisheries and recreation), particularly to secure safety of life and property. Winds over sea are observed by satellites and available from NWP model forecasts. Most satellite winds over sea are provided by scatterometers; they provide swath fields of both wind speed and wind direction from polar satellites. Currently, winds from EUMETSAT’s MetOp-A, MetOpB and the Indian ScatSat-1 are operationally available and provide good coverage around 9:00 and 21:00 local solar time (LST). Very soon they will be complemented by a few more. The lecture focuses on what scatterometer winds really represent, how good they are and what aspects need attention when applying these winds in your routine operations alongside with NWP model winds.
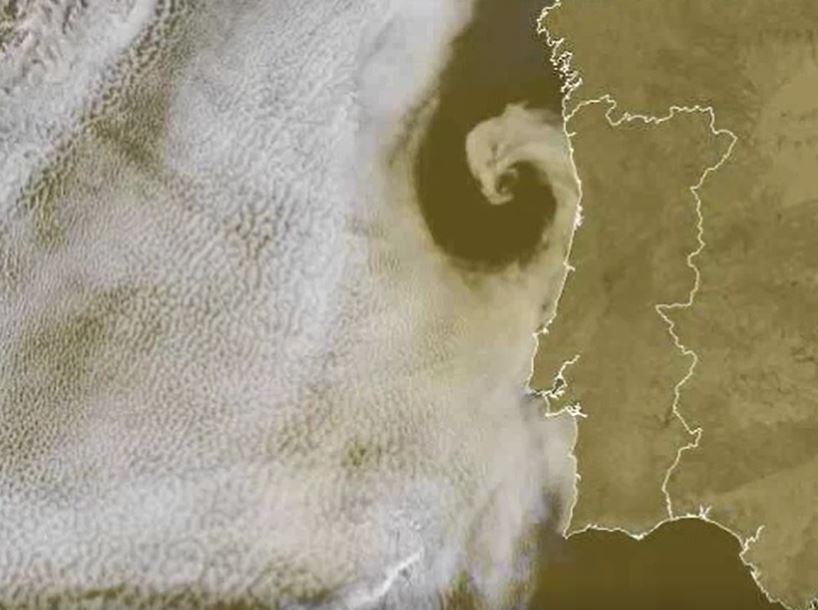
Hans Peter Roesli discusses various satellite pattern observed over the seas.
Length: 40 min
Author: Hans Peter Roesli, Switzerland
Sea and coastal areas have radiative characteristics that enhance the identification of non-meteorological features like smoke, ash or dust. Maritime inversions and atmospheric interchanges along coastal areas engender particular cloud patterns like Bénard cells, Kármán vortex streets, undular bores, ship trails, (extra) tropical cyclones or sea breeze fronts. Examples of such features will be shown and discussed, using imagery from geostationary and polar weather satellites.
Presentation 3 in the Marine Forecasting Course 2017
Length: 112 min
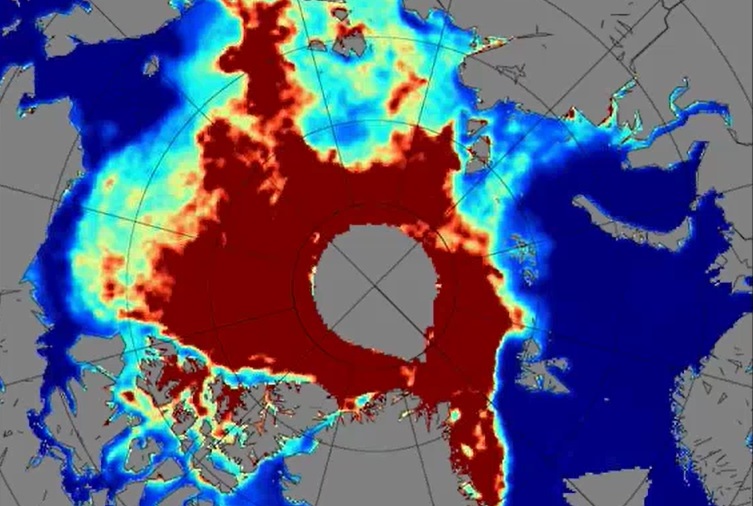
Author: Rasmus Tonboe (DMI)
Sea ice has always posed a threat to ships sailing through the northern Atlantic and also the ice was a clear indication of climate changes since the start of satellite observations in the 1970s. Satellites from their beginning have helped very much in tracking the condition and movements of ice sheets over North Pole and Antarctica. Sea ice condition, its melting and freezing over again in winter are important to track to see how they are affecting the weather and climate in these parts. Many satellite products and models were developed to distinguish thin one year ice from the thicker multiyear ice and to determine the actual thickness of these sheets. Further questions like how does ice affect radiation, how does snow affect the ice and what is the quality of the models that are used, will be answered during this lecture.
Presentation 2 in the Marine Forecasting Course 2017
Length: 117 min
Author: Ad Stoffelen
The lecture deals with modelled winds and winds derived from instruments onboard satellites like Metop-A and Metop-B in low orbits around the Earth (polar orbits). Today's models are evolving at a rate that is faster than the increase of density of observations and that presents a problem for forecasts. Here stands the question 'Will meteorology continue to develop and improve?'. The lack of observed data is thus filled with the data from satellites, although this data also has its own constraints due to the way it is derived. In the lecture the characteristics of the satellites carrying instruments for measuring winds and waves will be explained and the logic behind the calculations of winds using satellites will be discussed.
Scatterometer data are used for many different purposes in marine meteorology, e.g. warnings, enhancement of situational awareness for winds, monitoring of storm evolution, low pressure systems, etc., therefore marine forecasters using the products about wind and waves from satellites will be instructed how to use them and when to combine the data with model outputs.
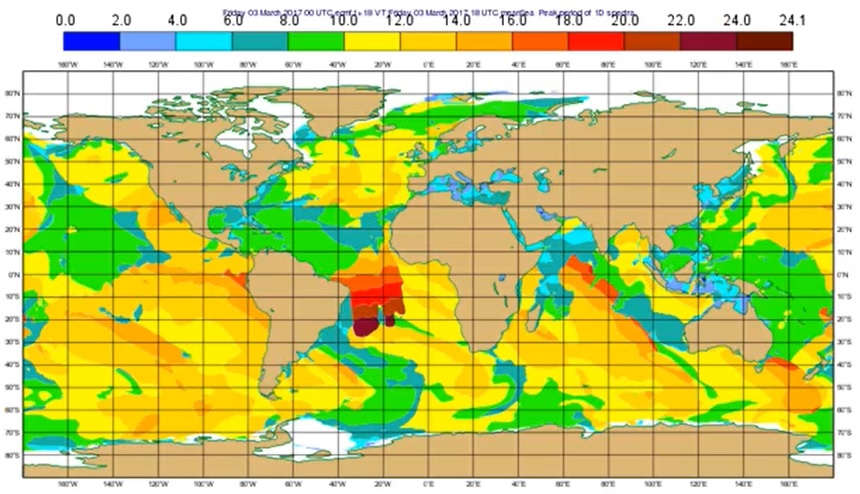
Presentation 1 in the Marine Forecasting Course 2017
Length: 59 min
Author: Jean Bidlot (ECMWF)
Starting from the basics, this lecture introduces the students to wave model products (e.g. wave height and mean propagation direction), wave spectrum analysis, long swell forecasts, extreme forecast index etc. Since these outputs (alongside data from the buoys) are the basic material marine forecasters have for forecasting and nowcasting waves in seas and especially in oceans, explaining the positive and negative sides of model outputs is very important for understanding and thus correctly using the products marine forecasters use.
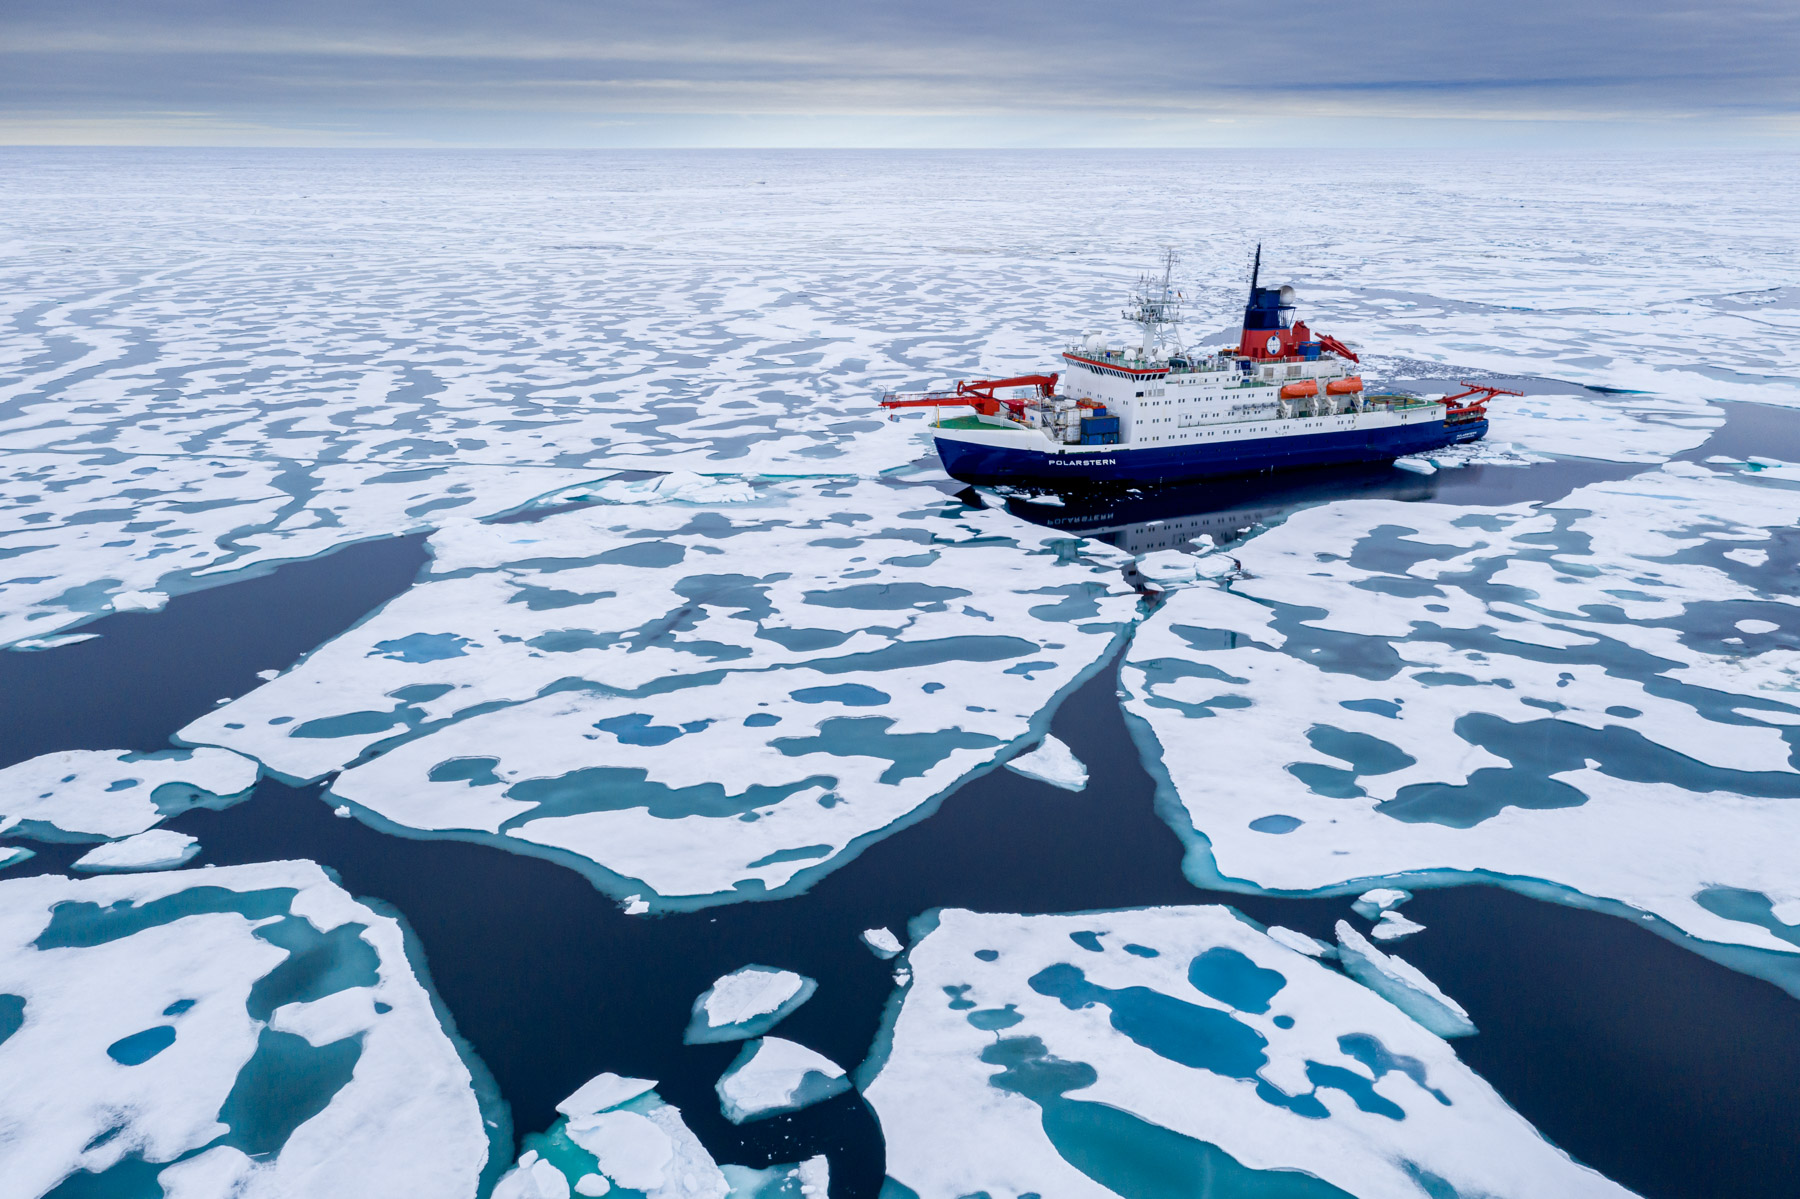
Oliver Sievers and Jens Kieser report from the MOSAiC expedition of the German vessel Polarstern in the Arctic Sea.
Meteorologists and weather technicans from the German Meteorological Service (DWD) attended the entire MOSAiC expedition, the largest-scale Central Arctic research expedition of all time. They were responsible for permanent weather observations and daily meteorological forecasts for scientists, ship master and officers, as well as helicopter pilots. Our presentation will report about personal experiences of a meteorologist on board of the research icebreaker POLARSTERN, with the focus on the daily work of the forecaster and the importance of using satellite images in Polar Regions.
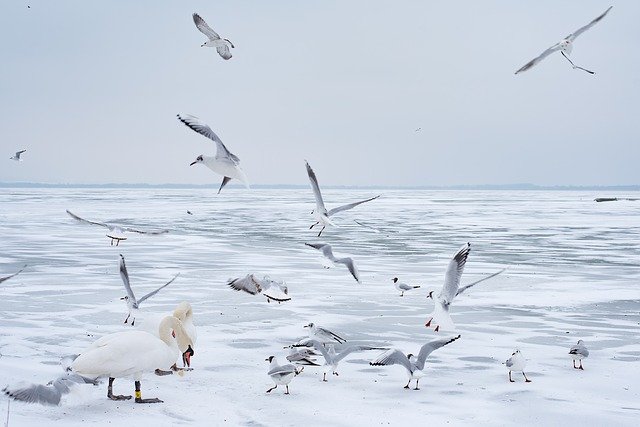
Ákos Horvath talks about ice formation on Lake Balaton and the dependence from local wind and weather.
Lake Balaton is the largest lake in the Carpathian Basin. The shallow lake (with 3.5 m mean depth) responds to the weather rapidly: in hot summers the water temperature increases above 25 °C, and at colder winters thick ice (20-40 cm) appears on the lake surface. The formation of the ice depends very much on the weather. Glassy ice forms when after a cold front passage in the night the wind and waves calm down and the previously mixed up and supercooled water freezes rapidly. During longer cold and windy weather period, ice appears in forms of ice floes, frozen to each other. This presentation tries to give an overview of the metamorphosis and special dynamic of the Balaton ice.