
Weather
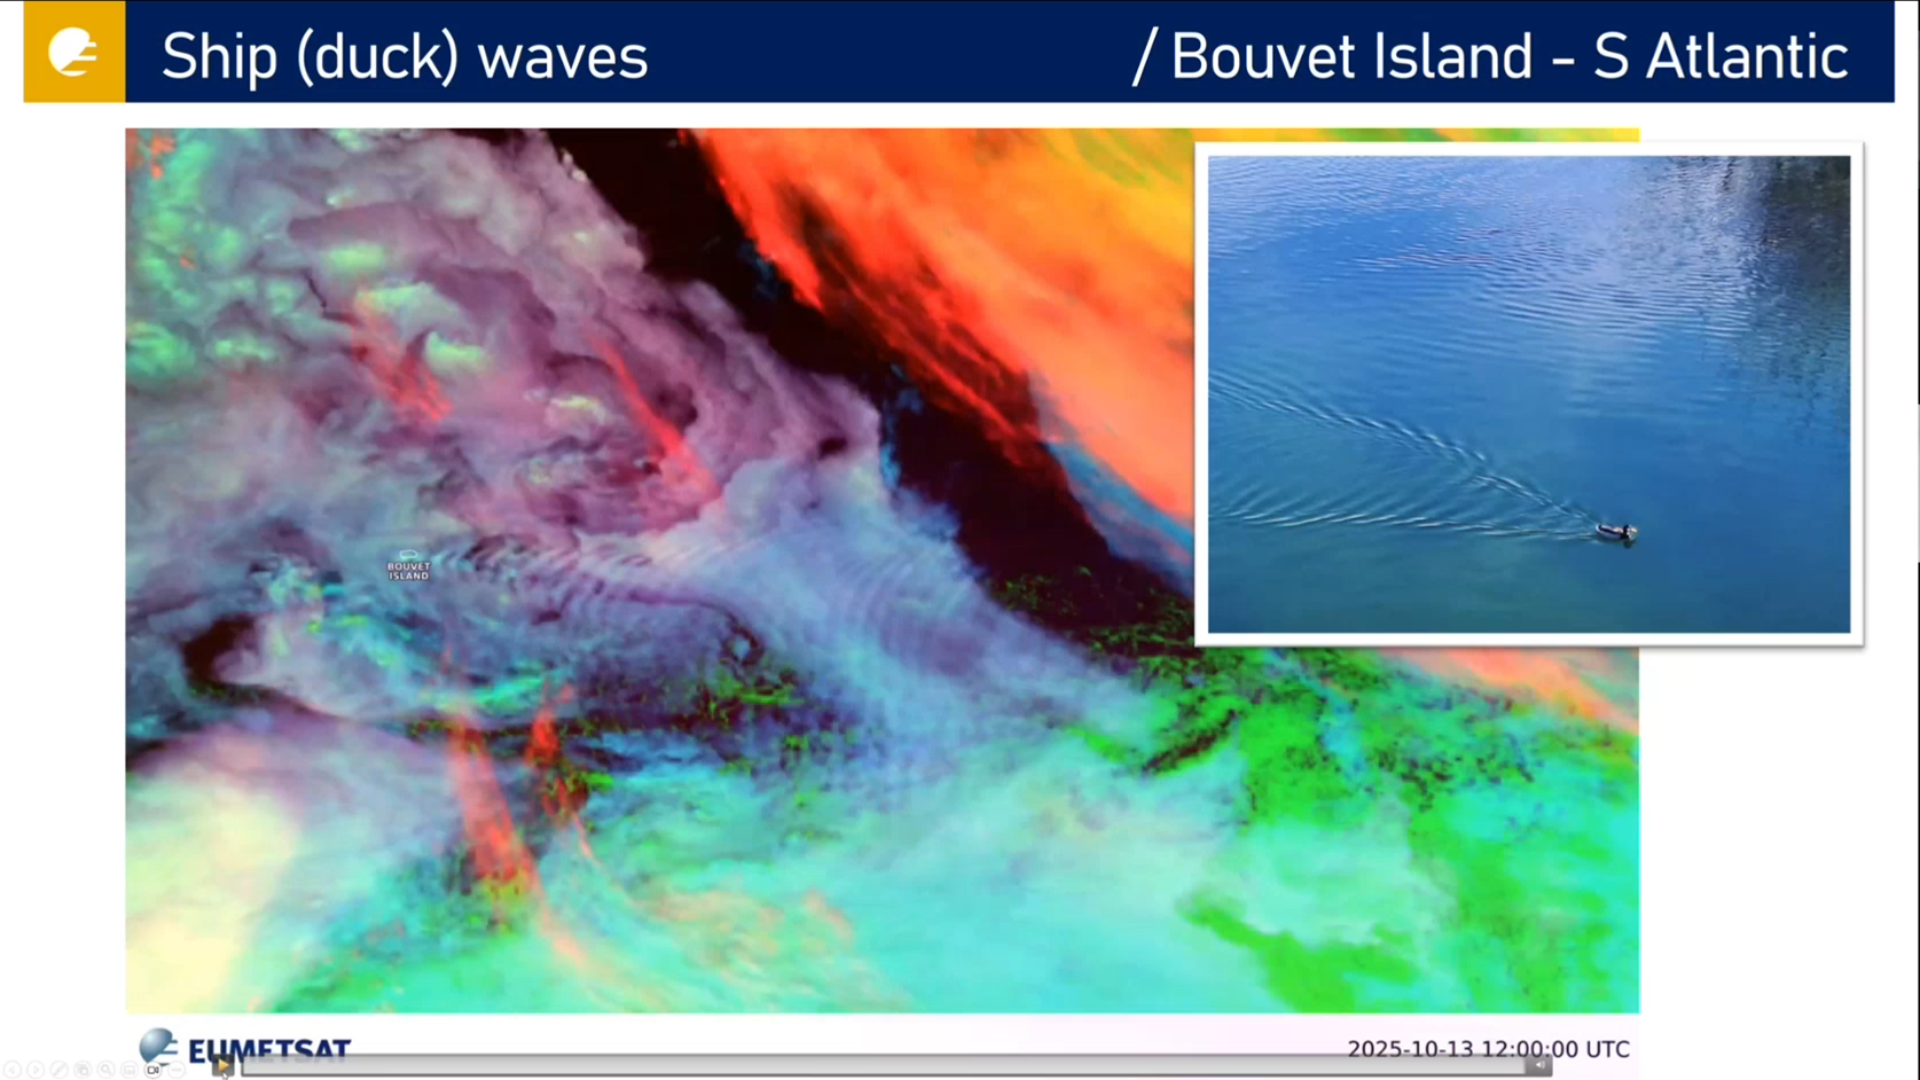
Ivan Smiljanic talks about turbulence and waves, showing many different examples.
Turbulence and waves in the atmosphere, like in other fluids, are signatures of usually dynamically strong processes that cause these disturbances. Also, they can be very dangerous on their own and can propagate to different parts of the atmosphere. Waves and turbulence behave differently in different fluids, and are seen differently with different spectral channels, thus not always easy to identify through satellite data. In this short lecture we will show you how these regular and irregular atmospheric motions are after all captured by advanced FCI instrument, and how that makes our everyday lives safer.
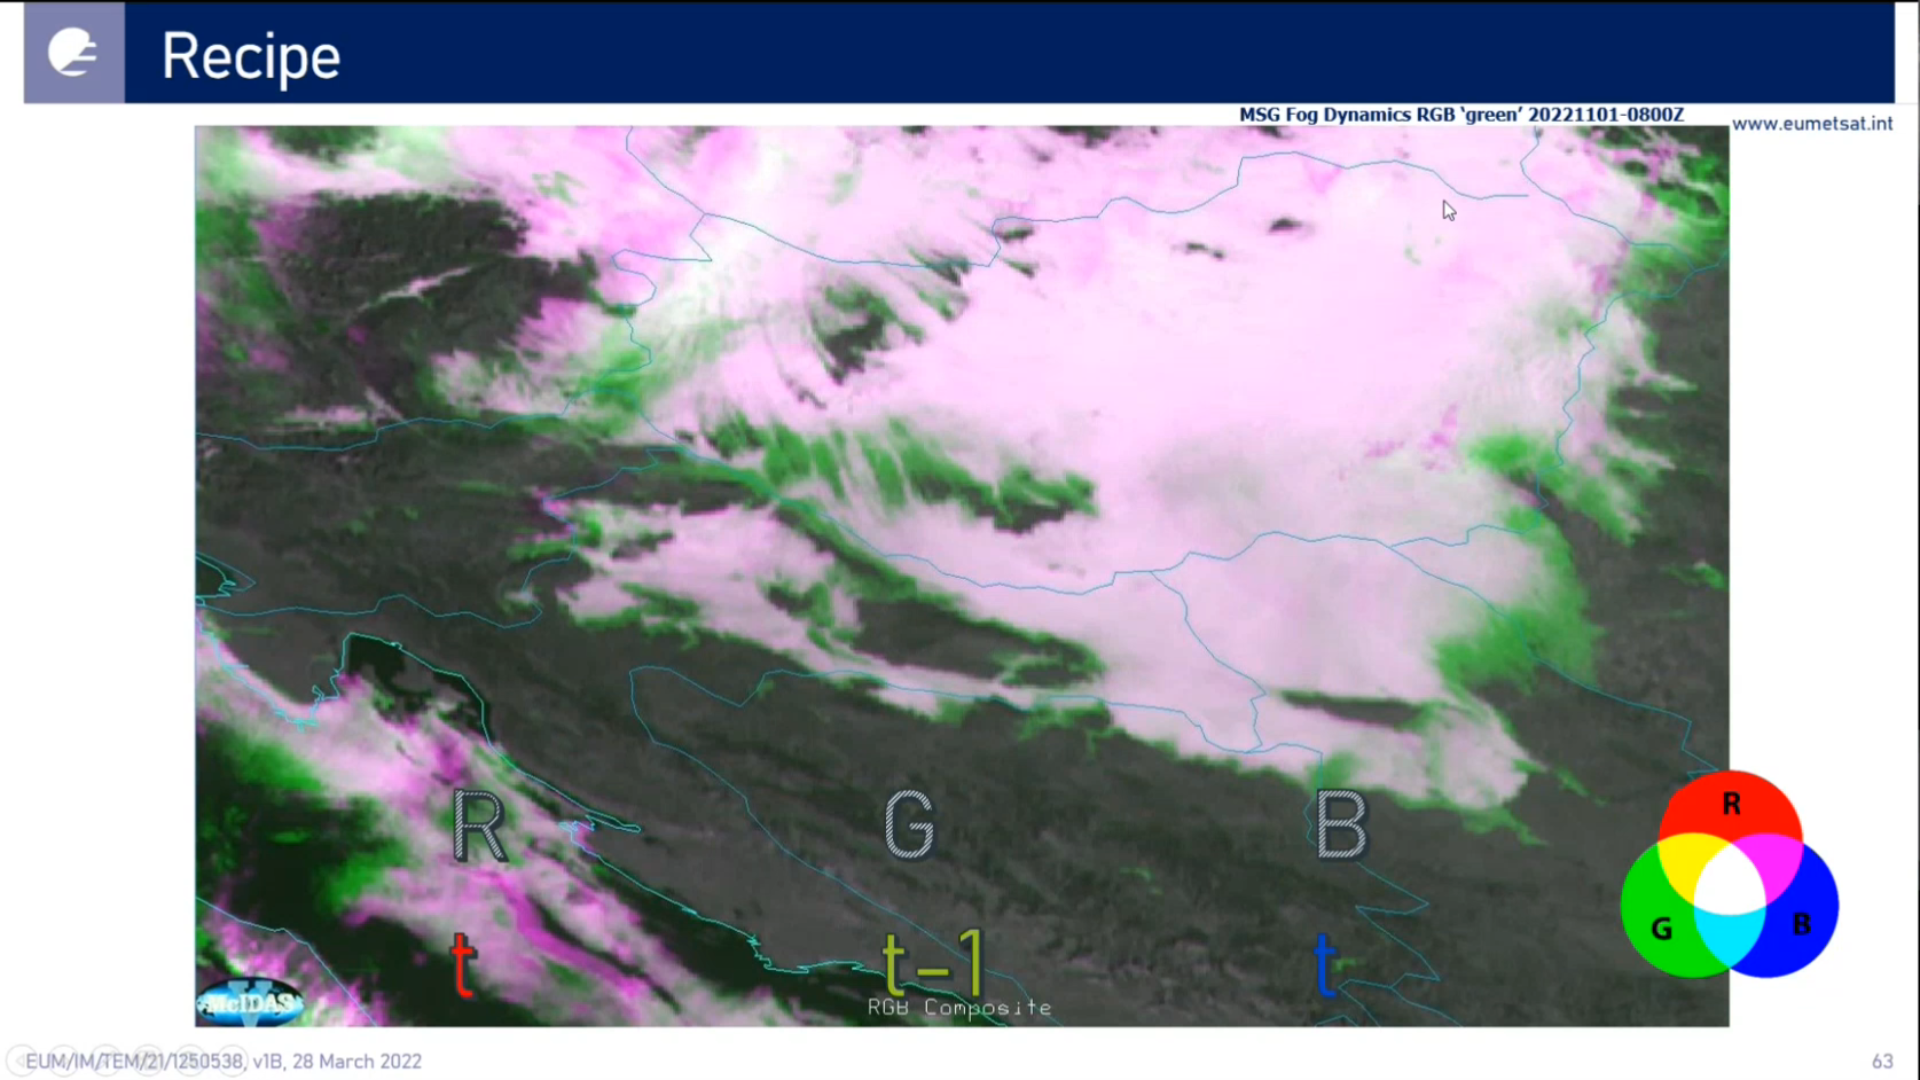
Djorjde Gencic shows the most useful RGBs for fog and low cloud detection, and mentions some "under development" products as well.
This presentation focuses on the detection of fog and low clouds with the Flexible Combined Imager (FCI) on Meteosat Third Generation. It highlights the significant advancements over SEVIRI — particularly the improvements in spatial, temporal, spectral, and radiometric resolution — that greatly enhance the ability to identify, monitor, and characterize fog and low cloud dynamics.
Go to lecture slides
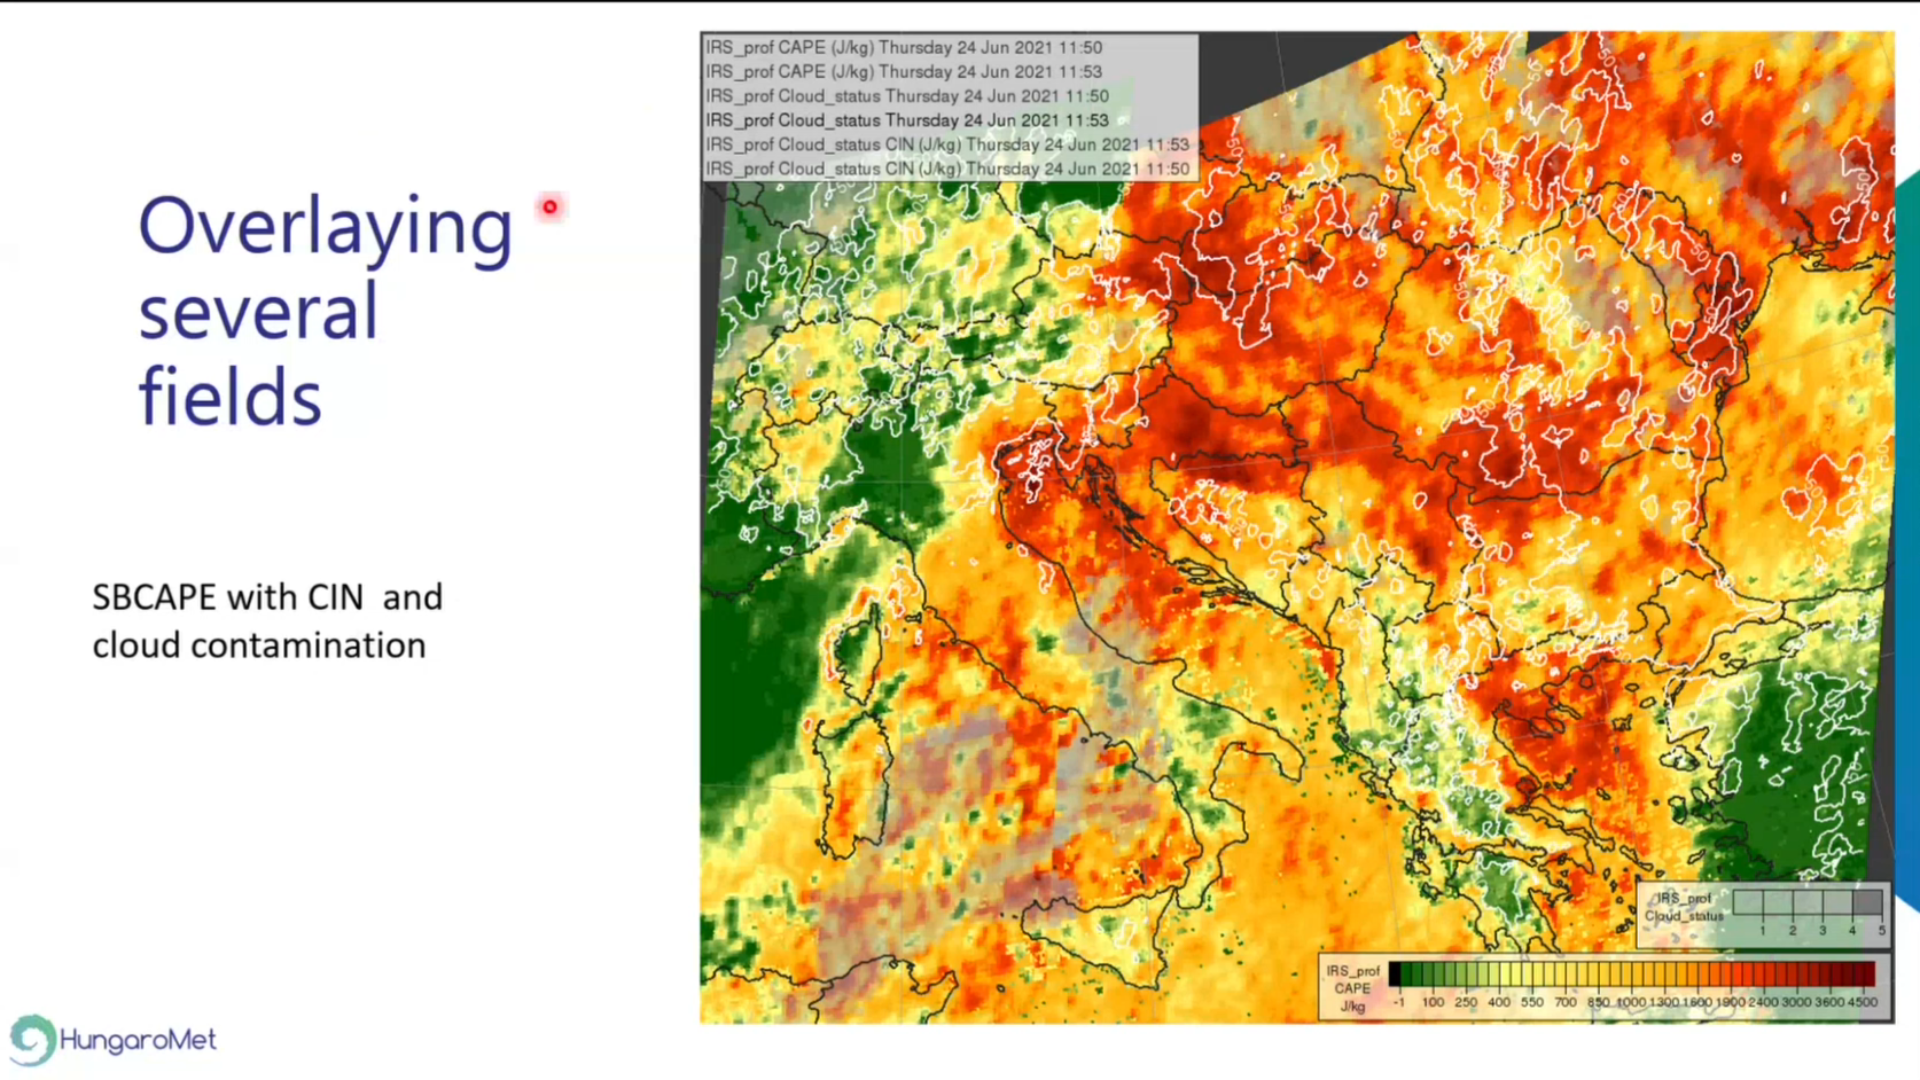
Zsofia Kocsis shows a wide range of possible visualizations using IRS Level-2 (L2) test data.
The Infrared Sounder (IRS) onboard the MTG-S1 is the first geostationary sounding instrument to perform measurements over Europe with a temporal resolution of 30 minutes. EUMETSAT will provide temperature and water vapour profiles, together with instability indices derived from these measurements, thereby offering complementary information to Numerical Weather Prediction (NWP) model outputs and radiosonde observations for nowcasting applications. In this talk we will show different visualization of IRS Level-2 (L2) test data.
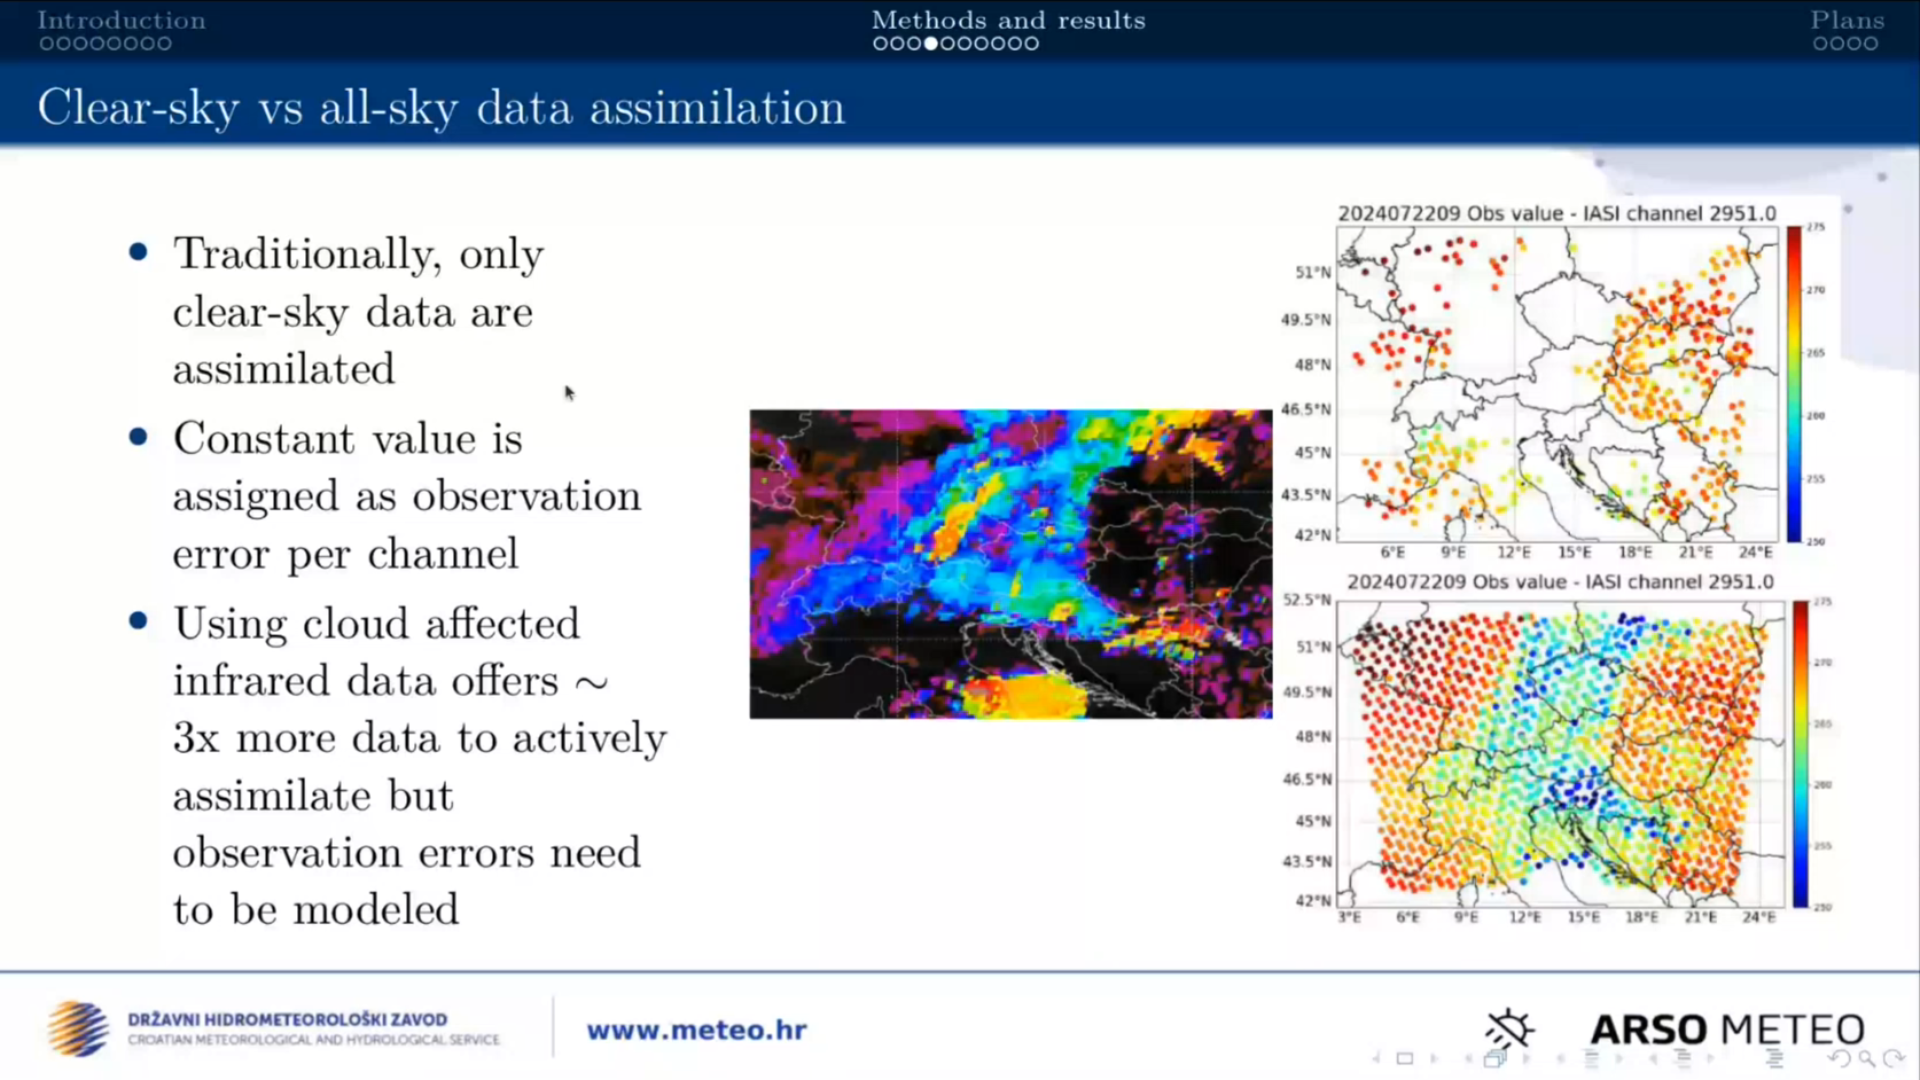
Suzana Panezic talks about using the Okamoto all-sky method in the regional numerical weather prediction model AROME using IASI radiances as proxy.
The InfraRed Sounder (IRS) on MTG-S1 will provide radiance measurements every 30 minutes across 1960 spectral channels, offering new opportunities to improve high-resolution weather forecasts. To fully exploit these data for operational use, assimilation methods are extended beyond clear-sky conditions to include observations affected by clouds. The Okamoto all-sky method is tested in the regional numerical weather prediction model AROME, employing IASI radiances as a proxy until IRS data are available.
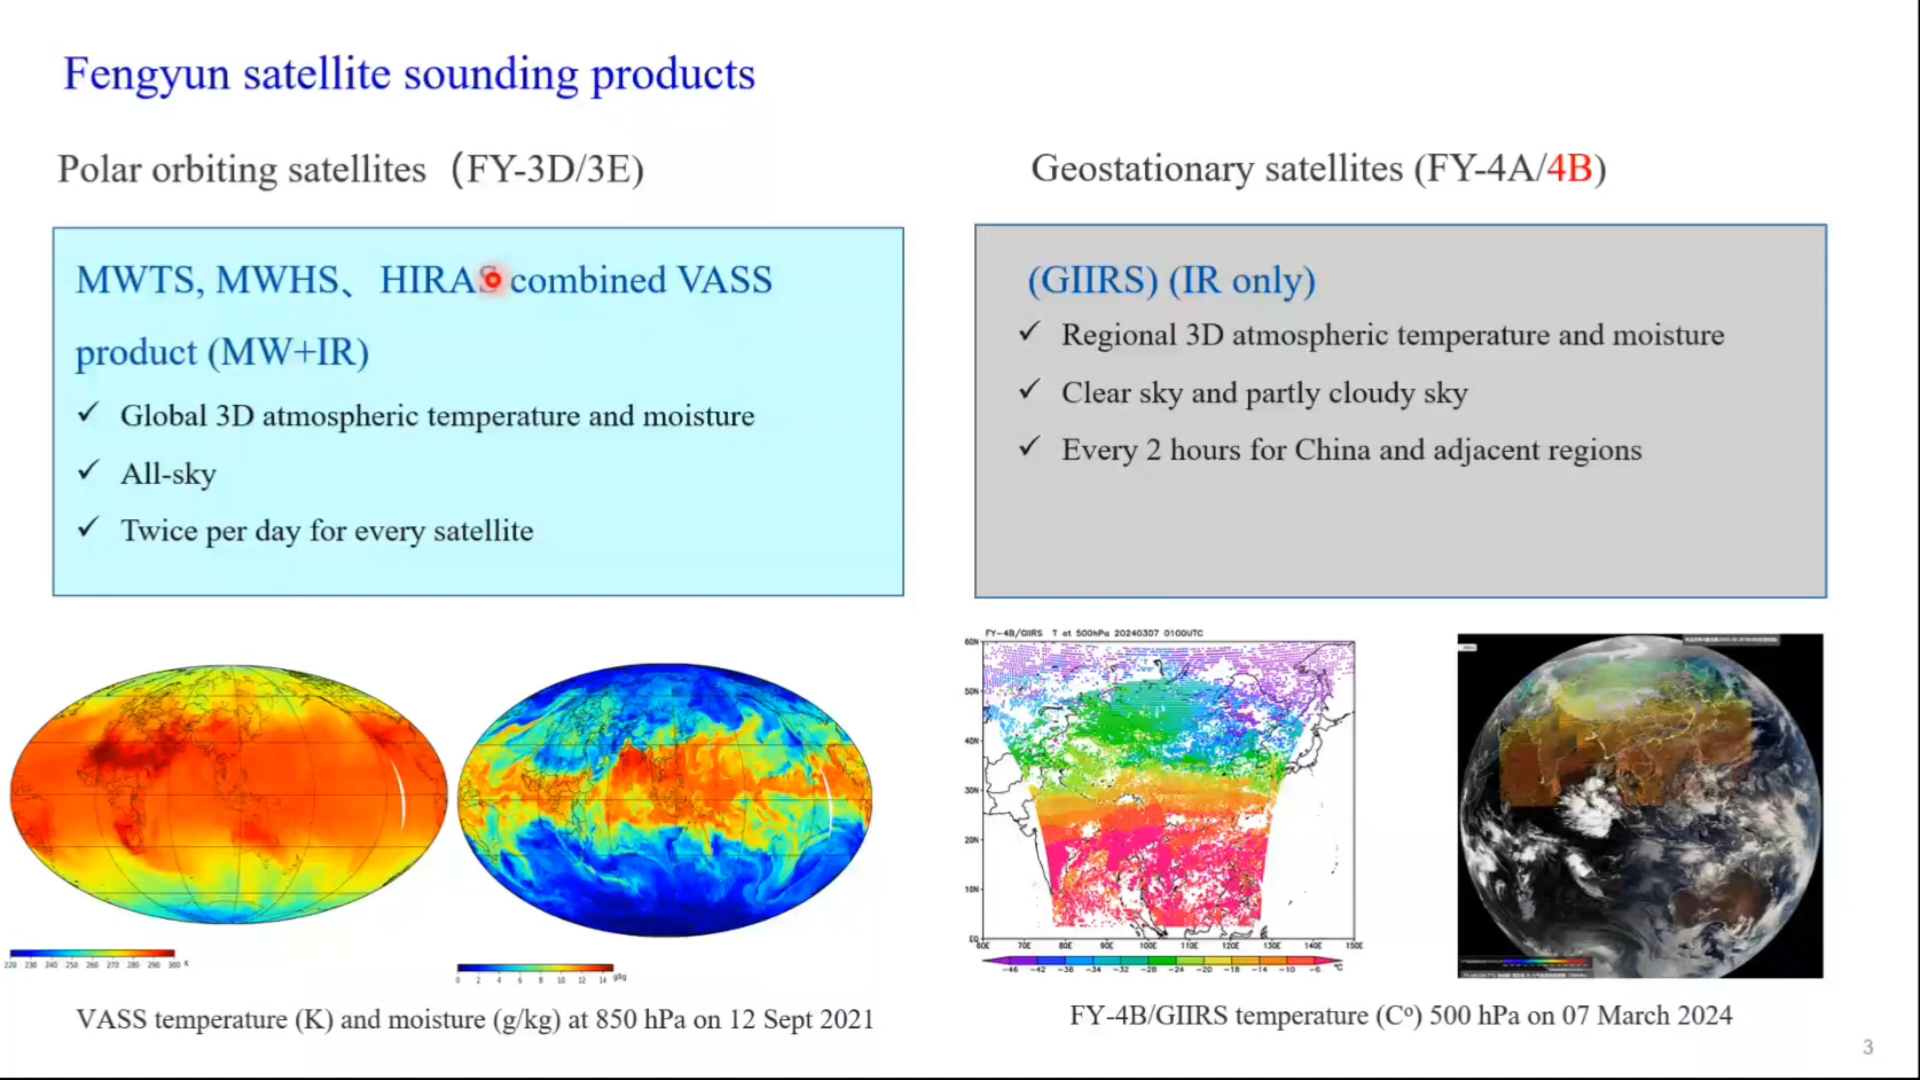
Jun Li shows applications of GIIRS onboard the Fengyun satellite in National Satellite Meteorological Center.
Progress has been made on the applications of high-temporal-resolution GIIRS observations. These include but are not limited to deriving three-dimensional (3D) wind fields for nowcasting and NWP assimilation, trending atmospheric instability for warning in preconvective environments, and monitoring diurnal variation of atmospheric composition. This presentation provides a summary on the current applications of GIIRS, discusses the data processing challenges, and provides perspectives on future development.
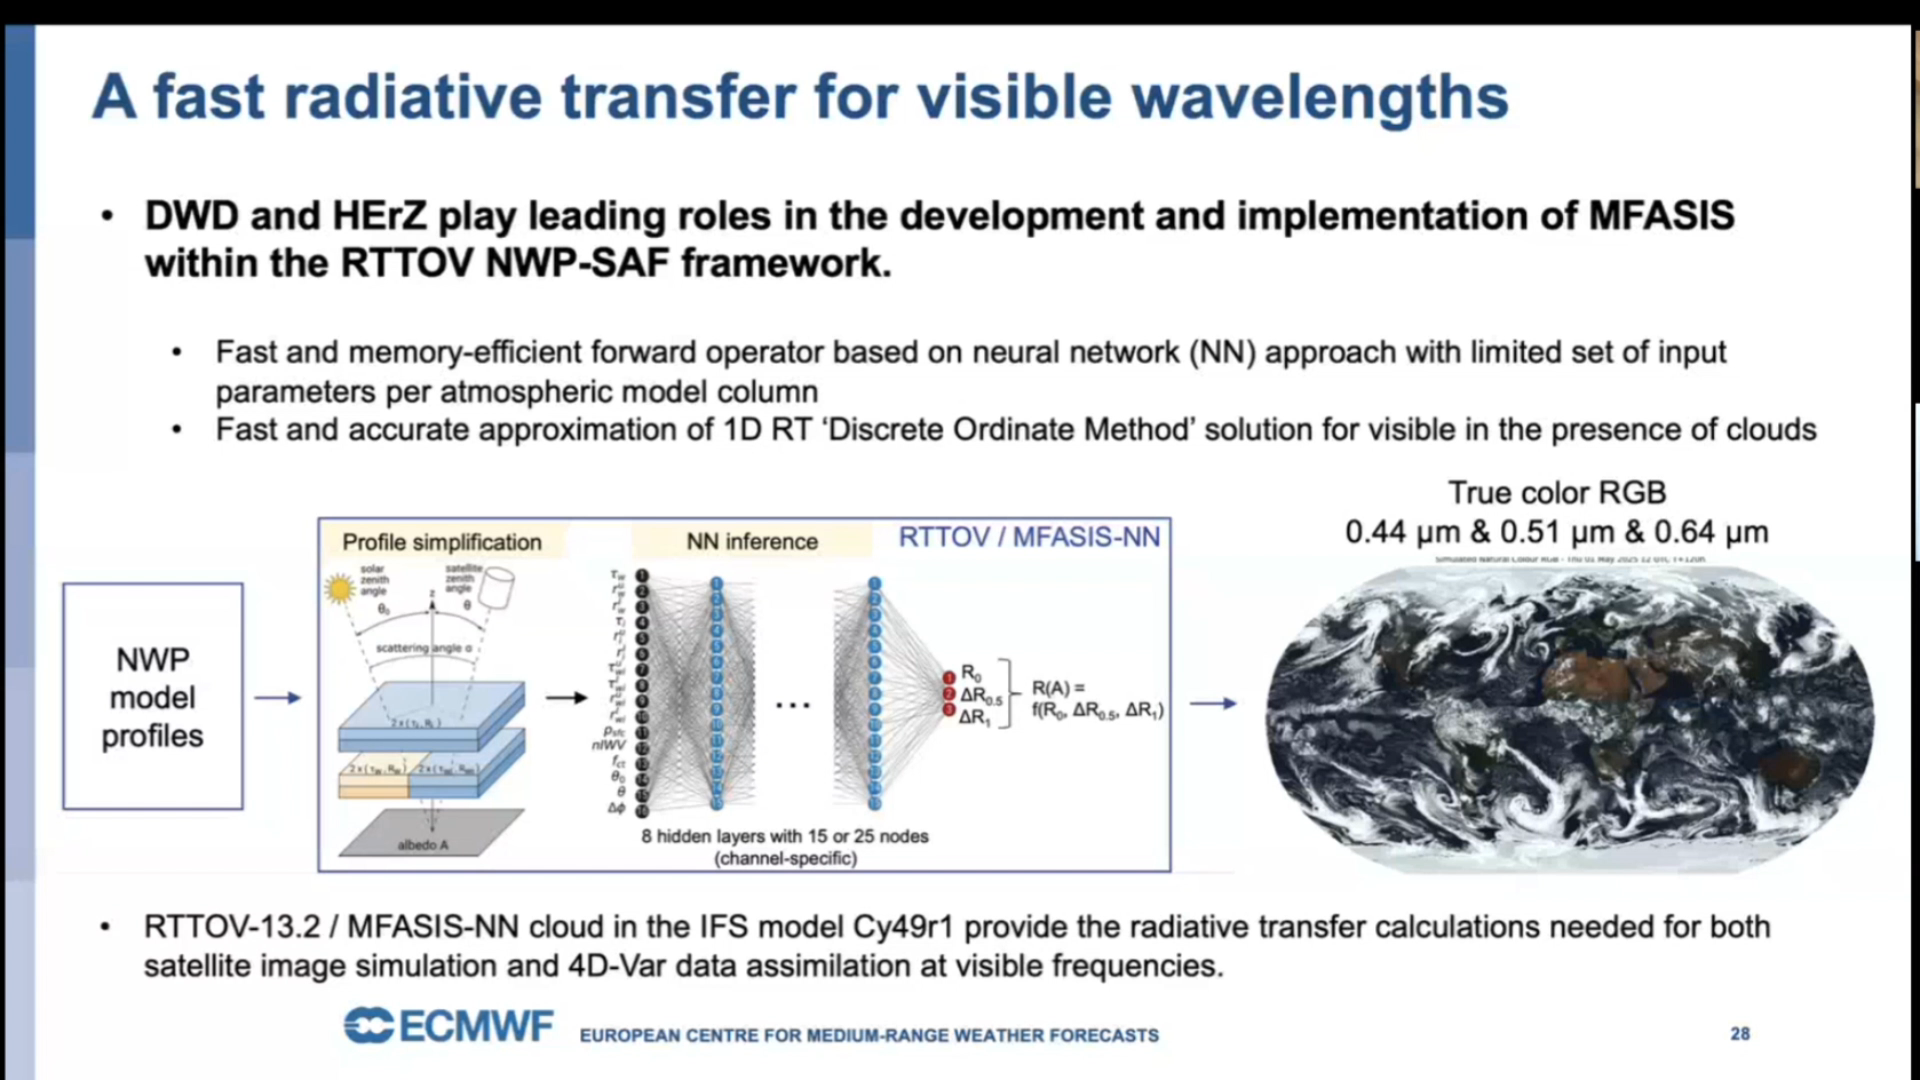
Chris Burrows talks about assimilation of different types of MTG data that is done by ECMWF.
Three instruments on the MTG platforms are of key interest to numerical weather prediction (NWP) centres; FCI, LI and IRS. For FCI, infrared radiances are already being assimilated operationally at ECMWF, and work is underway to test the assimilation of visible reflectances. Also, atmospheric motion vectors (AMVs) from FCI are being used to provide wind information. Cutting edge advancements have been made to prepare the ECMWF system to assimilate lightning data from FCI, though this is not yet activated operationally. Preparations are also being made in readiness for the distribution of data from IRS, which will provide high vertical resolution as well as rapid temporal sampling. This presentation will provide a high-level overview of these activities.
Ivan Smiljanic talks about shadows in FCI imagery, that are now better observed than ever due to high spatial resolution.
When light travels through the atmosphere it can interact with it or with the features in it, leaving shadows that can be taken as clues and signatures on that interaction. From that, experts can read about different properties of various features that interacted with light, giving out the shape, height, distribution, optical thickness and even the dynamics of the features. In this session you will hear how advanced resolution of FCI reveals many new shadows, previously not well (or not at all) observed with SEVIRI imager, and you will learn how these shadows can assist experts and operational meteorologists in their daily work.
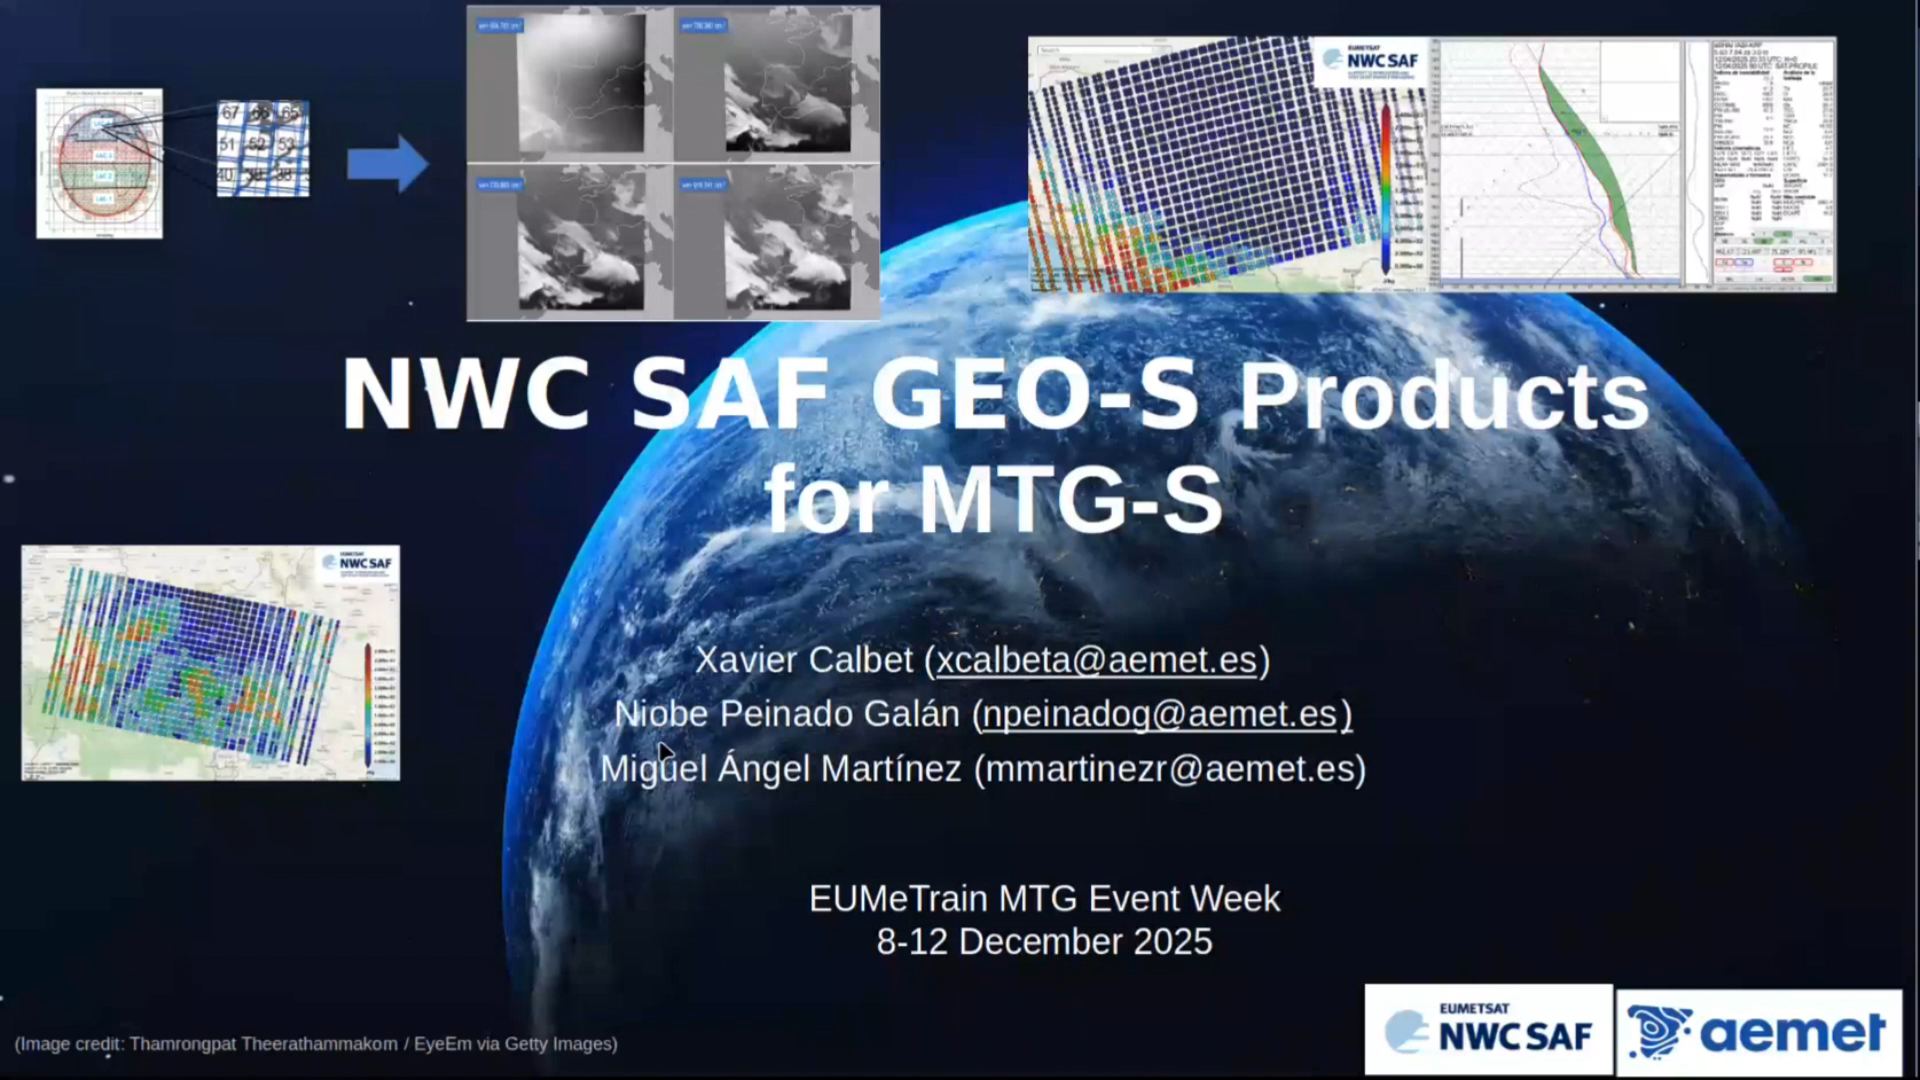
Xavier Calbet talks about IRS and it's uses, specifically from NWC SAF side.
The MTG-S/IRS will be an infrared hyperspectral sounder in geostationary orbit, providing high spectral resolution radiances with a refresh rate of 30 minutes over the LAC-4 region (approximately the northern quarter of the IRS disk) and three consecutive slots every several hours over the rest of the LAC regions. The spatial resolution will be of 4 km at nadir. The MTG-S/IRS instrument will have close to 2000 channels in the thermal infrared which will allow the retrieval of temperature and water vapour profiles of the atmosphere at an unprecedented vertical resolution from geostationary orbit. The accuracy of the temperature and water vapour retrievals obtained from infrared sounders varies depending on the altitude, scene cloudiness and actual temperature and water vapour profile. The best accuracy and vertical resolution is typically obtained in the mid-troposphere, while the worst one is in the lower layers of the troposphere. Furthermore, retrievals show a good accuracy even over cloudy scenes reaching up to 80% cloud fraction. On average, the typical accuracy of infrared hyperspectral retrievals is approximately of 1 K in 1 km layers for temperature and 15% in 2 km layers for humidity.
Go to lecture slides
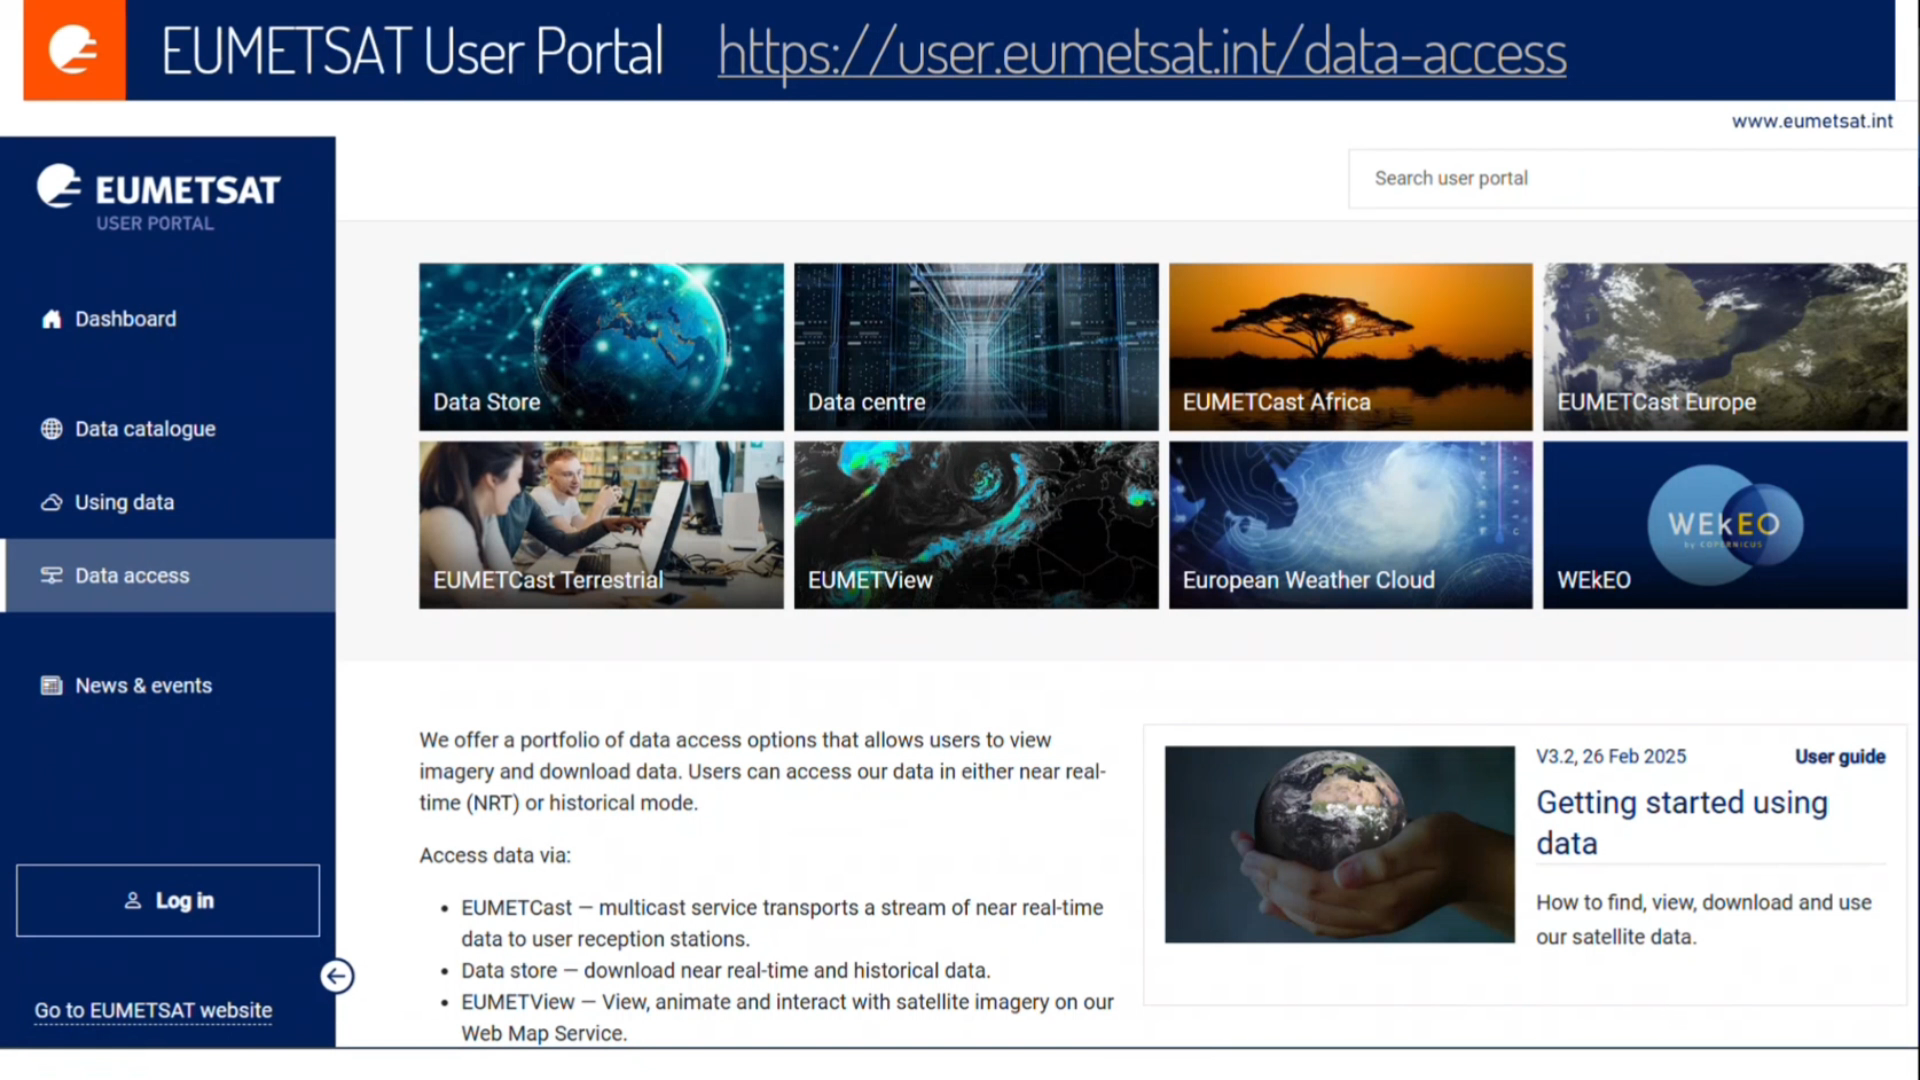
Natasa Strelec Mahovic shows a variety of data access option to view the MTG data including FCI, LI and SAF products.
EUMETSAT provides access to meteorological satellite data through a suite of platforms designed to support operational forecasting, research and developments and climate monitoring. Users can receive near real-time data from all of the EUMETSAT’s satellite missions via the EUMETCast Europe, EUMETCast Africa and EUMETCast Terrestrial broadcast systems, use EUMETSAT Data Store to download near real-time and historical data via a web user interface (Web-UI) and/or Application Programming Interface (API), and the data not found in the Data Store, users can download from the EUMETSAT Data Centre (long-term archive) using the data centre ordering client. Visualization tools, ie the EUMETView online map viewer and ADAGUC for NWCSAF products visualization, enable exploration of multispectral imagery and derived products. The presentation will give an overview of EUMETSAT data access and visualization tools.
Go to lecture slides
Stefan Stapelberg introduces Level 2 products from EUMETSAT's IRS intstrument.
The Infrared Sounder (IRS) aboard Europe’s new meteorological satellite offers highresolution, frequent atmospheric observations to enhance weather forecasting. Using EUMETSAT’s piecewise linear regression method, it retrieves detailed temperature, humidity, and ozone profiles with uncertainty estimates. These data, combined with cloud information and Instability indices, are expected to improve the performance of numerical weather prediction (NWP) models, particularly in the context of severe storm forecasting.
Go to lecture slides
Stephan Bojinski introduces the MTG-S and the instruments onboard.
An overview of Meteosat Third Generation (MTG) and the InfraRed Sounding mission is provided. The MTG-S satellite was launched on 1 July 2025 with an InfraRed Sounder (IRS) on board, passively measuring upwelling radiance in 1953 channels from geostationary orbit, every 30 min over Europe, and less frequently over other areas of the Earth disc. Valuable retrievals of humidity and temperature are expected with vertical resolution of 1-2km and spatial resolution of ~6-7km over Europe, complementing model-derived fields or radiosonde profiles. IRS is also sensitive to atmospheric trace gases such as NH3, SO2 and CO. Since this capability is a first-ever for EUMETSAT and its users, significant user training is required to visualise and interpret the data directly, e.g., in nowcasting applications. Strong impact on improving weather forecasting skill is expected by assimilating IRS radiances in NWP models, similar to data from its IASI sister missions in polar orbit. EUMETSAT informs its member states regularly informed about the status of IRS testing and release of early data via its MTG User Preparation user group and the Core NWP user group.
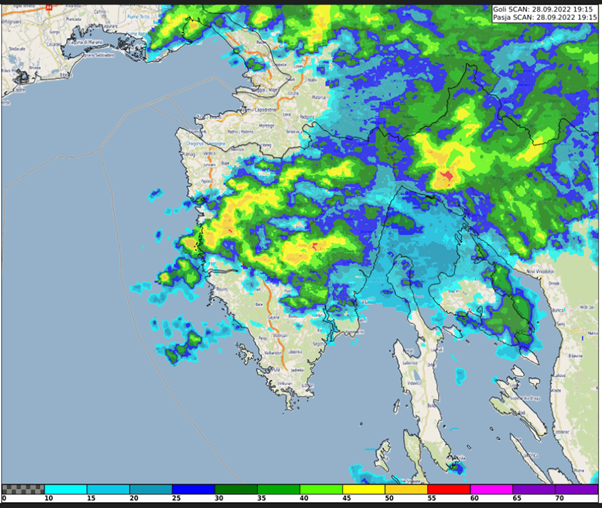
Case study about the extreme precipitation event in Rijeka, Croatia on 28 September 2022. The study focuses on the special case of convective development that caused the severe event.
This study accompanies the simulator.