
Satellite skills and knowledge for operational meteorologist
Listed here are other resources related to Satellite skills and knowledge for operational meteorologist tag:
Note: click on an image to open the Resource
Luca Brocca shows how to combine multiple satellite derived variables to monitor drought.
How do we monitor drought? Is it enough to use only precipitation data and calculate the SPI (Standardized Precipitation Index)? New satellite-derived products (precipitation, evaporation, soil moisture and snow) offer additional ways to monitor drought in space and time, to assess WHERE the water is (surface soil, root zone soil, snowpack), and thus to know WHEN the water will be available. Real-world case studies will be analyzed together with the participants, also using an interactive platform (https://explorer.dte-hydro.adamplatform.eu/). The objectives of the lecture are: (1) to assess drought risk based on (new) satellite observations, and (2) to translate drought risk information into real-world decisions for water resources management (e.g., reservoir management, irrigation, hydropower generation).
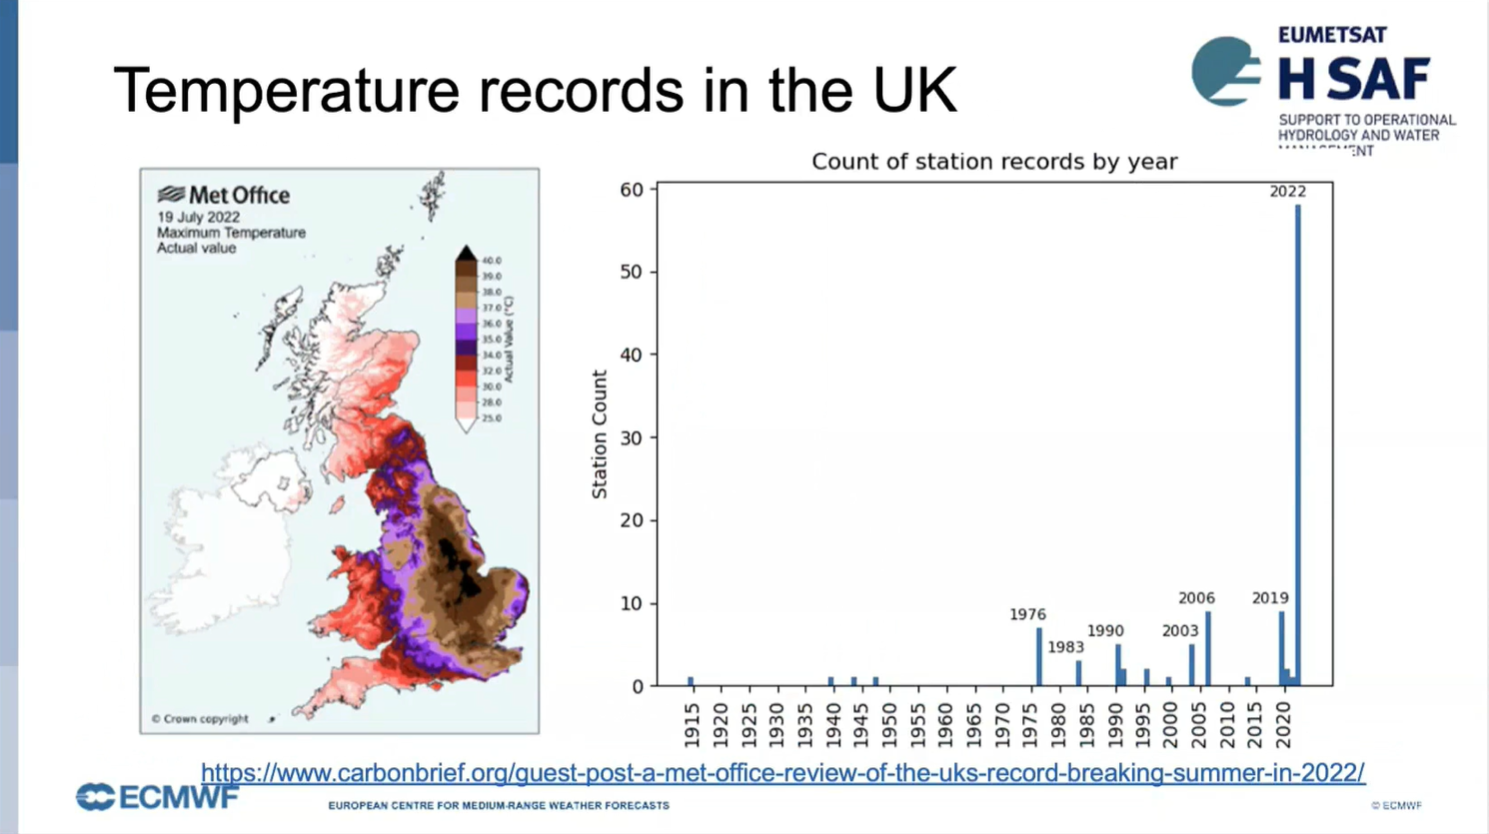
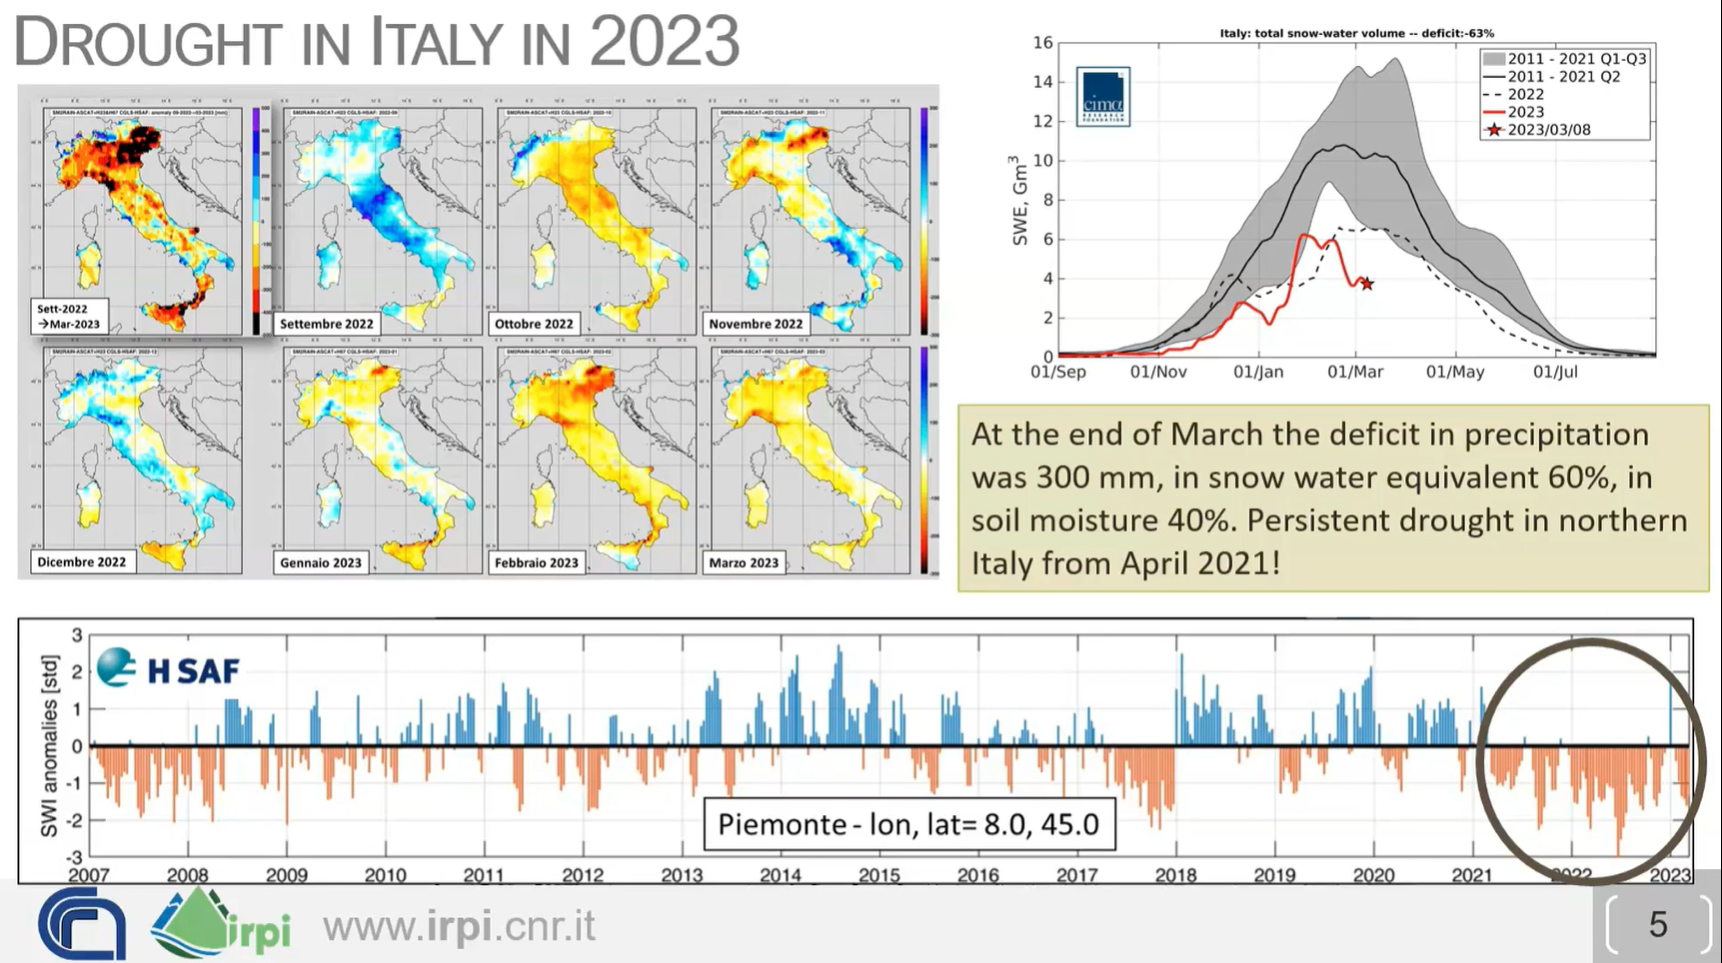
David Fairbairn talks about soil moisture and drought monitoring and using H SAF datasets.
H SAF soil moisture (SM) products are derived from ASCAT C-band backscatter measurements. In this presentation we compare the near-real-time products with long-term data records in order to demonstrate the exceptional severity and extent of recent droughts, including the 2022 summer drought over Europe.
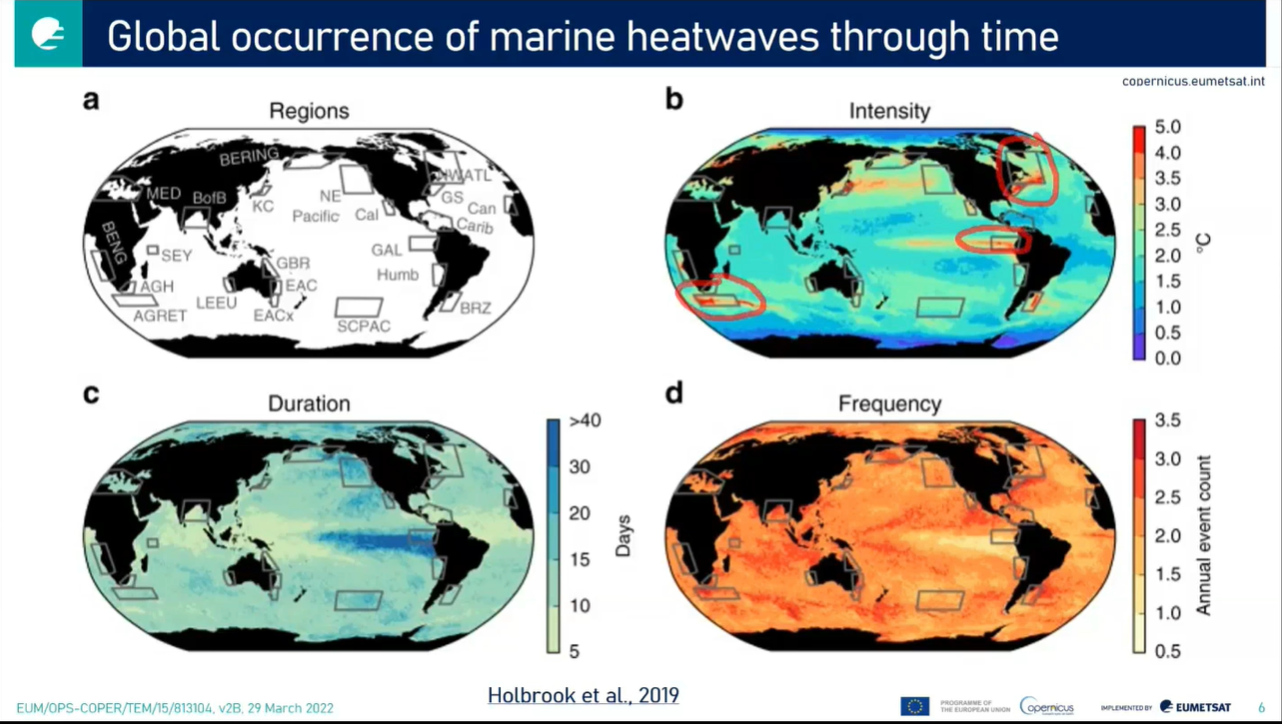
Hayley Evers-King talks about marine heatwaves and using Jupyter Notebooks for satellite data processing and visulization.
Heatwaves don't just happen on land, but also at sea. Periods of extreme regional ocean warming are becoming more frequent and more extreme, affecting our oceans most diverse ecosystems, and those upon which human society depends. In this presentation we'll see how satellite data can be used to identify marine heatwaves, via a practical demonstration in a Python Jupyter Notebook. We'll also consider the connections between heatwaves on land and those that happen at sea.
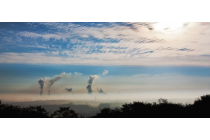
João Martins talks about using Land Surface Temperature (LST) in heatwave monitoring using LSA SAF datasets.
Heat and water stress leave clear signatures on land surface variables that can be monitored from space. The LSA SAF has been providing satellite datasets and products that allow the characterization of the surface energy budget and the monitoring of vegetation growth and stress. We will show that combining information on the surface temperature diurnal cycle and on vegetation state provides a different perspective on the spatial extent and time evolution of droughts and heatwaves, and reveals underlying soil vegetation-atmosphere feedbacks.
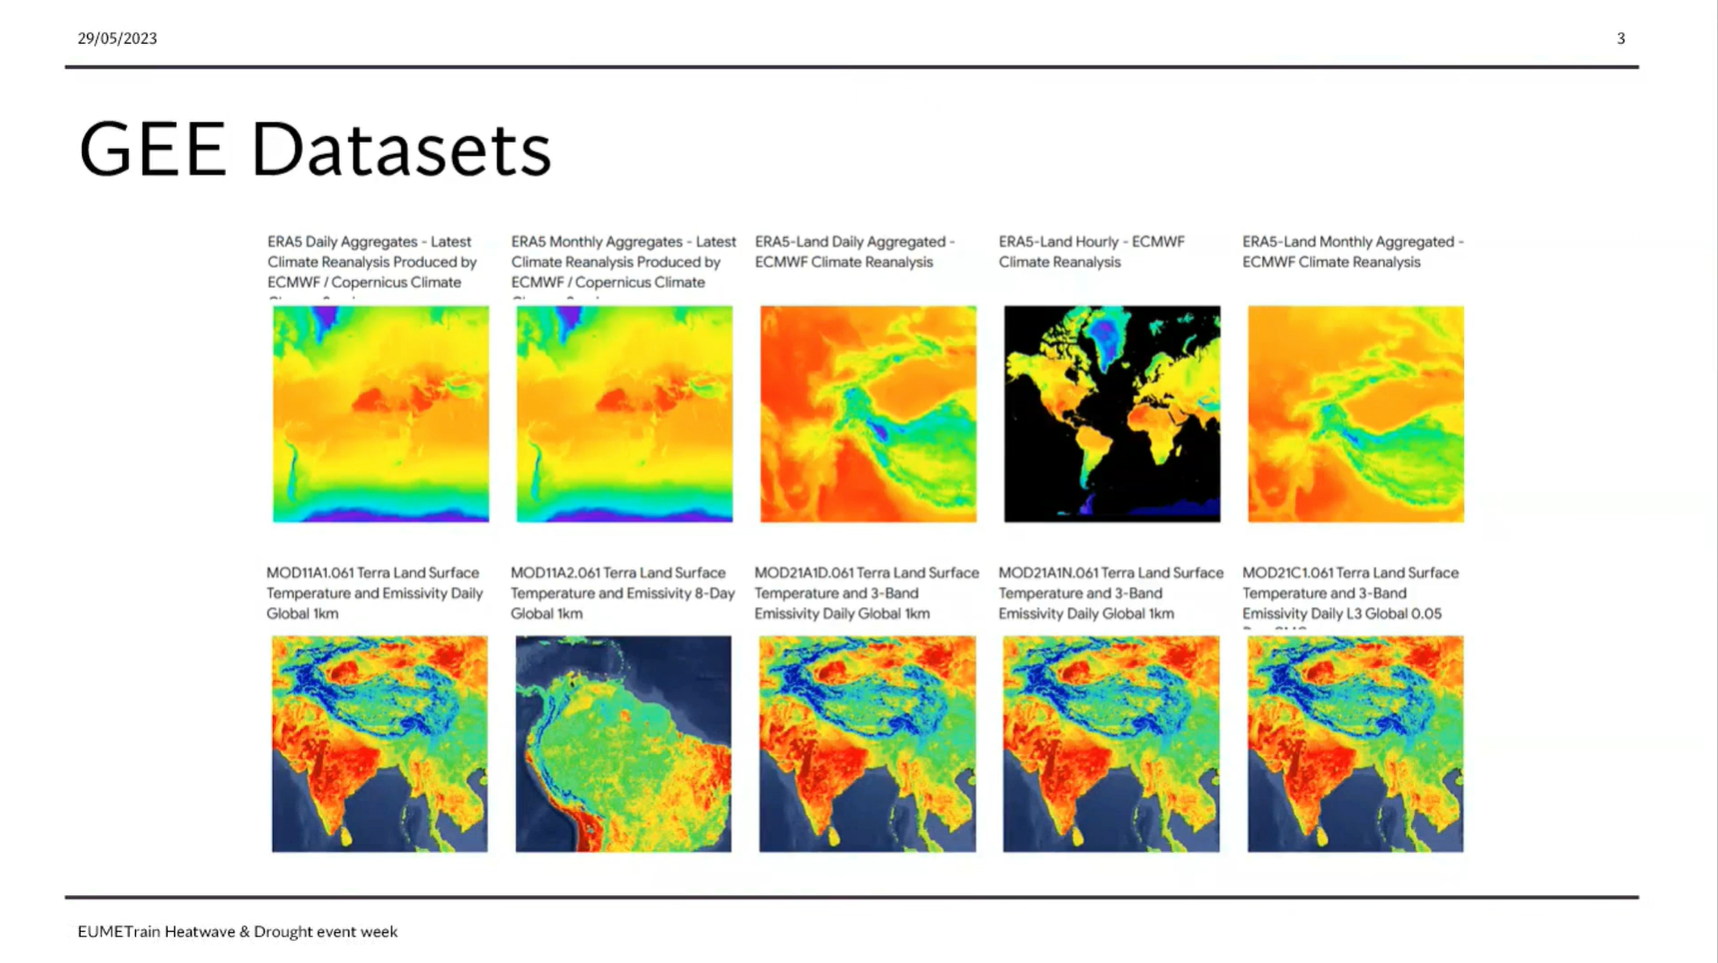
Sofia Ermida showcases the use of Google Earth Engine in Heatwaves and Drought monitoring
The Google Earth Engine (GEE) is a powerful tool for researchers providing easy access to a large array of environmental datasets, particularly from remote sensing, and the computational resources to analyzed them. Here we present an overview of the capabilities and datasets of the GEE useful for the study of heatwaves and droughts and provide some examples of applications.
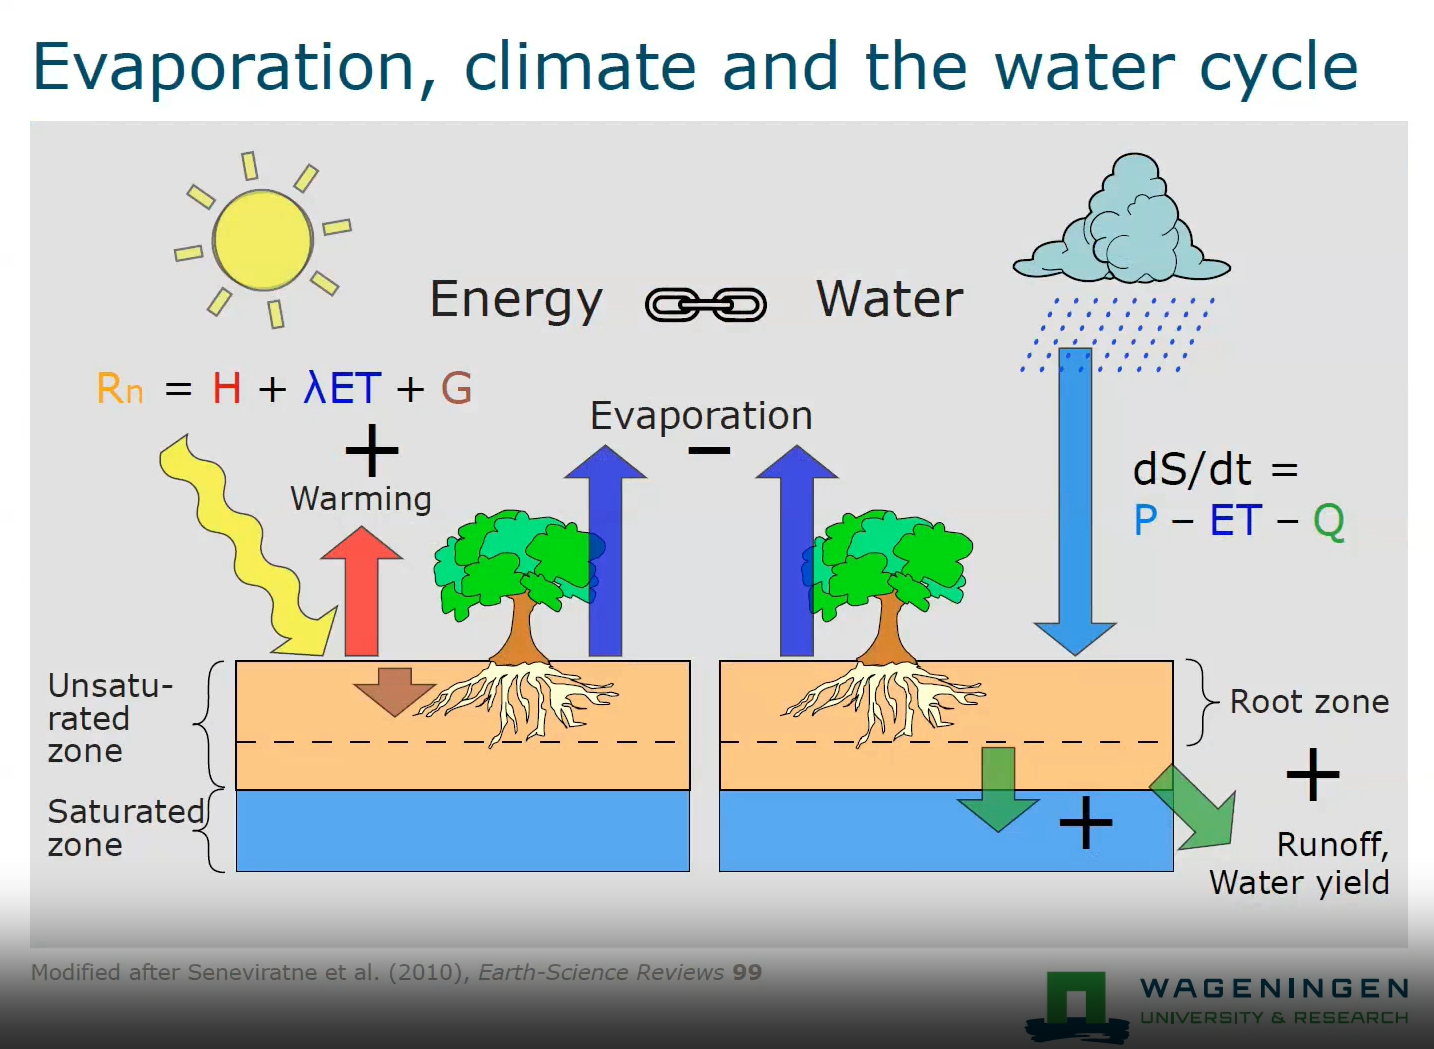
Ryan Teuling talks about soil moisture and land surface energy balance.
Heatwaves and droughts are often strongly linked due to the increased sensible heat fluxes at the land surface warming the atmosphere above. In this talk, I will discuss how soil moisture depletion changes the land surface energy balance, and how the evolution of changes in the land surface energy balance is different for different land cover types (i.e., forest and short vegetation). The use of high-resolution satellite soil moisture data for drought monitoring is also discussed.
Identify and locate features indicating regions of possible turbulence.
This module teaches you how to use satellite data to observe and analyze atmospheric phenomena. It will show you which products can be used to identify dust storms, smoke, fires, precipitation, etc.
To access the resource click here.
Note: all resources are provided as an external link which redirects you to https://eumetcal.eu where you will need to create a user account in order to gain access to the course
Identify and locate aerosols and particulate pollution.
This module teaches you how to use satellite data to observe and analyze atmospheric phenomena. It will show you which products can be used to identify dust storms, smoke, fires, precipitation, etc.
To access the resource click here.
Note: all resources are provided as an external link which redirects you to https://eumetcal.eu where you will need to create a user account in order to gain access to the course
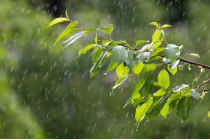
Identify and locate moisture features, precipitation types and amounts.
This module teaches you how to use satellite data to observe and analyze atmospheric phenomena. It will show you which products can be used to identify dust storms, smoke, fires, precipitation, etc.
To access the resource click here.
Note: all resources are provided as an external link which redirects you to https://eumetcal.eu where you will need to create a user account in order to gain access to the course
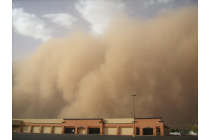
Learn to distinguish between dust and smoke.
This module teaches you how to use satellite data to observe and analyze atmospheric phenomena. It will show you which products can be used to identify dust storms, smoke, fires, precipitation, etc.
To access the resource click here.
Note: all resources are provided as an external link which redirects you to https://eumetcal.eu where you will need to create a user account in order to gain access to the course
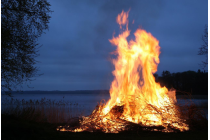
Identify and locate fires and smoke.
This module teaches you how to use satellite data to observe and analyze atmospheric phenomena. It will show you which products can be used to identify dust storms, smoke, fires, precipitation, etc.
To access the resource click here.
Note: all resources are provided as an external link which redirects you to https://eumetcal.eu where you will need to create a user account in order to gain access to the course
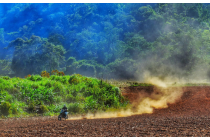
Identify and locate dust and sand storms and plumes and areas of raised dust.
This module teaches you how to use satellite data to observe and analyze atmospheric phenomena. It will show you which products can be used to identify dust storms, smoke, fires, precipitation, etc.
To access the resource click here.
Note: all resources are provided as an external link which redirects you to https://eumetcal.eu where you will need to create a user account in order to gain access to the course