
NWP
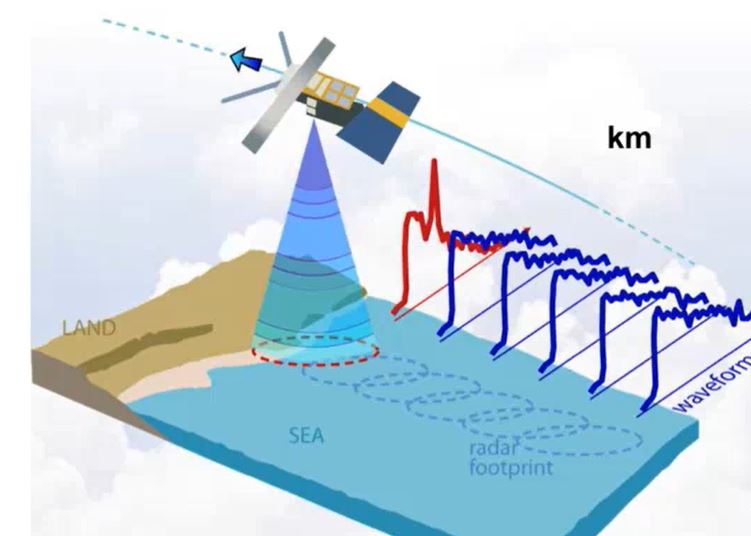
Zorana Jelenak describes how altimeters work, how data is used for everyday marine forecasting at NOAA and assimilation.
Length: 60 min
Author: Zorana Jelenak (NOAA)
Altimeter data have been used to produce maps of sea surface height, geostrophic velocity, significant wave height and wind speed. This information is of proven use to mariners as well as to the scientific community. Uses of the data include commercial and recreational vessel routing, ocean acoustics, input to geographic information systems developed for the fishing industry, identification of marine mammal habitats, fisheries management and monitoring ocean debris. Such information is accessible in near-real time (within 3 to 48 hours) and to improve weather forecasting models by assimilation. 25 years of data makes it possible to study the whole ocean or regional areas for offshore industries or navigation. In hurricane studies altimetry measures very high waves and strong winds, but also helps identify sea surface height anomalies which can be used as proxies of the warm currents - hurricanes energy source. The lecture will describe how altimeters work, how data is used for everyday marine forecasting at NOAA and assimilation, devoteting special attention to data accuracy and limitations.
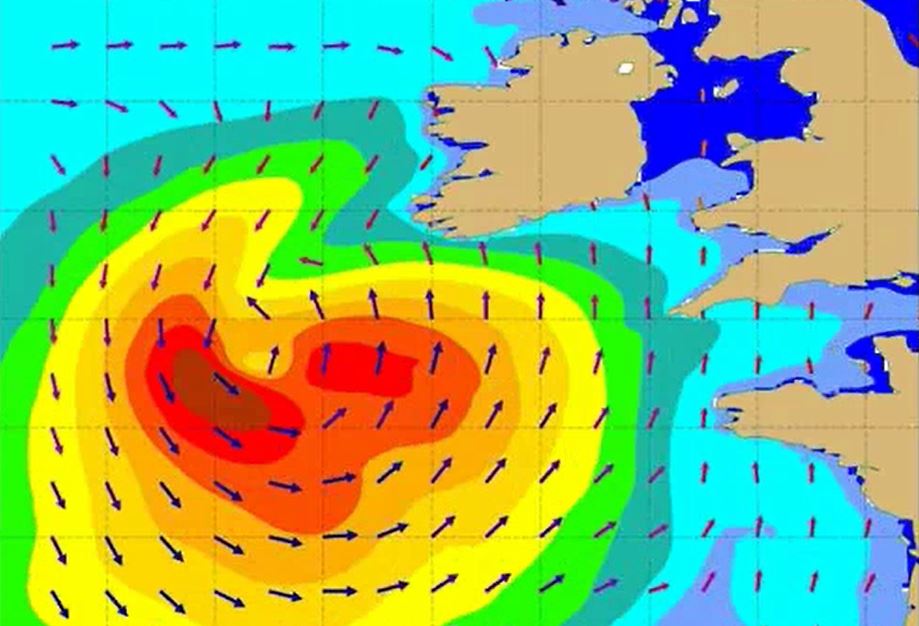
Jean Bidlot gives an overview on the ECMWF wave model products.
Length: 50 min
Author: Jean Bidlot (ECMWF)
Wave models are able to give a very detailed description of the conditions at the surface of the oceans. The mean sea state is fully described by the 2d wave spectrum. This detailed description is however not always very practical and the bulk of the information contained in the 2d spectrum is usually reduced in the form of a set of integrated parameters, from a simple few such as significant wave height, mean wave direction and mean wave period, to more sophisticated parameters that described distinct part of the wave fields. Recent advances in the understanding of wave dynamics have lead to the development of new set of parameters that give information on the possible largest single wave that might exist over a certain area within a certain time frame. It is now possible to describe the sea state with different level of complexity depending on the user needs.
Synoptic and Mesoscale Analysis of Satellite Images 2018 Course
Length: 59 min
Author: Wilfried Jacobs (DWD)
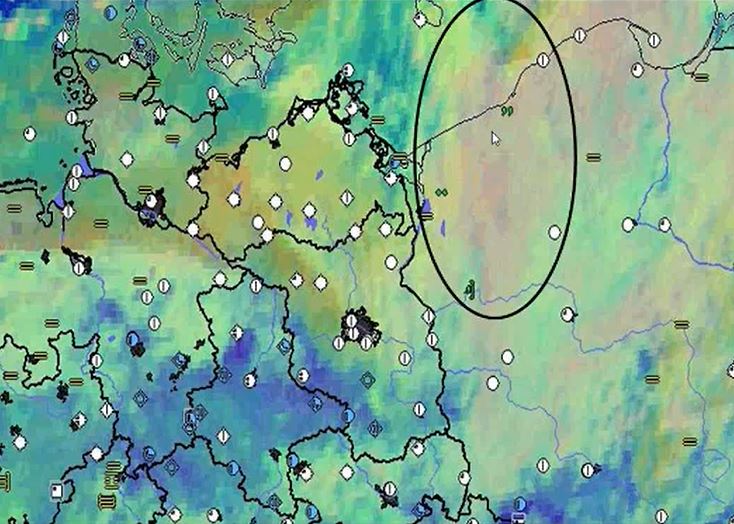
Satellite image interpretation of shallow clouds and related weather phenomena is a very important task for nowcasting because NWP-models and statistical methods exhibit still deficiencies in simulating these phenomena in a proper way. Especially over oceans but also over land observation networks are often too coarse meshed for nowcasting.
The theory and the most suitable satellite products will be explained first. In combination with other data (e.g., observations, radio soundings, radar products) examples will be discussed for the following application areas:
- Diagnosing shallow clouds in respect to water content and related weather, e.g., drizzle of different intensities;
- Identifying fog and low stratus and how to estimate the fog/stratus layer’s thickness. The likelihood of dissolving and connected weather phenomena (e.g., freezing drizzle) will be covered, too.
Synoptic and Mesoscale Analysis of Satellite Images 2018 Course
Length: 50 min
Author: Frans Debie (KNMI)
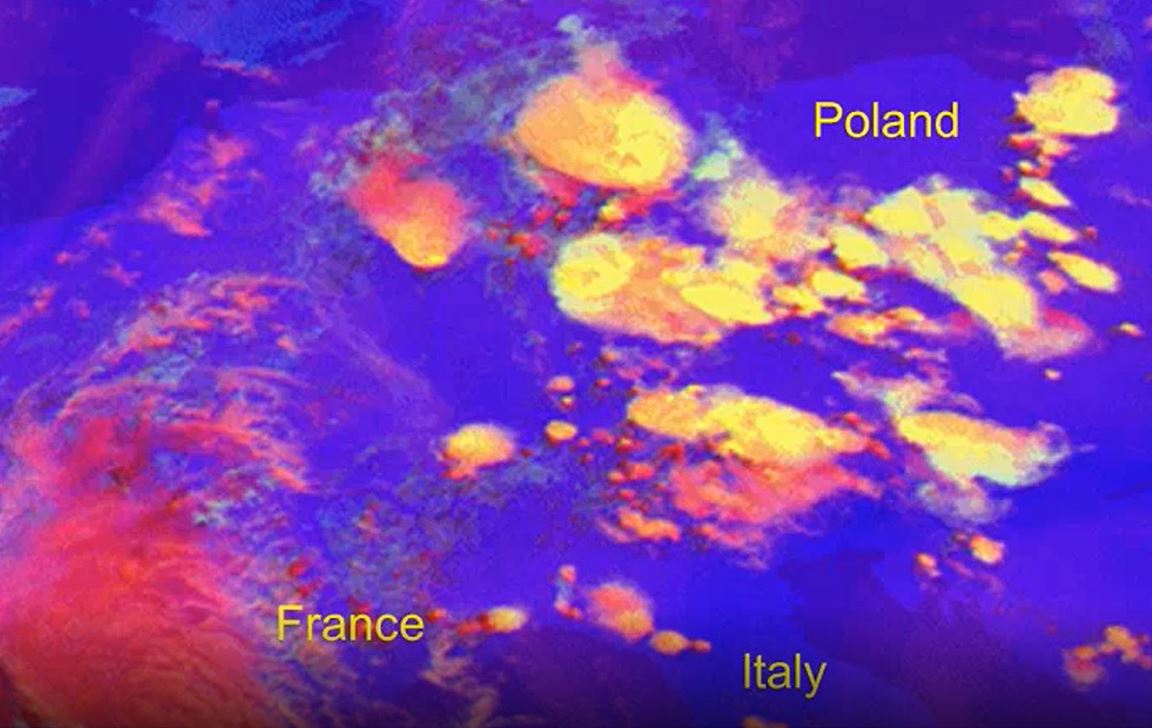
Convection can be found everywhere on the planet. However in meteorological way of thinking in mid-latitudes there is convection in different airmasses and also at the boundary of these airmasses. Convection at the boundaries belongs to the sub-features of frontal systems and we won’t deal with convection in the frontal systems.
In this lecture a few examples of unstable air Conceptual models will be shown, for instance: Cumulonimbi, Enhancement of convection by PV, Spanish Plume, etc. The typical environment is one part and the organization modes is the second part of the lecture.
Synoptic and Mesoscale Analysis of Satellite Images 2018 Course
Length: 51 min
Author: Andreas Wirth, Yasmin Markl (ZAMG)
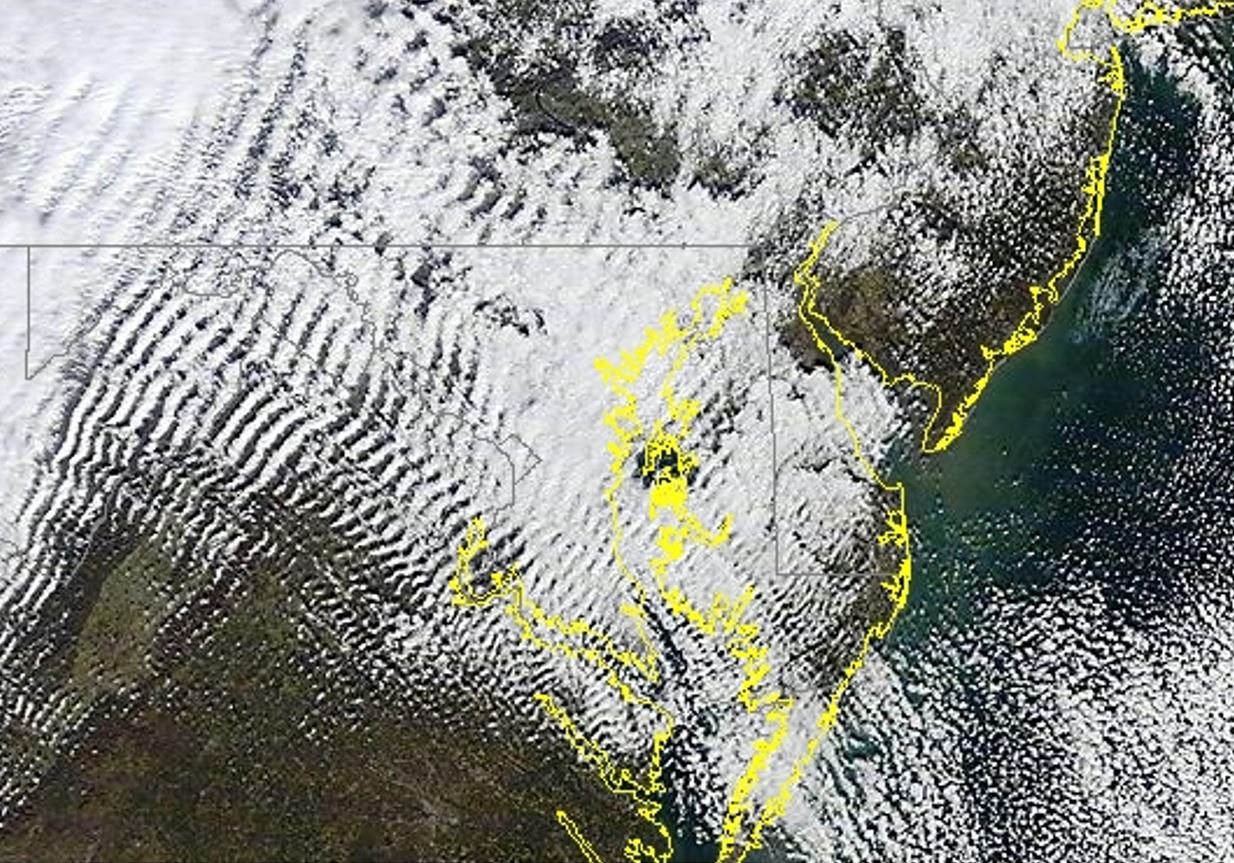
Gravity waves are omnipresent in the atmosphere. In this presentation you will hear more about the different wave types, their appearance in satellite imagery and about their physical background.
Most gravity waves are generated by orographic elevations and in this case we call them lee waves. They can present a serious threat to aircrafts when the air flow changes from laminar to turbulent or when rotor clouds are generated. When this happens without accompanying condensation processes, the phenomenon is called "Clear Air Turbulence" (CAT). In many cases, waves in the atmosphere are accompanied by a characteristic cloud pattern visible in the IR and VIS imagery that helps in identifying regions potentially hazardous for aircrafts.
Gravity waves can however also result from internal friction/shear processes when two layers of air with different physical properties (e.g. temperature, density, wind speed ...) are acting one on the other. This wave type is called Kelvin-Helmholtz wave. Turbulence caused by velocity and directional shear are relatively common in the upper Troposphere in the regions of jet streaks.
Synoptic and Mesoscale Analysis of Satellite Images 2018 Course
Length: 70 min
Author: Veronika Zwatz-Meise (former ZAMG)
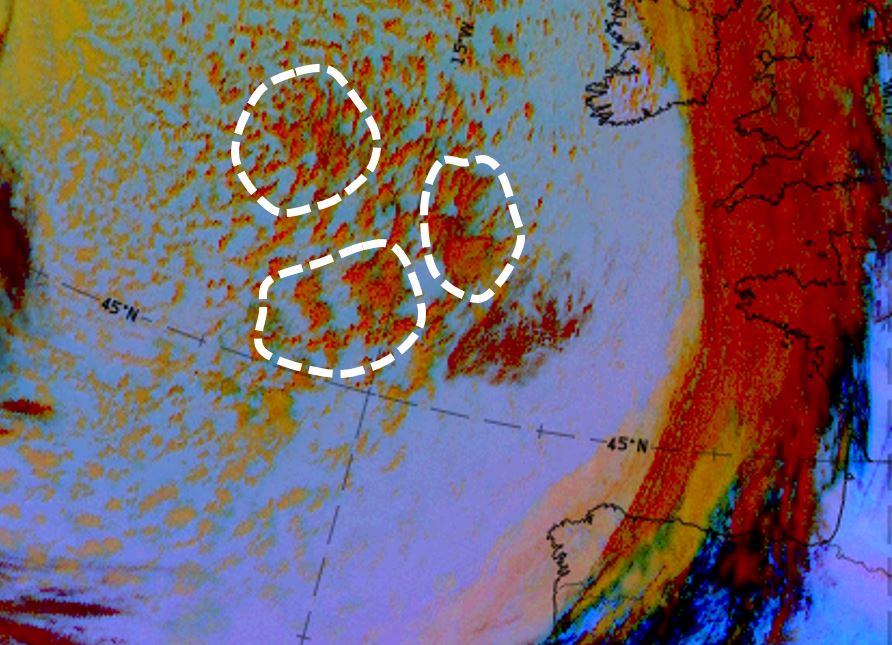
There are a number of structures and processes happening after a cold front has passed an area, e.g. enhanced cumuli, commas, instant occlusions, etc. Commas, for example are meso-scale structures developing within cold air, often behind frontal cloud bands. They occur mainly during the cold season and are a common feature for Northern and Western Europe - nevertheless commas can also be found in the south. As commas can cause severe weather this conceptual model is of high interest for forecasters. In this lecture life cycles of commas will be shown, what do commas form from, what can they form into, how they are connected to other mentioned phenomena and how they appear in satellite imagery - seen by MSG and polar orbiting satellites.
Synoptic and Mesoscale Analysis of Satellite Images 2018 Course
Length: 50 min
Author: David Schultz (University of Manchester)
Precipitation within extratropical cyclones often organizes into mesoscale substructures known as precipitation bands. The purpose of this presentation is to better understand how precipitation organizes into bands. We will discuss about Shapiro-Keyser and the Norweigan models of cyclones, why do they form, the differences between them, also where in cyclones precipitation bands form, their structures and evolutions, what controls their locations and intensities, and techniques to diagnose precipitation bands. In the end we will discuss about occlusion bands and how do they actually form considering latest researches.
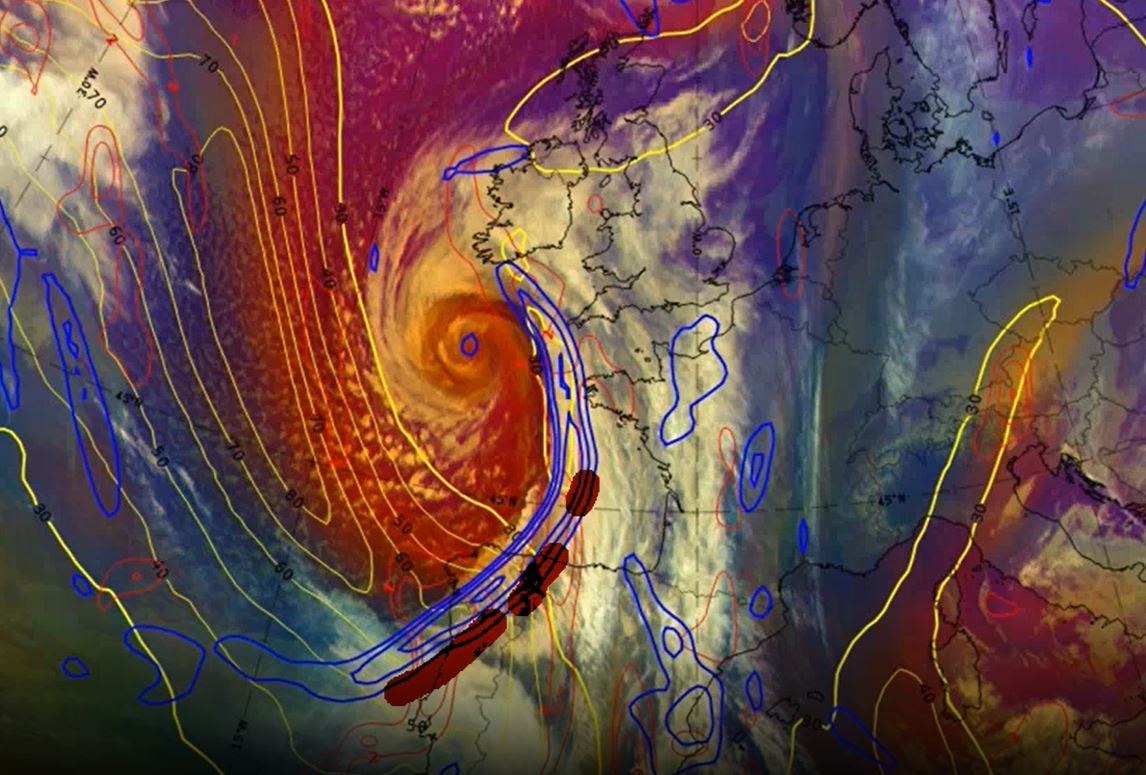
Synoptic and Mesoscale Analysis of Satellite Images 2018 Course
Length: 55 min
Author: Veronika Zwatz-Meise (former ZAMG)
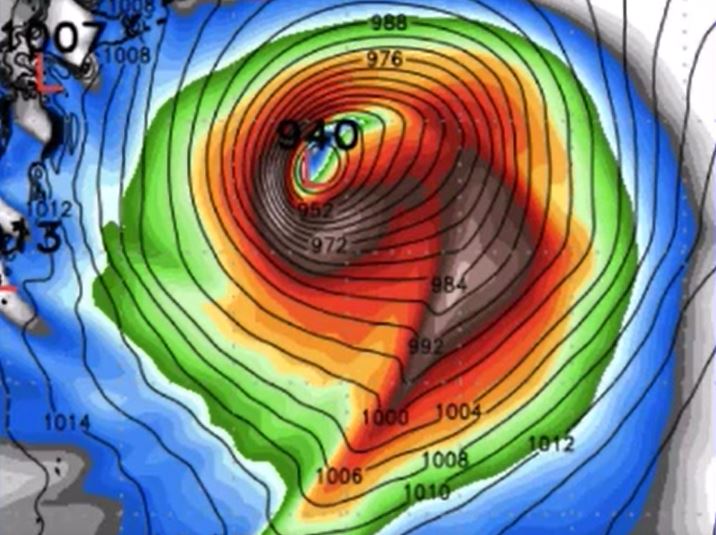
In this second part of the Cyclogenesis and Occlusion Cloud Bands lecture, a special form of cyclogenesis is treated in detail: the “rapid cyclogenesis” which is connected with very severe and often catastrophic weather events.
All processes and weather systems are presented from the aspect of “Conceptual Model thinking”; that means the typical appearance in satellite images is connected to the physical background which is responsible for the cloud configurations; then these results are connected to relevant numerical parameters in horizontal and vertical presentation. And all of the presented CMs are connected to the typical connected weather events. This combination of different meteorological material is especially important in forecasting and nowcasting.
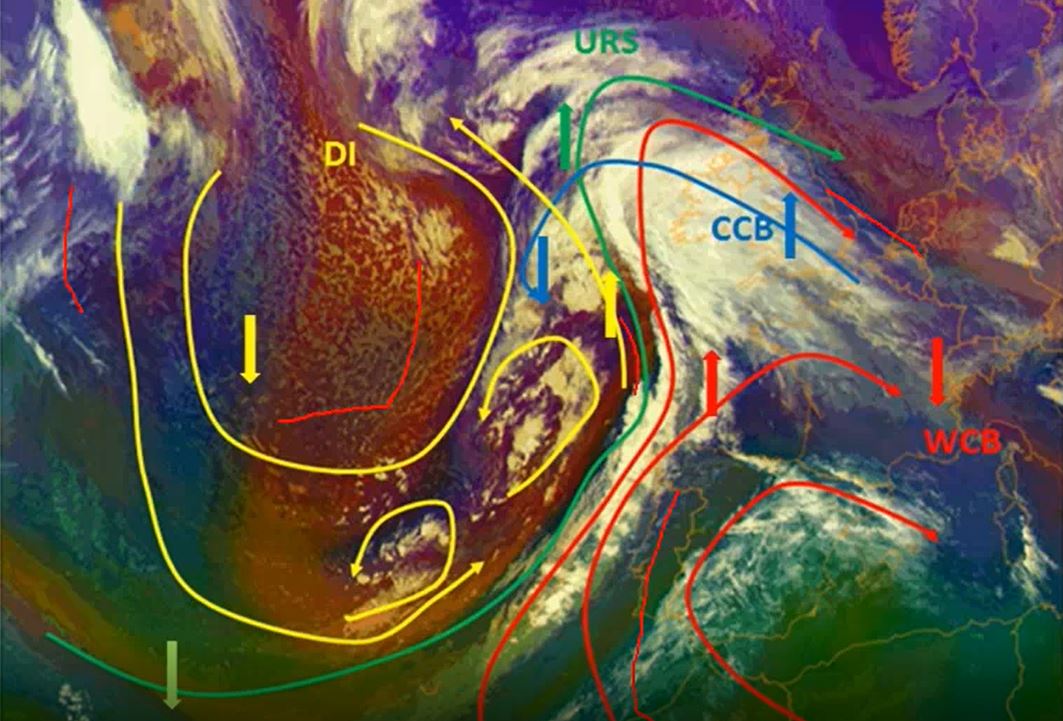
Synoptic and Mesoscale Analysis of Satellite Images 2018 Course
Length: 64 min
Author: Veronika Zwatz-Meise (former ZAMG)
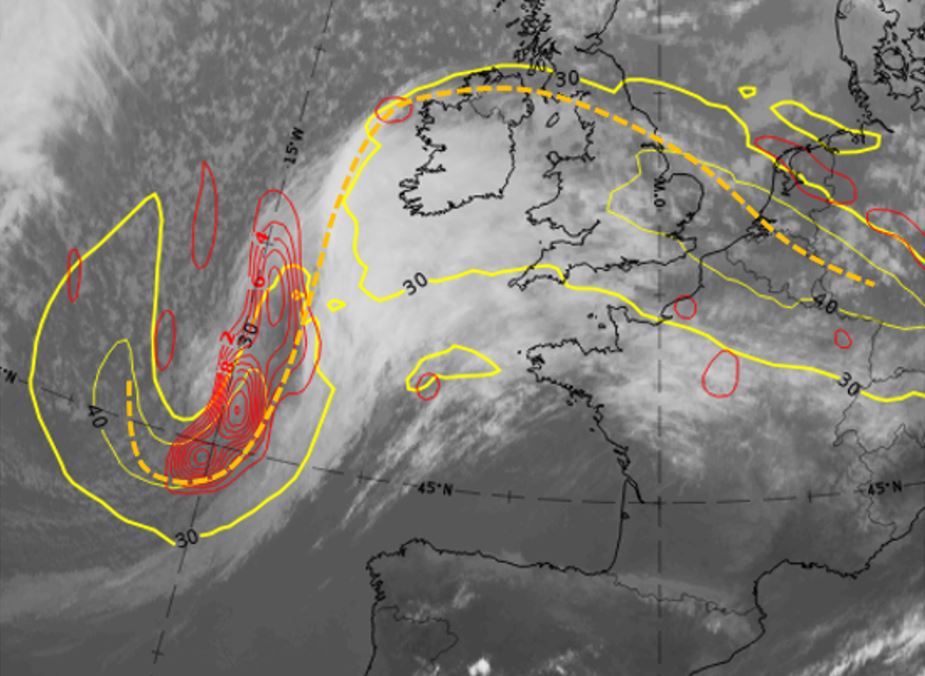
Cyclogenesis and occlusion cloud bands are common meteorological phenomena which are tightly connected. While “cyclogenesis” is a process, describing the development of a low centre, which can last from few hours to several days, the occlusion cloud bands are the result of this cyclogenesis process. Occlusion cloud bands differ from cold and warm front bands because of their history as well as their physical status.
The two lectures start from the classical cyclogenesis (occlusion) processes which are related to the classical polar front theory and introduce then the conveyor belt view of these processes culminating in the warm and cold conveyor belt occlusion types.
The occlusion cloud band types are described and compared to cold and warm front types in their horizontal as well as vertical depiction.
Also special subtypes of occlusion processes like “instant occlusion” and "cold air development" are mentioned.
Synoptic and Mesoscale Analysis of Satellite Images 2018 Course
Length: 72 min
Author: Ab Maas (former KNMI)
Fronts as described in the "Bergen school" by Vilhelm Bjerknes are early conceptual models. Parameters typical for the changing of air masses were named and used by forecasters to recognize transition zones (fronts) between air masses. For nearly a century the method from the Bergen school is applied in the majority of weather rooms all over the world. Satellite information expressed how right Bjerknes was in his CM thinking, but this information showed also that fronts can have a much more complicated structure and live cycle Bjerknes could imagine.
In the lecture we concentrate on warm- and cold fronts and show how we can analyze them with help of CM thinking.
It's not only fronts that forecasters should always keep an eye on, but also the frontal sub-structures like upper waves, front intensifications or newly developing systems. NWP models sometimes catch the situation, sometimes not. Especially for rapid or small scale developments, model performance may leave a lot of gaps in the processes.
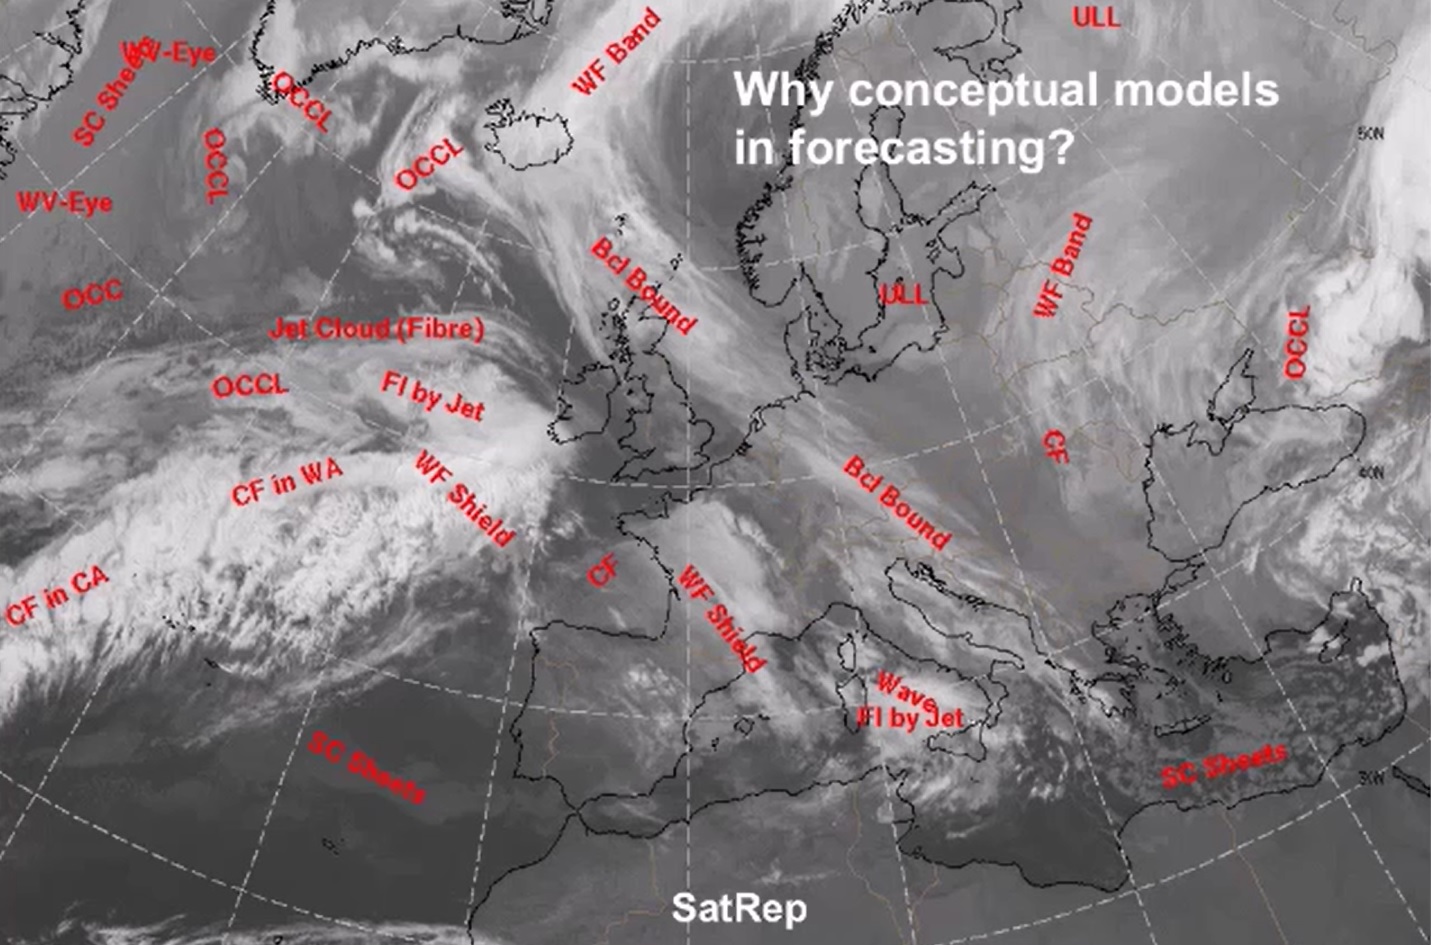
Synoptic and Mesoscale Analysis of Satellite Images 2018 Course
Length: 56 min
Author: Ab Maas (former KNMI)
Getting a good, actual weather picture within short time is essential for a forecaster who has to react quickly and adequately on weather changing's.
The huge amount of weather data which are available makes it almost impossible for a human being to handle. Thinking in conceptual models is the only way to deal with this problem
Within 20 years of the project fifty-three different conceptual models were described in a manual: Sat Manu. Also for the southern hemisphere, we have already fifteen CM's described.
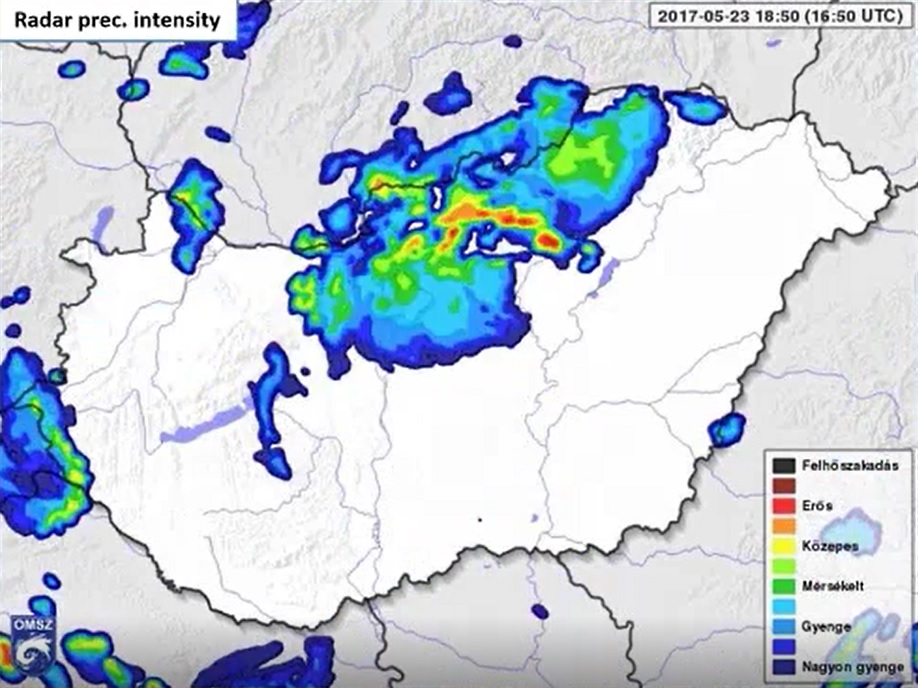
Presentation 16 in the Warnings Event Week 2017
Length: 17 min
Author: Tamás Alaga (OMSZ)
Making reliable severe weather forecasts is always a great challenge. Communicating them towards the public and special end users is sometimes greater, even if the forecast is good. Tamás Alaga says that the Hungarian Meteorological Service (OMSZ) plans to develop and simplify its two-level warning system to make it more understandable. The problem is knowing when to stop with these simplifications. Tamás also explains how does the service handle probabilistic forecasts and delivering such forecasts to public and consumers.