
Atmospheric Composition

Learn more about:
- cloud classification scheme
- recognizing cloud types in satellite imagery
- a satellite product that provides cloud type information
- how cloud top temperature is derived from radiation measurements by satellite sensors
- when and where cloud top temperature provides valuable information to the forecaster
This module covers two different topics. In the first part, the module introduces Luke Howard's cloud classification system and tries to answer the question of whether cloud type classification is possible from space. The second part introduces the concepts of long- and short-wave radiation and how they are used in remote sensing and explains how temperature information is derived from radiation measurements. The module closes with examples of how cloud top temperature information is used in meteorology.
To access the resource click here.

This guide is about the Cloud Type RGB, a new product for European users of GEO satellite data, which can be constructed using data from the Flexible Combined Imager (FCI) on the Meteosat Third Generation (MTG) satellite system. It uses one of the new FCI channels.
At the time the guide was created, FCI was not yet operational, so the characteristics of the FCI Cloud Type RGB were tested using preliminary commissioning data. Similar features were found as with the proxy data. Some examples created from the FCI preliminary commissioning data are presented in this guide.
The main application areas of the Cloud Type RGB are detection of very thin cirrus and higher-level aerosol clouds, and visual differentiation of cloud types, with some limitations. It can also provide some information about areas with dry airmasses.
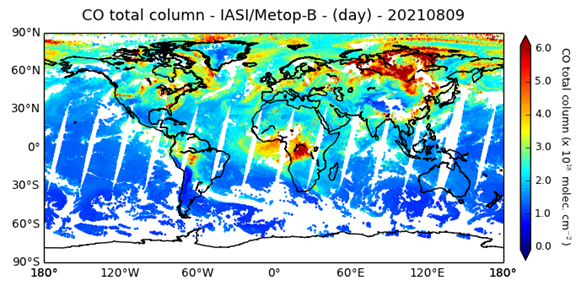
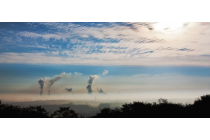
In this air quality module, you will learn to respond better to air pollution and Sahara dust events, by learning which resources to use for these events.
Atmospheric composition can be observed using various instruments (satellite and ground-based) and can be analysed and forecasted using numerical models. This training module provides an overview of available online resources that can be used to assess an air pollution or a Sahara dust event. An air pollution event is defined as a time during which the concentration of atmospheric pollutants exceeds air quality standards. In southern Europe, these also include Sahara dust events, which occur mostly in spring and summer, when south-westerly flow transports desert dust from the areas south of the Atlas Mountain range.
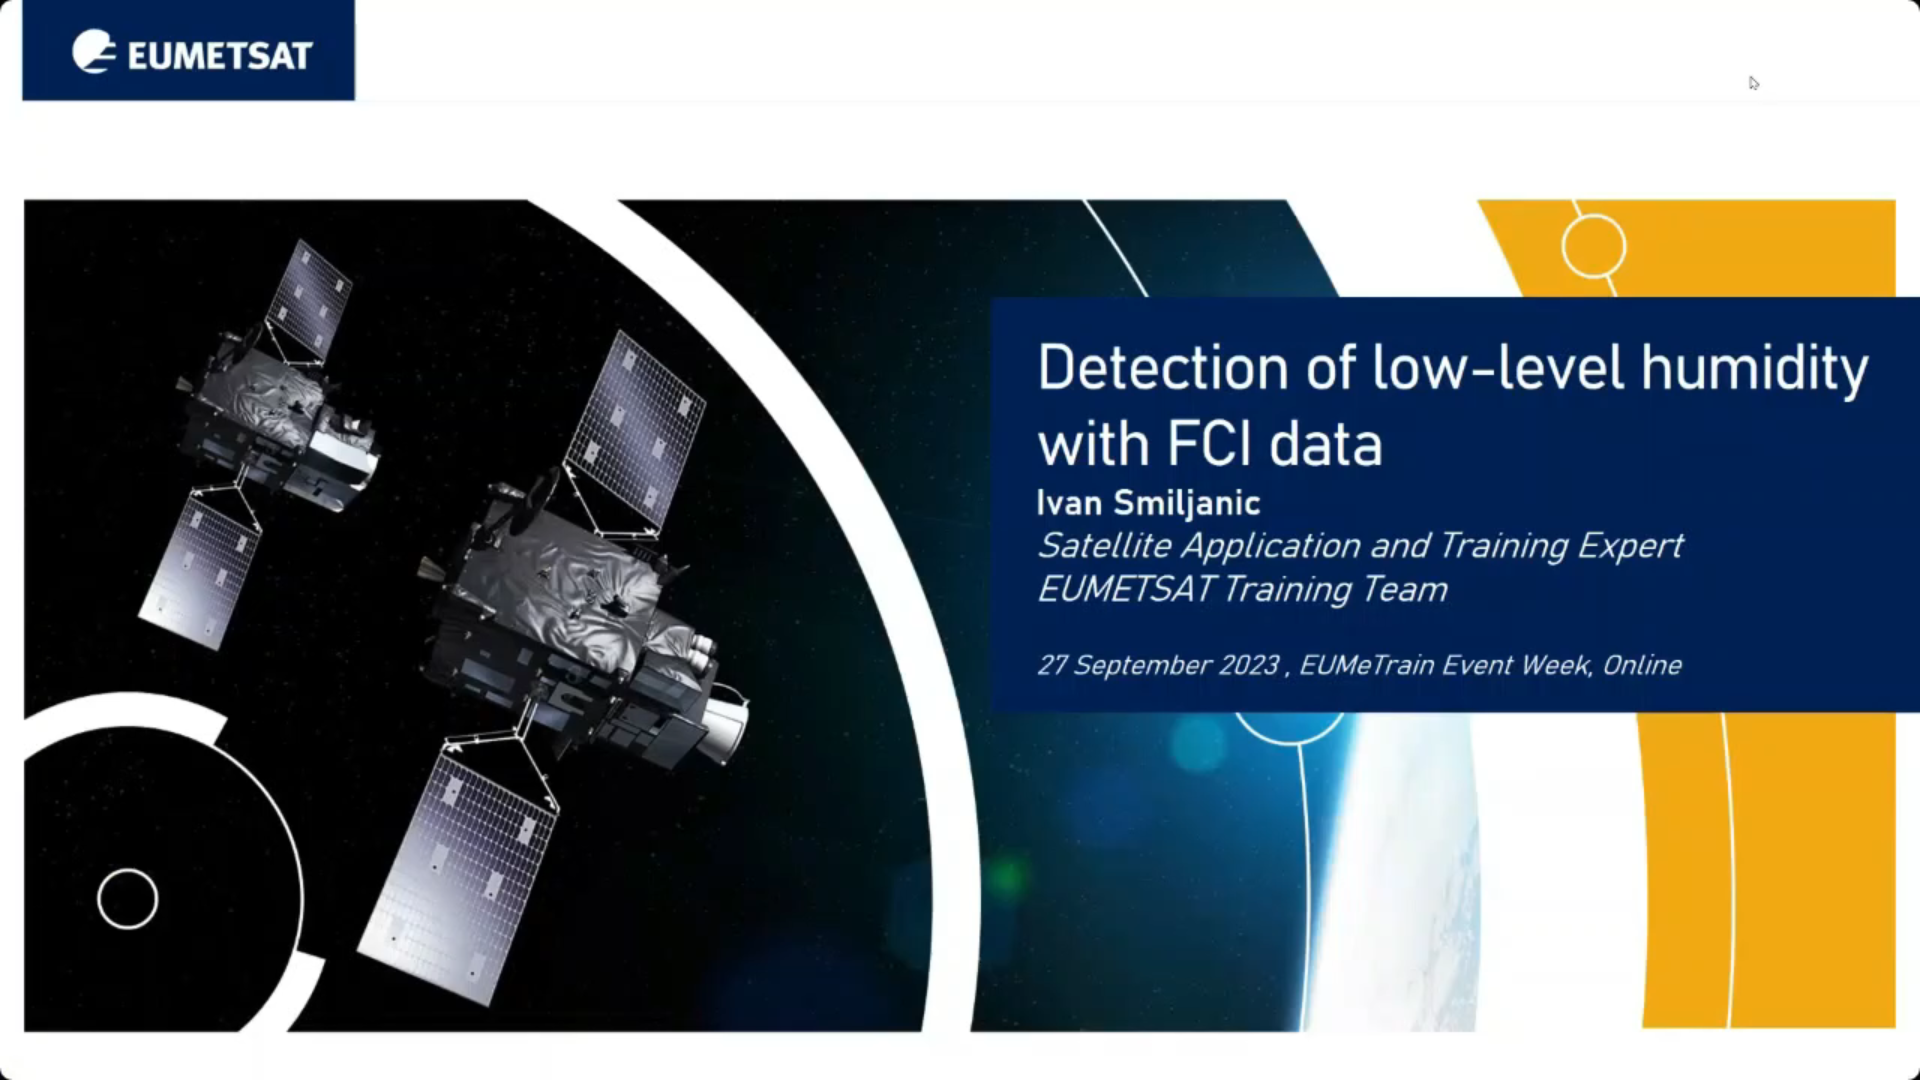
Ivan Smiljanic shows how to detect low level moisture with the FCI.
This talk will provide insights into how FCI instrument can be used to detect moisture in the layers close to the surface. Up until the introduction of FCI instrument, the concept of low-level moisture estimation, using solely data from imagers on board GEO satellites was to high degree limited to so-called split window difference (e.g. SEVIRI BTD12.0-10.8). Perhaps the biggest down side of this approach is the fact that BT difference relies heavily on the vertical temperature profiles of the atmosphere (the temperature of moisture level). With introduction of water vapour absorption channel in the NIR spectral region this dependency is avoided. Hence the novel NIR0.91 FCI channels is seen as one of the crucial tools for nowcasting of severe storms, i.e. assessment of pre-conditions and moisture feeding dynamics of convective systems.
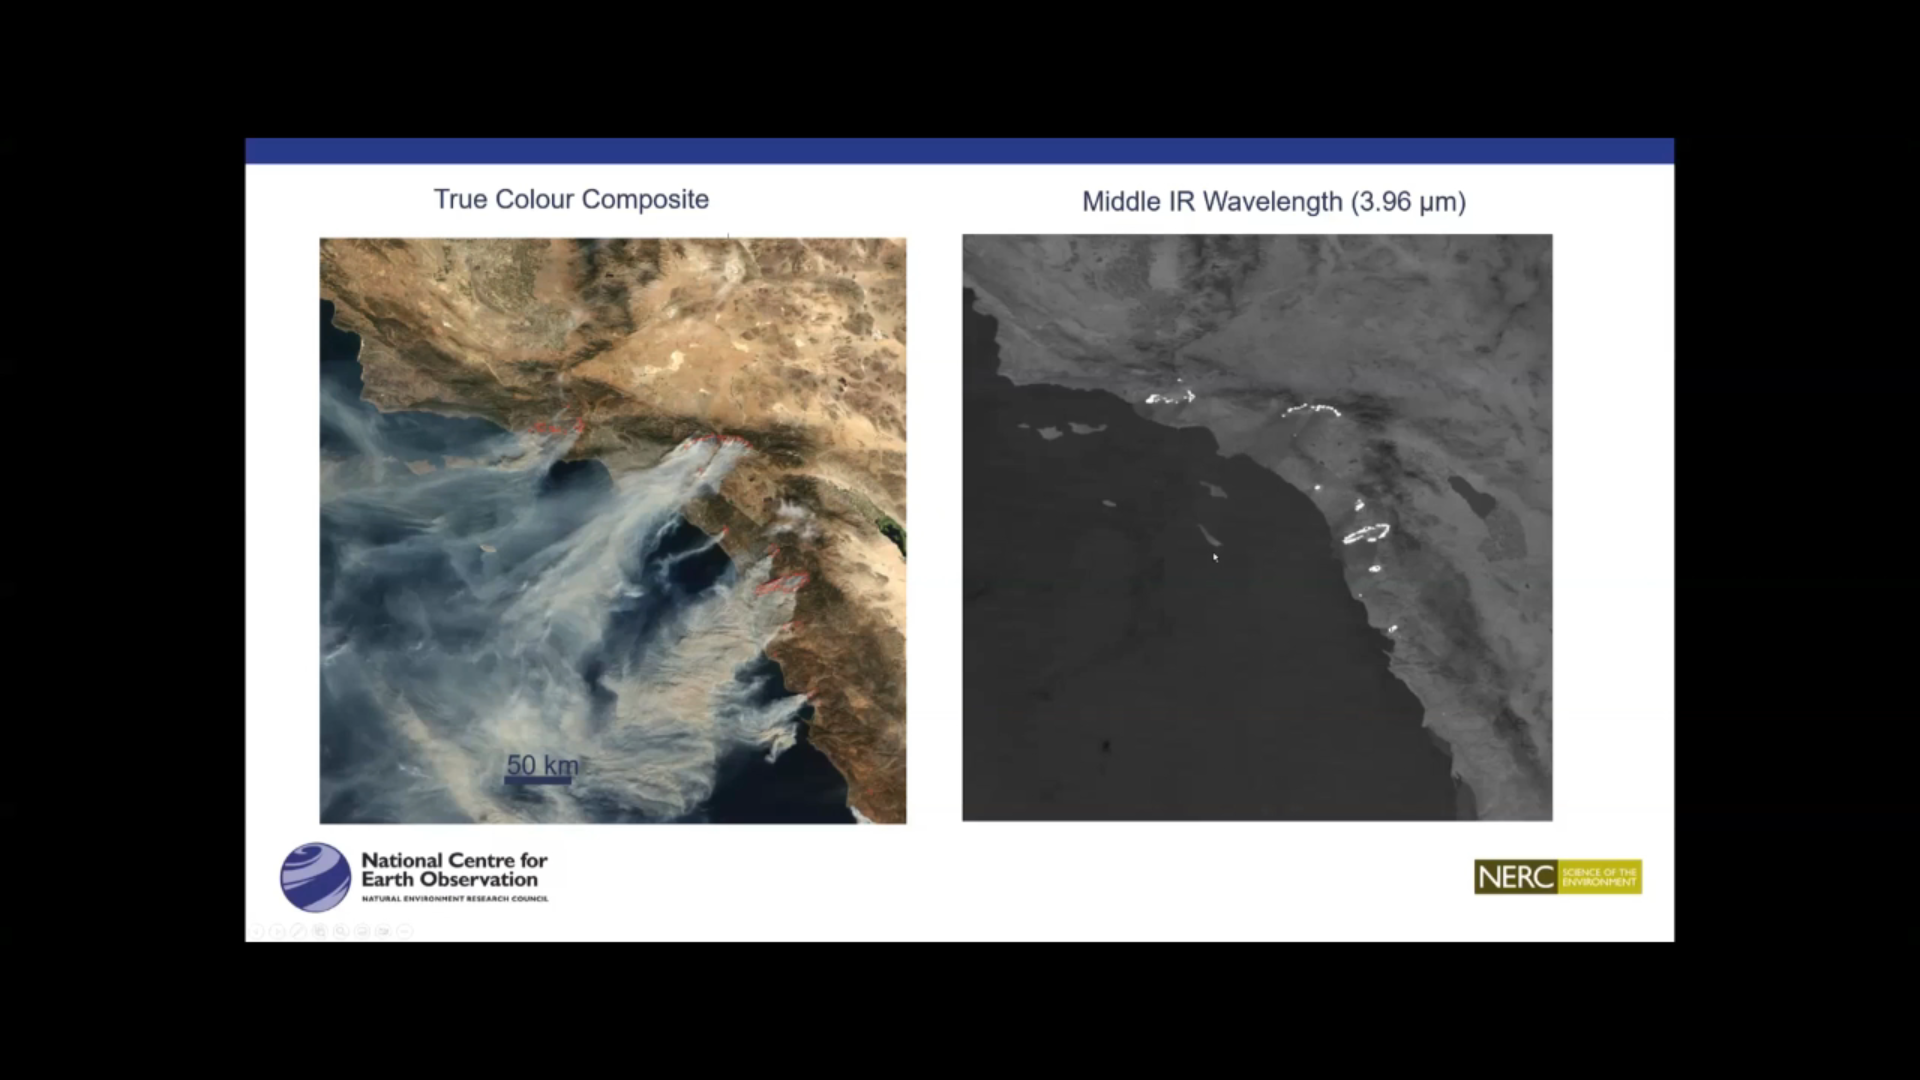
Andrea Meraner talks about wildfire detection and vizualisation by using FCI data.
The Flexible Combined Imager (FCI) instrument on-board the Meteosat Third Generation (MTG) satellite introduces unprecedented detection capabilities for wildfires from geostationary orbit. This presentation offers an overview of the instrument, focusing on characteristics relevant for identifying hotspots. We will then present the first case studies of wildfire and smoke observations across Europe and Africa. These examples are based on preliminary commissioning data collected during the extreme events of Summer 2023. We will explore visualisations utilising RGBs such as Fire Temperature and True Colour, leveraging the new FCI channels.
Lecture slides
Federico Fierli shows how to use satellite imagery for observing aerosol.
Aerosol particles are a key component of weather and climate atmospheric system. Satellite offer the unique advantage to provide a global view with a long-term continuity. We will explore the methods to retrieve aerosol burden with the associated uncertainties for several cases as dust plumes and wildfire emissions. The presentation addresses the data chain from retrieval using different orbital geometries, spectral regions and geophysical products to advanced products as Climate Data Records to the assimilation process.
Lecture slides
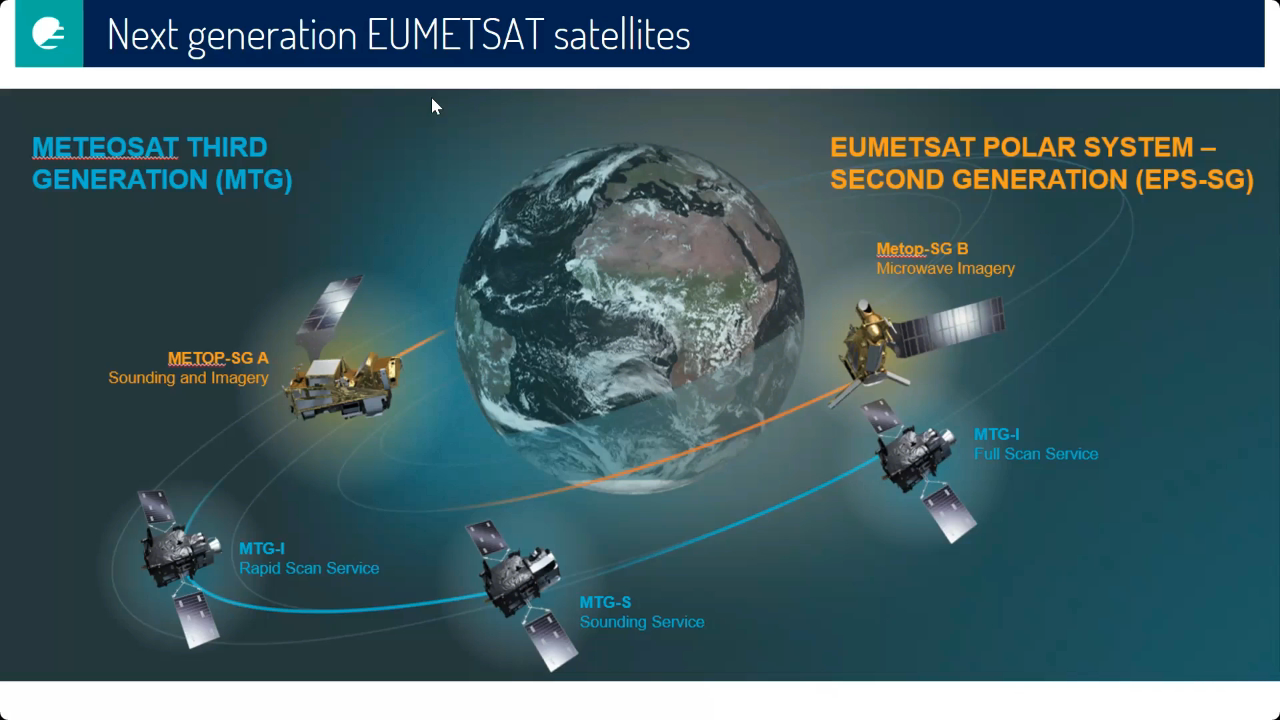
Jochen Grandell talks about what MTG is, comissioning of satellite system, schedule for data product releases and more.
Meteosat Third Generation is a system consisting of 4 MTG-I and 2 MTG-S satellites. This presentation provides on outlook into what MTG is, what commissioning of a satellite system means, the schedule for data product releases, and how MTG-I and MTG-S eventually will work together.
Lecture slides
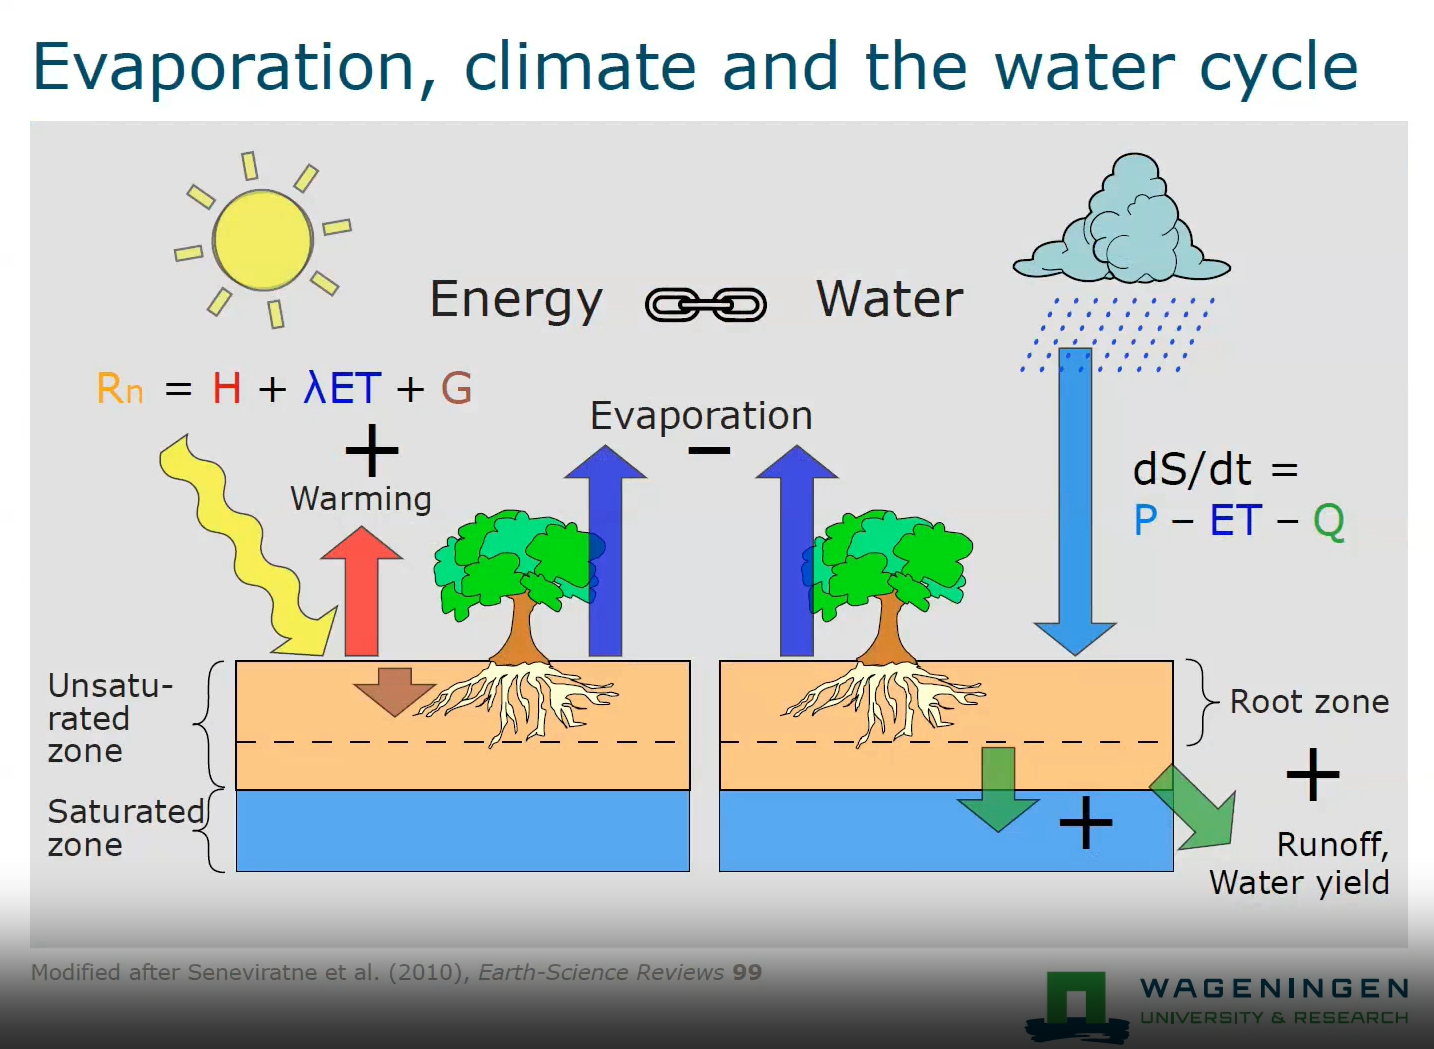
Ryan Teuling talks about soil moisture and land surface energy balance.
Heatwaves and droughts are often strongly linked due to the increased sensible heat fluxes at the land surface warming the atmosphere above. In this talk, I will discuss how soil moisture depletion changes the land surface energy balance, and how the evolution of changes in the land surface energy balance is different for different land cover types (i.e., forest and short vegetation). The use of high-resolution satellite soil moisture data for drought monitoring is also discussed.
Identify and locate features indicating regions of possible turbulence.
This module teaches you how to use satellite data to observe and analyze atmospheric phenomena. It will show you which products can be used to identify dust storms, smoke, fires, precipitation, etc.
To access the resource click here.
Note: all resources are provided as an external link which redirects you to https://eumetcal.eu where you will need to create a user account in order to gain access to the course
Identify and locate aerosols and particulate pollution.
This module teaches you how to use satellite data to observe and analyze atmospheric phenomena. It will show you which products can be used to identify dust storms, smoke, fires, precipitation, etc.
To access the resource click here.
Note: all resources are provided as an external link which redirects you to https://eumetcal.eu where you will need to create a user account in order to gain access to the course
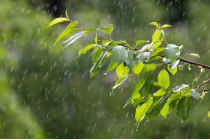
Identify and locate moisture features, precipitation types and amounts.
This module teaches you how to use satellite data to observe and analyze atmospheric phenomena. It will show you which products can be used to identify dust storms, smoke, fires, precipitation, etc.
To access the resource click here.
Note: all resources are provided as an external link which redirects you to https://eumetcal.eu where you will need to create a user account in order to gain access to the course
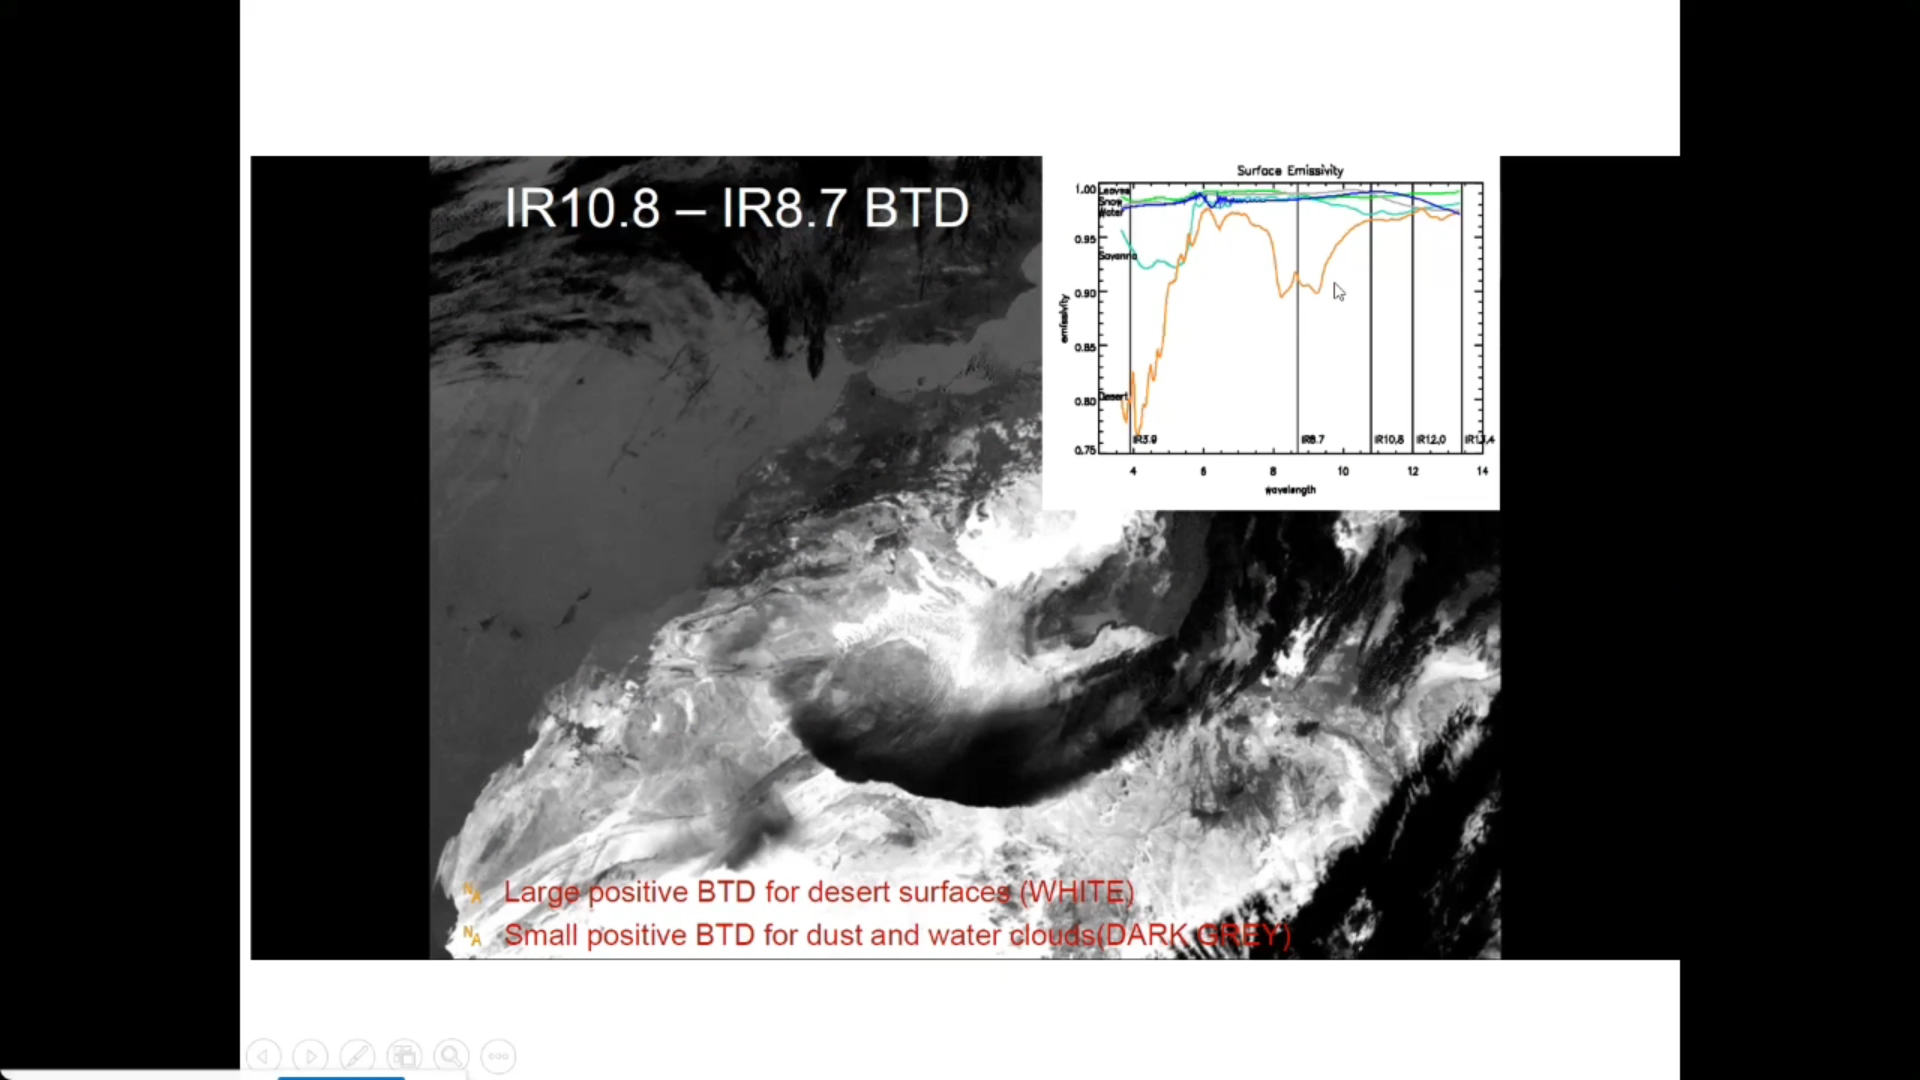
Learn to distinguish between dust and smoke.
This module teaches you how to use satellite data to observe and analyze atmospheric phenomena. It will show you which products can be used to identify dust storms, smoke, fires, precipitation, etc.
To access the resource click here.
Note: all resources are provided as an external link which redirects you to https://eumetcal.eu where you will need to create a user account in order to gain access to the course