
Weather
Sven-Erik Enno talks about the Lightning Imager instrument onboard MTG-I1 satellite.
The Meteosat Third Generation (MTG) Lightning Imager (LI) was declared operational on October 31, 2024. This brand-new European Instrument is devoted to the real-time monitoring and characterization of lightning activity over Europe, Africa, and a large portion of the Atlantic Ocean. This presentation will demonstrate LI observational capabilities from individual lightning flashes to hemisphere-scale statistics and present the outcome of the latest LI performance assessments.
Go to lecture slides
Vesa Nietosvaara gives an overview on the MTG programme and discusses FCI instrument and it's uses onboard the MTG-I1.
The complete constellation of Meteosat Third Generation (MTG) consists of three spacecraft: two imaging satellites and one sounding satellite. The first imaging satellite, MTG-I1 is now operational under the name Meteosat 12. The satellite carries two important instruments – Flexible Combined Imager (FCI), a successor of SEVIRI on MSG, and a Lightning Imager (LI), the first space-based instrument monitoring lightning occurrence over Europe, Africa and South America from geostationary orbit. In this talk, we will focus on the FCI and how it can help monitoring the weather and improving nowcasting. Forecasters will now be able to track the development of storms in near-real time with better accuracy, issue more precise and timely warnings about severe and dangerous weather events but also monitor fog development and dissipation, dust outbreaks, forest fires and many other features.
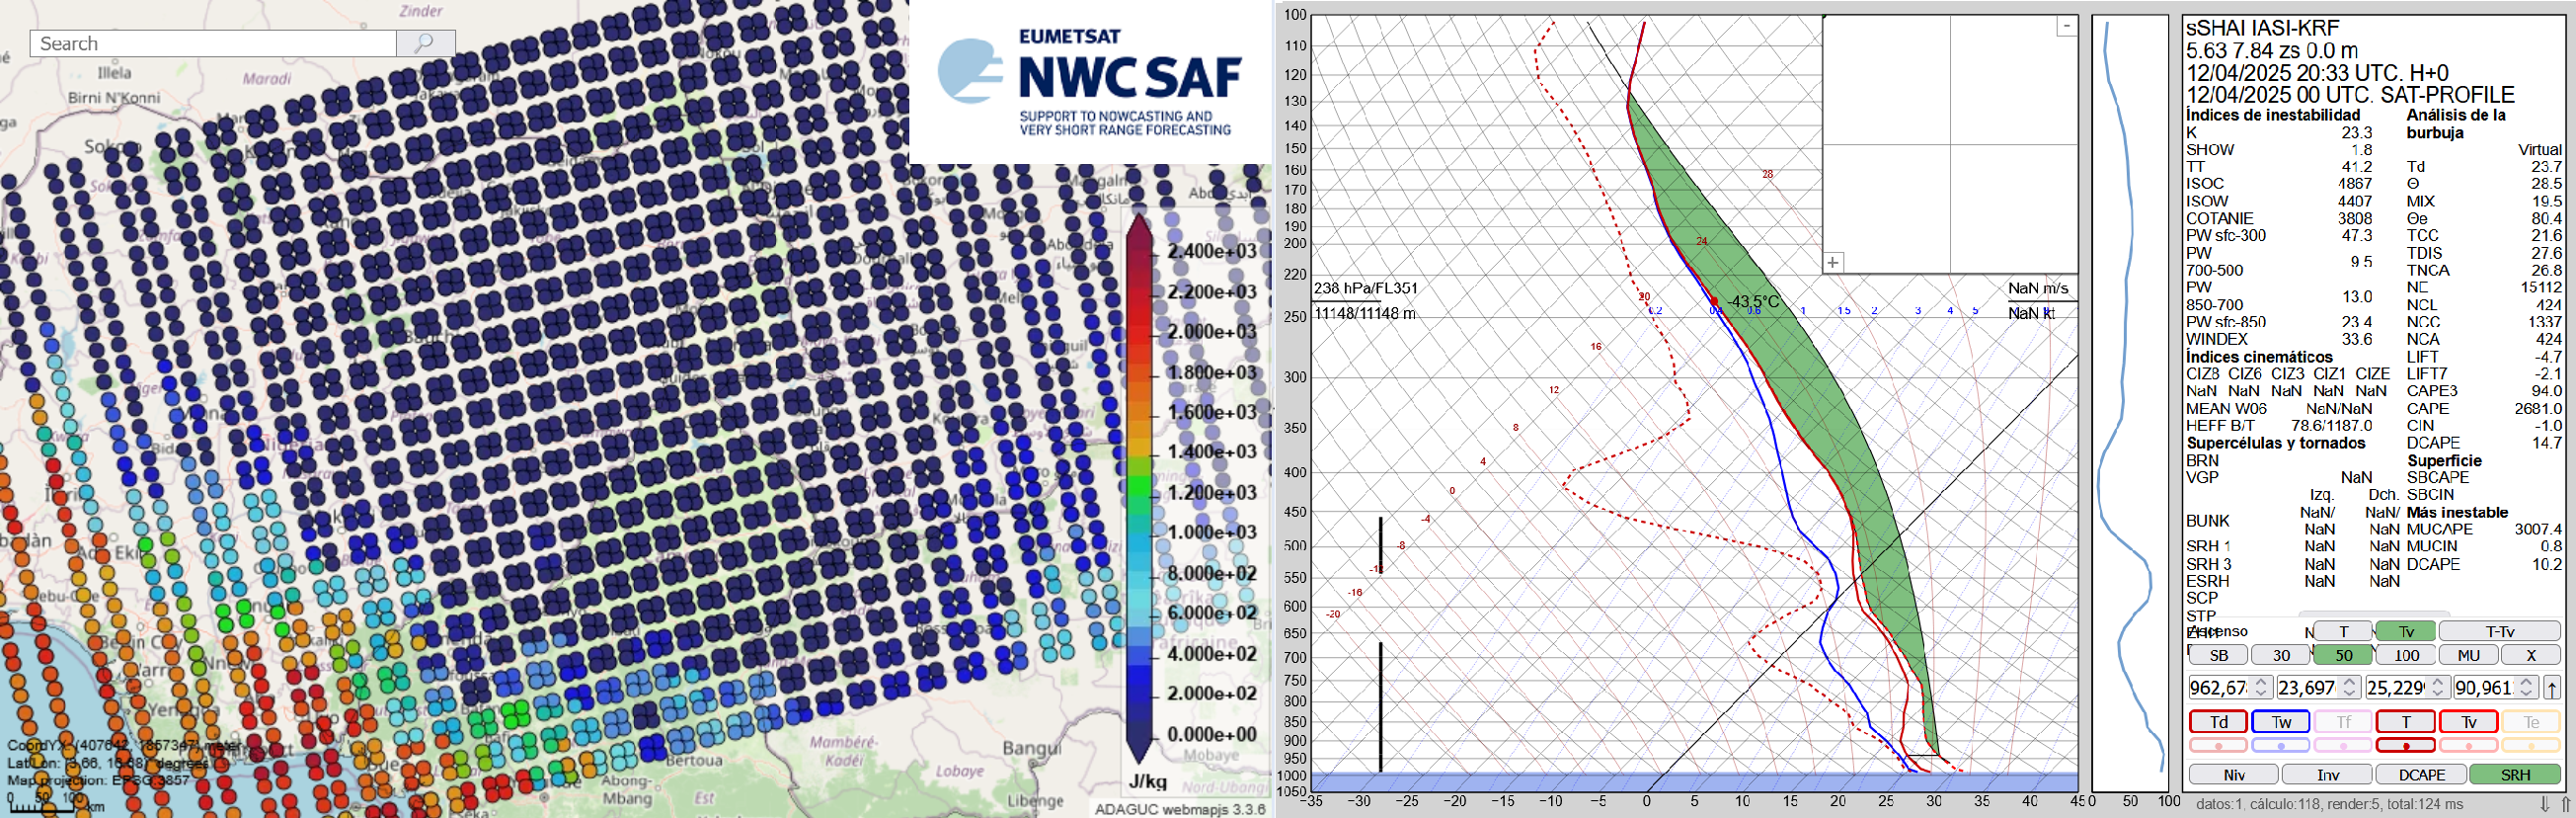
The Nowcasting SAF is planning a new software package dedicated to the new geostationary MTG-S Infrared Sounder instrument (IRS). This new software package will generate Satellite Humidity And Instability products (sSHAI) that will be key in Nowcasting using the IRS instrument. It will also deliver services to make the best use of MTG-IRS channels and combine its virtues with those of the MTG imager FCI.
In this Workshop you will learn about these revolutionary product and services. You will also have a taste of what will come in a few months with MTG-IRS by using in real world applications the prototype product obtained from the polar orbiting IASI instrument.
The Workshop is comprised of 4 presentations:
Part 1. X. Calbet (AEMET) - Introduction GEO-S
Part 2. N. Peinado-Galán (AEMET) - sSHAI prototype
Part 3. N. Peinado-Galán (AEMET) and X. Calbet (AEMET) - Practical cases with course attendants using SHAI on the EWC
Part 4. Miguel-Ángel Martínez (AEMET) - Other services from the GEO-S package: quickIRS, sSHAI_ES and Remapping tool
This document summarizes how to create a new RGB scheme and how to adapt an existing RGB for a new imager.
RGB images can be composed in many different ways. To avoid ambiguity and incorrect interpretations, WMO and EUMETSAT work to standardize the RGB images used by weather forecasters. Experts develop optimized methods to create RGB images that provide high quality visual information about specific features. The use of these standard RGBs helps meteorologists easily understand each other. The standard RGBs have schemes, or recipes, describing how to create them.

Learn more about:
- cloud classification scheme
- recognizing cloud types in satellite imagery
- a satellite product that provides cloud type information
- how cloud top temperature is derived from radiation measurements by satellite sensors
- when and where cloud top temperature provides valuable information to the forecaster
This module covers two different topics. In the first part, the module introduces Luke Howard's cloud classification system and tries to answer the question of whether cloud type classification is possible from space. The second part introduces the concepts of long- and short-wave radiation and how they are used in remote sensing and explains how temperature information is derived from radiation measurements. The module closes with examples of how cloud top temperature information is used in meteorology.
To access the resource click here.

This guide is about the Cloud Type RGB, a new product for European users of GEO satellite data, which can be constructed using data from the Flexible Combined Imager (FCI) on the Meteosat Third Generation (MTG) satellite system. It uses one of the new FCI channels.
At the time the guide was created, FCI was not yet operational, so the characteristics of the FCI Cloud Type RGB were tested using preliminary commissioning data. Similar features were found as with the proxy data. Some examples created from the FCI preliminary commissioning data are presented in this guide.
The main application areas of the Cloud Type RGB are detection of very thin cirrus and higher-level aerosol clouds, and visual differentiation of cloud types, with some limitations. It can also provide some information about areas with dry airmasses.
Training module focusing on identification of volcanic ash and sulfur dioxide plumes from satellite imagery.
Volcanic eruptions have a severe impact on human health, economy and traffic. They regularly cause natural disasters such as tsunamis and lava flows that are difficult to predict. Volcanic eruptions emit large amounts of gases, ash, and other aerosol particles into the atmosphere. In the short term, volcanic ash plumes have serious impacts on aviation. It is, therefore, very important to monitor the extent, height and duration of such events to properly estimate the impact of eruptions at various spatial and temporal scales, using data from different instruments on different satellites.
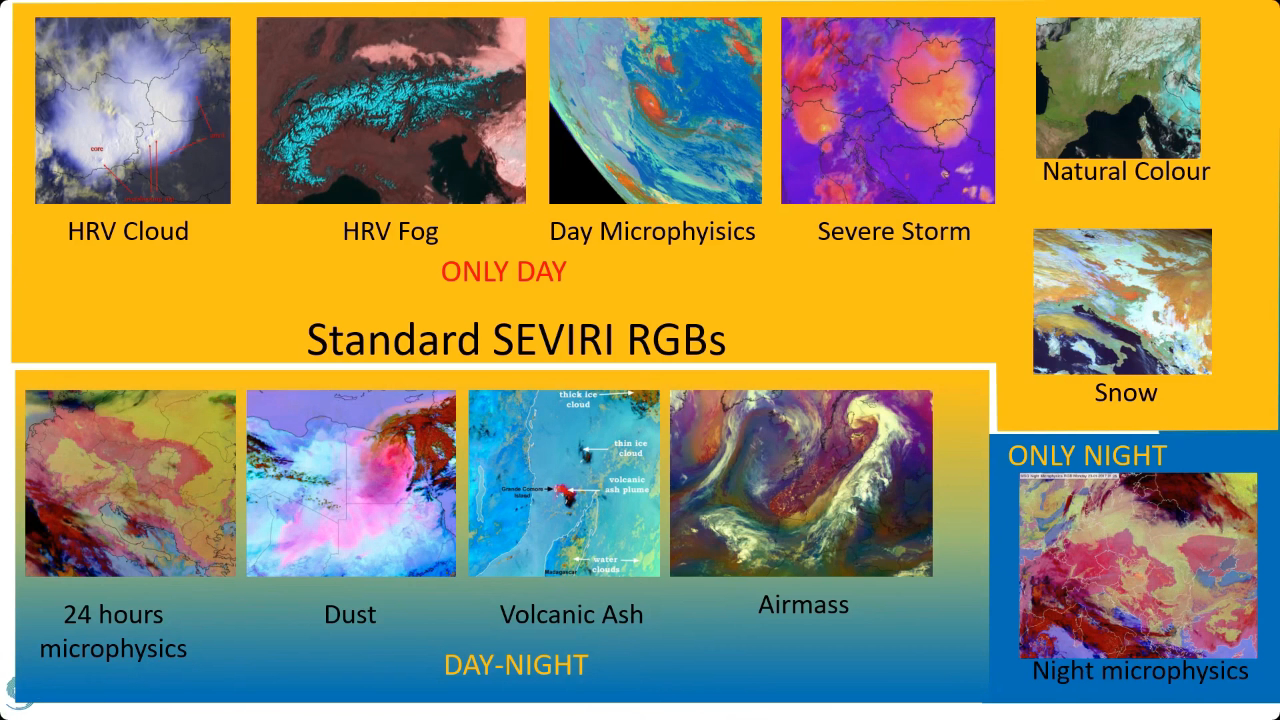
Zsofia Kocsis goes over the priniciples of RGB imagery, reasons for its use and guidelines for their creation.
This presentation covers what are the benefits of working with RGBs compared to single channels satellite data. We will cover how we can create RGBs, what makes an RGB good and we will also talk about what are the standard RGBs and why we like to use them.
Lecture slides
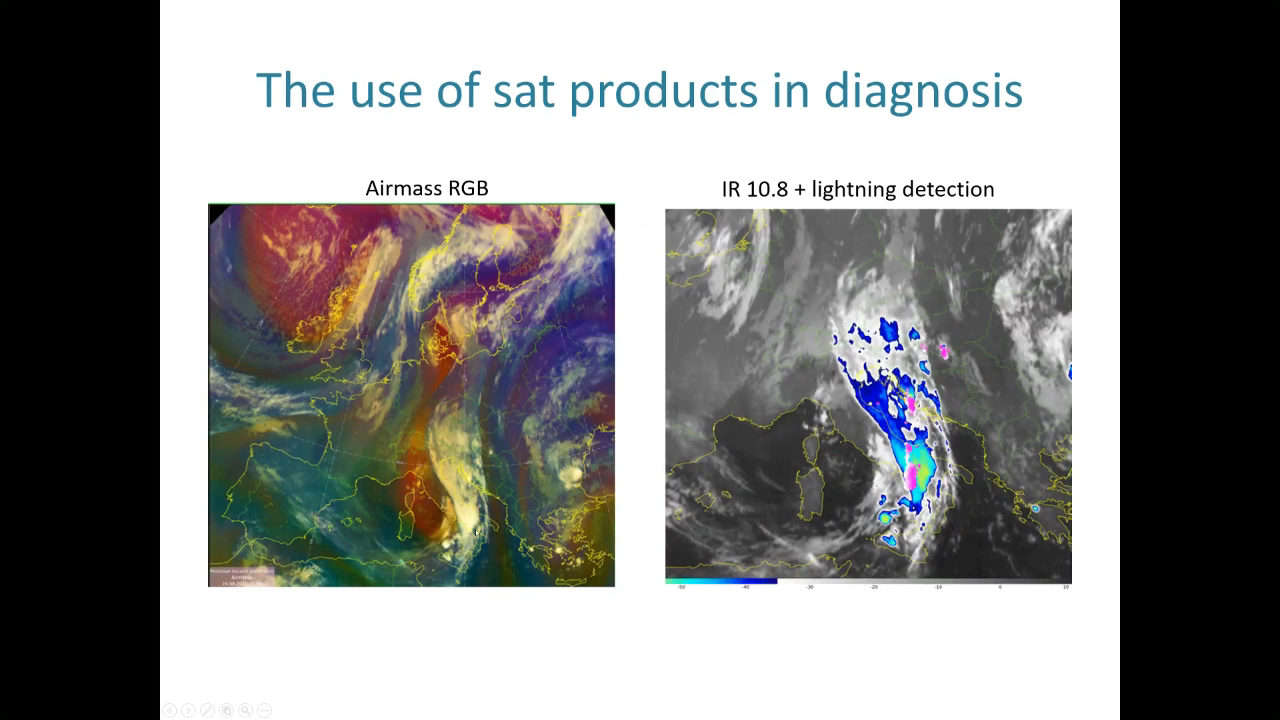
Vinko Šoljan talks about forecasting and nowcasting of deep moist convection, satellite products used, NWP outputs and more.
In this presentation, we will demonstrate the process of forecasting deep moist convection (DMC) at Croatia Control and how satellite products are utilized in this process. This includes large-scale analysis and diagnosis using satellite data, as well as monitoring and nowcasting existing DMC using satellite products and radar data. In DMC forecast we primarily rely on the ingredients-based methodology and NWP guidance.
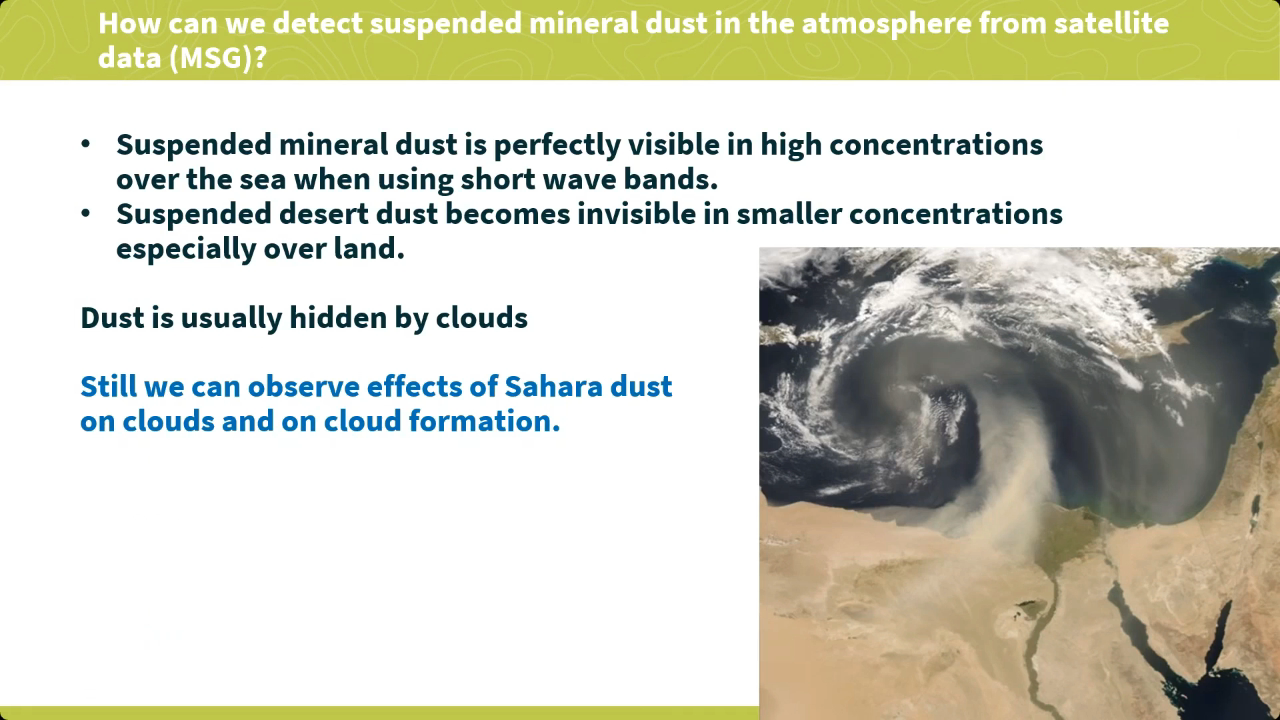
Andreas Wirth goes over the topic of Dust Infused Baroclinic Storms (DIBS) and explains the current forecast model inconsistencies regarding DIBS as well as their impact on weather.
Dust Infused Baroclinic Storms (DIBS) have a high impact on weather. Mineral dust particles in the atmosphere reduce sunlight at lower levels, reduce visibility and damp daily temperature maxima. Dust particles can have an impact on forecasted precipitation too, and in higher concentrations, dust particles can cause respiratory problems.
This presentation focuses on circulation pattern that causes dust transport towards Europe and on how to detect high dust loads in- and outside clouds from geostationary satellite imagery on the basis of recent examples.
Lecture slides
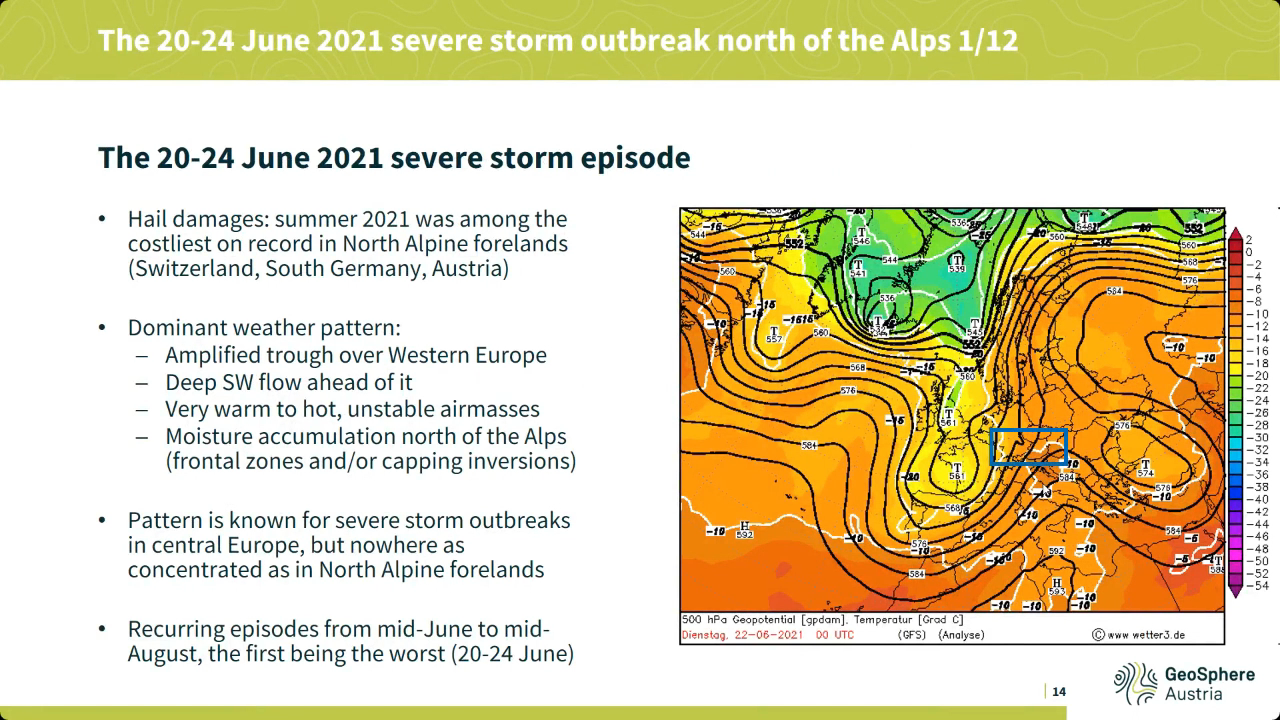
Georg Pistotnik covers the topic of drylines, shows it's relevance in severe weather development.
Drylines are boundaries separating warmer and drier from cooler and moister air, usually resulting from differential diurnal heating and therefore vertical mixing. The most common and distinct dryline in the Alpine region is the boundary between Foehn winds (dynamically driven) and upvalley/upslope circulations (thermally driven). Thunderstorms often form along drylines and intensify when they move onto their moist side, where CAPE and vertical wind shear are systematically enhanced and favor convective organization. This presentation highlights how station and readiosonde data, high-resolution satellite imagery and even webcam images can be integrated into the nowcasting of drylines and resulting thunderstorms, using some prominent cases of the past few years in the eastern Alpine region.
Lecture slides
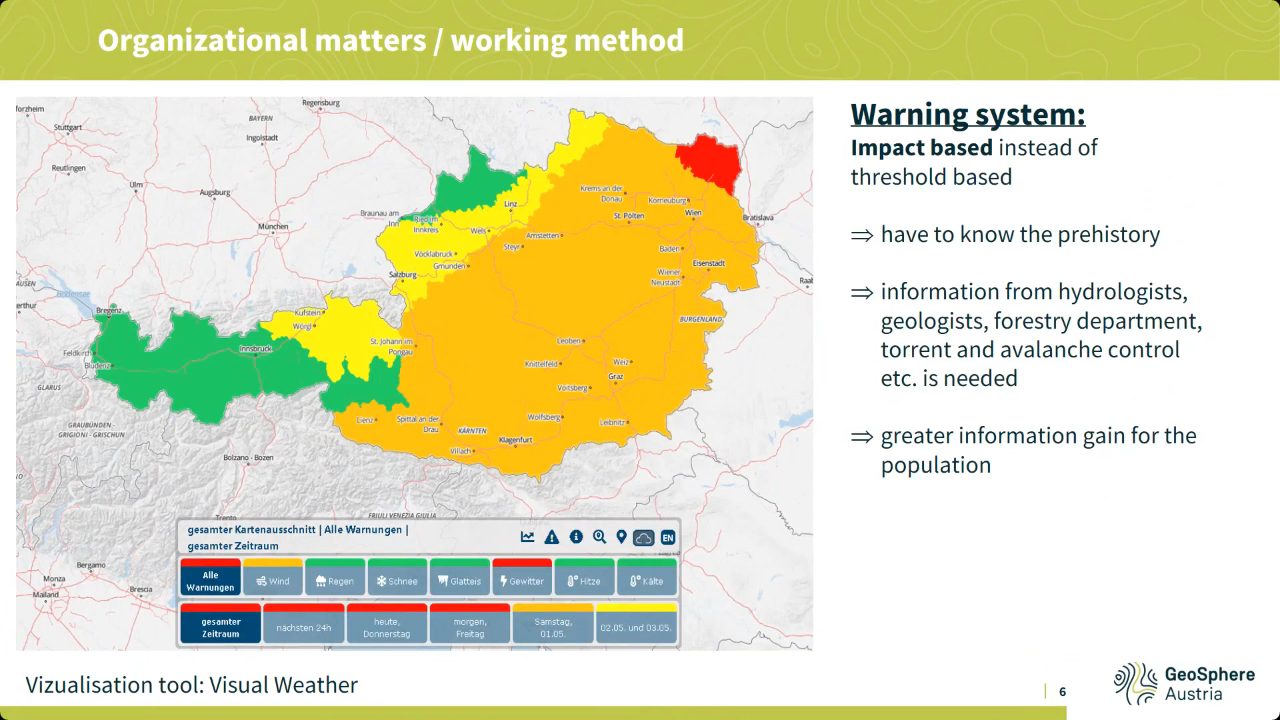
Liliane Hofer speaks about prognostic service of Austria, work organization, regional weather forecast specifics such as southerly föhn winds and others.
Various phenomena, some of which are regionally specific, such as southerly föhn winds or precipitation in northern or southern congestion, make the weather forecast in Austria very challenging at times. In addition, the topographically highly structured landscape also results in quite small-scale differences, for example in inversion weather conditions. All this and special customer products are highlighted in this presentation, as well as the basic working environment of the forecasters and, of course, the satellite products used for this purpose.
Lecture slides