
Identify and interpret broad scale, synoptic and mesoscale systems
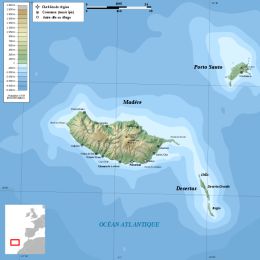
On 1st October 2009 almost 60 mm of precipitation have fallen in 6 hours on a mountain station in Madeira Island.
On 1st October 2009 almost 60 mm of precipitation have fallen in 6 hours (16-22 UTC) on a mountain station in Madeira Island (Areeiro, with a height of 1510m), which fitted the orange warning criteria (40 to 60 mm in 6 hours) used at the time at the Portuguese Met. Service. In a 24 hour period (12UTC on 1/10/2009 to 12 UTC on 2/10/2009) a total amount of 101 mm was recorded at the same weather station. An old large-scale low-pressure system was located over the Azores, to which a clear convective activity was related. These convective events were taking place to the northwest of Madeira Island and no special signal could be detected in satellite imagery at a first look over the island. Therefore, this episode could be considered to be kind of silent for this mean of observation.
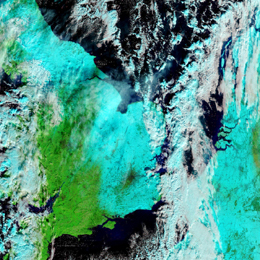
A cold air outbreak during the second half of December 2009 brought mayhem to Western Europe and Croatia.
A Cold Air Outbreak directed by a strong anticyclone near Greenland directed polar air towards Europe. With the still relative warm waters of the North Sea and the genesis of several small scale disturbances over Scandinavia and Germany the ingredients were in place for many centimeters of snow in the UK, Netherlands and Germany.
The largest impacts the snow brought were experienced from 16 to 20 December. The largest railway station in the Netherlands (Utrecht CS) was closed on 17 December due to snowfall leaving thousands of passengers stranded. During the morning rush hour of 18 December there was a record breaking 671 kilometers of traffic jam. In England the snowfall had also lead to chaos when motorists were stuck on the A21 during the evening and night of 17 to 18 December. The next night five international EUROSTAR trains were stuck in the tunnel under the English Channel leaving 2.000 passengers trapped for 16 hours.
From a meteorological point of view this cold air outbreak is interesting as many parts of Europe were affected and that there were different conceptual models responsible which can be distinguished using satellite and numerical weather data. All of these are described in detail in this case study.
A cyclone developed over Spain causes heavy snowfall in the Mediterranean and Central Europe.
Between 10 and 12 February 2010 a Mediterranean low caused extreme snowfall in Styria and Carinthia, the south of Austria. This case study describes the synoptic situation and the further weather development during that time period. The comparison of the expected with the actual precipitation should show the accuracy of the forecast. On the basis of this case, an overview of the difficulties of precipitation forecast, especially for snowfall, is given.
During early morning and morning on 20th February 2010 an extreme and rare flash flood event has occurred in the Portuguese island of Madeira.
In the coastal city of Funchal an amount of 111.5 mm (05:10-11:10 UTC) occurred in a 6-hour period (with a 24h amount of 144.3 mm). Higher amounts were recorded in the mountainous weather station Pico do Areeiro, at 1510 meters, with a 6-hour peak of 272.1 mm (08:50-14:50UTC). This mountain area is right upstream of Funchal, therefore, the precipitation in the mountain simply flowed downslope along rivers that are usually small, summing up to an already high amount of water in lower altitudes. A precipitation time-lag between Funchal and Areeiro is clearly depicted in the temporal evolution of 10-minute precipitation. Note values in excess of 10 mm/10 minutes in Funchal and 15mm/10 minutes in Areeiro during the most intense time periods. The Portuguese met. service followed this extreme event issuing gradually higher levels of precipitation warnings since the day before: yellow warning at 19:27 UTC on 19th, orange warning at 08:53 UTC on the 20th and red warning one hour later, at 10:03 UTC.
An upper level low causing heavy snowfall in the Mediterranean and Eastern Europe.
An upper level cold core low depresses due to heavy cold air advection backside of the trough over the Iberian Peninsula. Heavy Snowfall in the Mediterranean area and in the following days in Austria and East Europe was the result of an intense cyclogenesis over the relatively warm Mediterranean Sea.
In addition to the heavy snowfall a very strong Bora established in the east Adriatic coast due to the great temperature and pressure gradient over the Dinaric coastal mountain. As a result of the very strong wind even some infrastructure was damaged in this area.
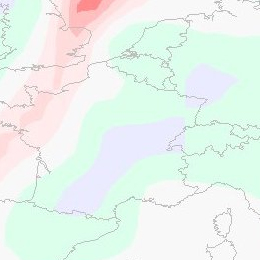
On September 12th 2010 a major PV anomaly, in the rear of a cold front, moved over France and hit Germany and Switzerland in the late evening and also Austria during the night. On the front side of this anomaly convective cells developed and brought some rain showers and thunderstorms.
On September 12th 2010 a major PV anomaly, in the rear of a cold front, moved over France and hit Germany and Switzerland in the late evening and also Austria during the night. On the front side of this anomaly convective cells developed and brought some rain showers and thunderstorms. At first the ECMWF-model, especially the 00 UTC run from September 12th, was lacking performance shifted the PV maximum more westward. In this case study we analyse not only the synoptic situation, but also the model error. In the following we take a look at the MPEF (Meteosat Product Extraction Facility) Divergence product, how it works and whether it would have been helpful in this case as a nowcasting tool.
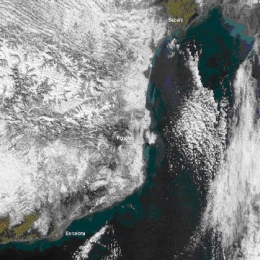
This case study will present the circumstances and explain the processes that led to severe flooding in both Slovenia and Croatia in September 2010.
Last days of summer 2010, Slovenia and Croatia were marked by heavy rainfall and floods. The precipitation amounts in some parts of Slovenia was exceeding all recorded rainfall amounts in the last 100 years causing immense property damage and even human casualties. In the western part of Slovenia locally more then 500 mm of rain fell in 48 hours. Huge part of Slovenian territory was flooded, which included also more than 8200 houses.
The amount of rain in Croatia was not so great. In Gorski Kotar region (mountain area in the western part of Croatia) and in Istria in three days 200 to 300 mm of rain was reported causing mostly flash floods. The main problem in Croatia was the water that was brought by Sava river from Alpine region. Because of the instantaneous unit hydrograph the southern part of Zagreb was flooded for several days.
Even though the prognostic material was giving the clear sign of a probability of heavy rain and the warnings were issued several days in advance, the amount of precipitation was so big that the damage was not possible to avoid.
This case study explains the processes that led to severe flooding and specialty of this study is that it brings and introduces H-SAF as a tool for detail monitoring which is of great help to the meteorological and hydrological specialists during and after the event. In this case study products of H-SAF are explained and some samples are presented.
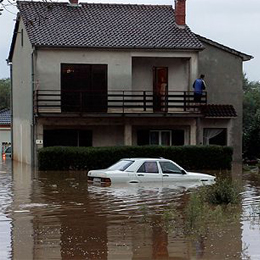
During the night from 24 to 25 September 2010 heavy rain caused flash-flooding of the town of Pula and the surrounding area.
The case study shows that the flash floods in Pula were the result of a convective system which developed in the convergence zone caused by a specific placing of two Mediterranean cyclones. Generally, the Mediterranean region is recognized as one of the most cyclogenetic regions in the world. Mediterranean cyclones are classified in 3 major types: Genoa cyclones, Adriatic cyclones and non-Genoa cyclones. Although it is rather rare, the major-type cyclones can exist simultaneously belonging to the theoretical category of twin or eyeglass cyclones. The most common twins are the simultaneous Genoa and Adriatic cyclones (Brzovic, 1999), therefore classified as the 4th type of Mediterranean cyclones. Depending of the season and general synoptic conditions, the paths of the cyclones in the Mediterranean basin are diverse. On their way through this complex geography, they can produce a range of extreme weather phenomena such as heavy orographic precipitation, thunderstorms, supercells and mesoscale convective systems.
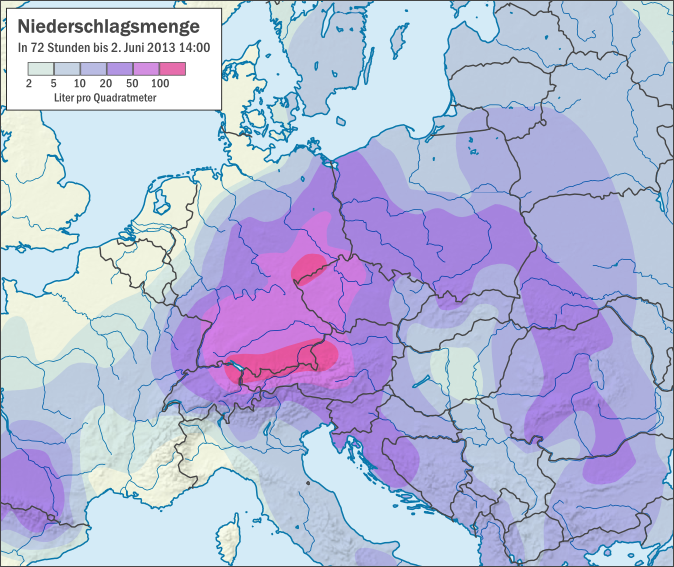
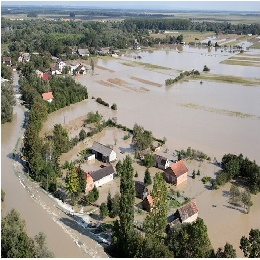
This case study is analysing floods that occurred in central Europe during the period of June 2013.
The case study is analyzing floods in central Europe during the period of June 2013. The case starts with the development of a trough over central Europe on 22 May, seven days before the floods. From 29 May on, the trough intensified the rainy weather, causing southern and southeastern Germany to experience continuous rain over several days. Altogether the countries of Germany, Poland, Czech Republic and Austria were seriously affected by floods and the damages in Bavaria (Germany) only were estimated to 1.3 billion euros.
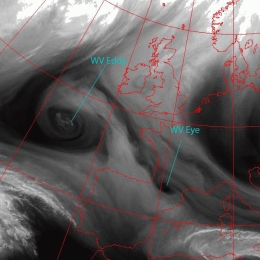
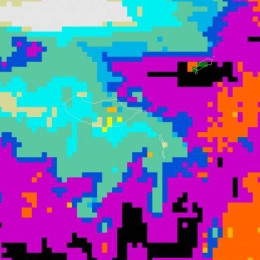
Vortices at different scales in the WV image; small scale dark circles (eyes) represent sinking stratospheric air.
WV Vortices in the northern hemisphere are cyclonically rotating and therefore associated with a trough or low in the upper levels of the troposphere. This can also be seen in PV fields, which show high values near the centre of the vortex. High values of PV are related to low tropopause height, which explain the Dark Stripe in the WV image. The Dark Stripe implies that relatively dry stratospheric air is penetrating down into the higher levels of the troposphere. Within the Dark Stripe, a local maximum of PV can often be seen. Because of the local maximum, the cyclonic circulation is enhanced. Therefore, the Dark Stripe is being deformed and the moister air spirals around the dryer air. This process either leads to the formation of a WV structures. Investigation of about 100 cases over a period of two years shows that a distinction can be made between different WV structures. The two prevailing structures are the so-called WV Eddies and WV Eyes.
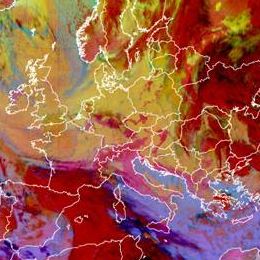
Waves are cloud bulges at the rear edge of Cold Front cloud bands, indicating the initial stage of secondary cyclogenesis.
A Wave development can be treated as a substructure in a Cold Front and indicates the initial stage of cyclogenesis. According to well-known polar front theory a low pressure area in the lower levels of the troposphere can develop if a small-scale disturbance is superimposed on the synoptic-scale air stream. This small-scale disturbance is caused by a transverse circulation within the baroclinic zone of the Cold Front. The transverse circulation is released by frontogenesis in the horizontal wind field that causes a fall in pressure, convergence and the production of cyclonic vorticity in the lower levels of the troposphere at the warm edge of the baroclinic zone. The consequence of this disturbance is that cold air moves south-eastward and warm air moves north-westward; this circulation is superimposed on the eastward-moving front. During this circulation a strengthening of the low pressure area occurs and further development of a new cyclone can be observed. In the case of the cloud bulge of a Wave a small scaled substructure within the stream lines can be observed: a strongly ascending Warm Conveyor Belt accompanies the area of the cloud bulge; a drier stream from behind approaches this relative stream; in the lower isentropic layers relative stream lines immediately south of the Wave form a saddle point - this is a consequence of the cyclonic circulation in the Wave area in the lower layers.
A Detached Warm Front shows a cloud configuration similar to that of a Warm Front Band, but is detached (isolated) from the Cold Front cloud band. It can be found at the leading edge of an upper level/thickness ridge.
In the case of an eastward moving classical frontal system the Detached Warm Front is mostly observed within the eastern branch of a pronounced synoptic scale ridge in the height and thickness fields, accompanied by strong winds in higher levels of the troposphere (approximately at 500 hPa) which blow normal to the movement of the ridge system. A possible and often observed indication for the formation of a Detached Warm Front is a splitting of the wind field within the mid- and upper levels of the troposphere in the area of the Warm Front into a north-western and a strong southern stream. This causes the cloud field of the Detached Warm Front to move more or less rapidly southward within the eastern branch of the upper level ridge which is, in this case, very close to the high gradient zone of equivalent thickness. The original frontal system, which is situated further north, moves from west to east. Consequently the different air streams cause two WA maxima. WA maxima contribute to upward motion which is one reason for the maintenance of cloudiness.