
Satellite skills and knowledge for operational meteorologist
Listed here are other resources related to Satellite skills and knowledge for operational meteorologist tag:
Note: click on an image to open the Resource
Thomas August (EUMETSAT) presents the current polar satellite sounders and makes a comparison with the capabilities of the future MTG infrared sounder
Satellite infrared sounders like IASI allow retrieving the vertical structure of the atmospheric humidity. Their measurements are exploited in synergy with the microwave (MW) sounders, when such companions are present on the same platforms as is the case in the operational EUMETSAT Polar System (EPS) programme and in the EPS-Second Generation (SG). This synergy increases the yield and quality of sounding in cloudy pixels. The future infrared sounder (IRS) onboard Meteosat Third Generation (MTG) will operate without MW companions. It will however provide unprecedented spatio-temporal sounding, with a typical ground-resolution of 7km and observations every 30 minutes over Europe.
The extensive utilisation of machine learning guarantees the provision of reliable atmospheric temperature and humidity profiles and uncertainty estimated within less than 30 minutes from sensing. We present here the characteristics of satellite thermodynamic profiles from the current and future missions and the experience made in studies with meteorological services to contribute to nowcasting severe weather events, and prepare to the future sounder missions.
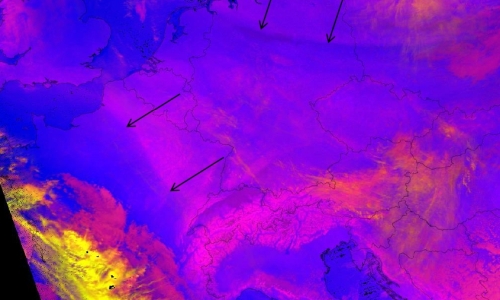
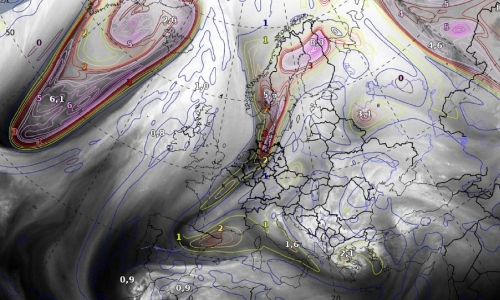
Bryan Guarante (University of Wisconsin) uses a COMET course to explain the usefulness of analysing water vapour images with a goal of assessing the NWP fields.
In dynamically-active regions of the atmosphere, water vapour imagery approximates the same surface as the 1.5PVU height or pressure surface. Because of this, we can take advantage of the WV channels to find areas of mismatch between the NWP and the real atmosphere to adjust our synoptic scale forecasts.
Ivan Smiljanić (EUMETSAT) shows how the current MSG satellites can see low-level moisture and how does the moisture affect the weather.
High humidity in the air, close to the ground, could make you feel soggy in the summer but otherwise you won’t notice it. So why is it important to know all about it – is there a lot or very little moisture, where is it, what are dynamics of the moisture field? Well, moisture is really a key ingredient for many features in the atmosphere that can affect our daily lives to a high degree, from thunderstorm clouds to a fog or rime. In this session we will see how water vapour becomes a fuel for features in atmosphere to form, through a few real examples.
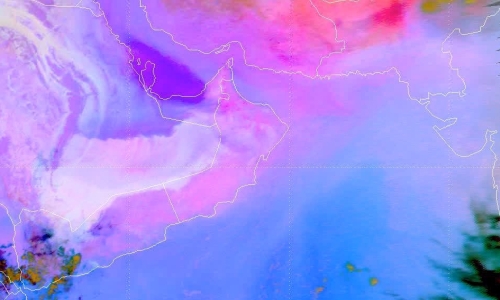
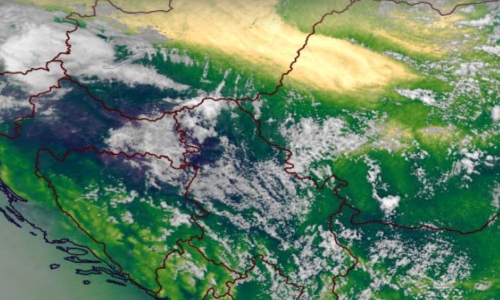
Hans Peter Roesli showcases the usefulness and characteristics of the 0.9 micrometer band channels, one of which will be available with MTG satellites.
At the time of refining the FCI requirements for nowcasting applications, numerical forecasts had much difficulty in handling low-level humidity (low-level forecasts rapidly dried with increasing forecast time). This was one of the reasons why the expert team for nowcasting proposed to add in MTG’s FCI.a solar water-vapour-absorbing in the 0.9-micron region (now NIR 0.914 micron) alongside the clear NIR 0.865 micron band. Although nowadays operational numerical models have overcome the moisture problem, NIR 0.914 might still find valuable applications, in particular when accounting for the frequent imaging of the same scene in daylight.
MODIS includes a clear NIR 0.8585 band and 3 bands in the 0.9-micron region: 0.936, 0.940 and 0.905 micron, with decreasing water vapour absorption. Selecting NIR 0.8585 and the weakest absorbing NIR0.905 as proxy bands for FCI some meteorological situations were investigated, where low-level humidity monitoring could have been beneficial to nowcasts. MODIS flying on Terra and Aqua usually deliver two daylight overflights of the same scene, which allows for a rough appreciation of evolution in time.
Gao&Kaufman (2003) discussed the MODIS bands in view of the MOD05/MYD05 products for Total Precipitable Water Vapour. Based on their paper MODIS imagery of the reflectivity ratio 0.905/0.8585 was produced as a proxy for FCI. Taking the ratio is simple and damps further the (minor) differences in background reflectivity between the two bands. It was found that the ratio generally varies between 0.6 (humid boundary layer) and (dry boundary layer), as already given by Gao&Kaufman.
Examples under clear European skies will show situations of old frontal zones, convergence lines or north foehn. A more complex situation of low-level moisture advection under cloudy skies over the Po Valley affords the frequent FCI imaging, in order to get the full picture of the moist-air advection.
Pieter Groenemeijer (ESSL) presents his findings in using low-level moisture proxy data from polar orbiting satellites at European Severe Storms Laboratory training events.
In preparation for MTG data, ESSL is carrying out a series of expert workshops and Testbeds in collaboration with EUMETSAT. At both event types, the increased capabilities of detecting low-level moisture from geostationary orbit, which the MTG program will enable, have received a high amount of attention. In our presentation, we will discuss a number of convective storm cases that were studied using proxy data from polar-orbiting instruments, such as MODIS. One of the ways to visualize low-level moisture is by depicting the ratio of the 0.91 and 0.85 μm channels with an intuitive color scale. We will discuss to what extent this and other proxies for low-level humidity can be used to anticipate the presence of a crucial ingredient for severe deep, moist convection...
Ivan Smiljanić (EUMETSAT) presents water vapour channels that will become available with the launch of the third generation of Meteosat satellites.
Water vapour molecules, i.e. a water gas in the atmosphere, absorbs radiation in different parts of spectrum. With present geostationary satellite, MSG, this fact is mostly utilised in the spectral region around 6 or 7 microns, i.e. in the Infra-red region. With the next generation of geostationary satellite, MTG, it will be possible to observe the processes of WV absorption in the solar part of the spectrum, namely around 900 and 1300 nm. A bit different processes of absorption, but also scattering are happening around those wavelengths – we will take a look what is exactly happening there, and how to utilise these processes to detect different features in the atmosphere.
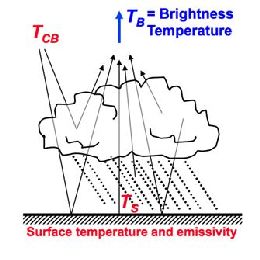
Wilfried Jacobs (DWD) introduces the water vapour channels in the 2022 EUMeTrain Water Vapour Event Week.
The target group of this presentation is participants that are not familiar or do not feel familiar enough for understanding the presentations during the entire week. The first presentation deals with basics of vapour water channels in satellite products. First, the principle of radiation and radiation transfer will be outlined briefly and put in relation to wave lengths of imagers and vertical sounders by considering weighting functions. The second part deals with some examples by using single channels. Finally, corresponding composites (RGBs) and their applications will explained in detail.
The purpose of the lecture is to provide a necessarily brief overview of the basic physical principles underlying satellite precipitation estimation methods.
The estimation of precipitation from space was attempted almost at the beginning of the satellite meteorology era by establishing a somewhat loose link between visible and infrared imagery of cloud tops and precipitation intensity at the ground. Since the early days estimation methods have qualitatively and quantitatively evolved with the advent of passive microwave sensors first and precipitation and cloud radars more recently. The purpose of the lecture is to provide a necessarily brief overview of the basic physical principles underlying satellite precipitation estimation methods trying to make the audience aware of what the sensors actually “measure” (radiation properties) and how these measurements are converted into precipitation intensity. All the methods, either based on “passive” or “active” sensing, are necessarily indirect and thus a clear understanding of the physics of radiation and of cloud hydrometeors is needed for the correct use of the products. In fact, such understanding helps in identifying the limitations of the existing precipitation products, which are too often used improperly or taken for granted. The lecture will try to pave the way to the in depth lectures of the other instructors on more specific topics of the discipline.
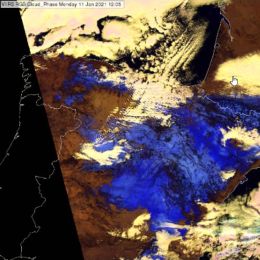
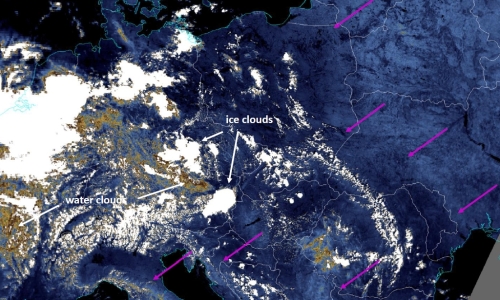
This case study treats snow detection with the Cloud Phase RGB.
During 07-10 January 2021, a winter storm produced a significant 30-50 cm snow depth over large parts of Spain. We studied this snow cover over the following ten days in VIIRS Cloud Phase RGB images. The Cloud Phase RGB is a composite image, which will also be available with data from the future Meteosat Third Generation (MTG) imager.
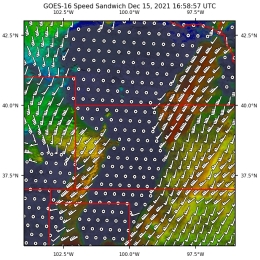
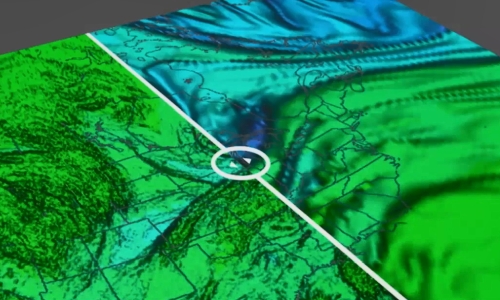
Jason Apke presents a method to derive winds from satellite data and shows some example applications.
The new Geostationary Operational Environmental Satellite (GOES)-R Series Advanced Baseline Imager and similar instruments represent a substantial improvement in the spatial, spectral, temporal, and radiometric resolution of operational space-based imagery for atmospheric sciences. The enhanced resolutions enable the objective derivation of fine-scale brightness motion, or so-called "optical flow" (OF), over a variety of meteorological phenomena with techniques that address the weaknesses of current generation cloud and feature tracking algorithms. The techniques even allow for precise dense OF derivation, or motion retrieval at every image pixel, which has a variety of applications that will be invaluable to satellite remote sensing-based forecasting and research in the future. These applications include Atmospheric Motion Vector fields, temporal brightness interpolation, feature extrapolation, image stereoscopy, and semi-Lagrangian brightness temperature field derivation. As motion is an observable that provides unique context on features observed with an image, OF fields further offer significant new predictors to a variety of objective machine learning and decision-making tools now in development. This presentation will go into detail on how some of these new dense OF techniques are derived and highlight efforts to produce and validate new products. Demonstrations of novel RGBs and their uses for operational forecasting will be overviewed, such as blends of derived speed for inferring shear and cloud-top cooling for inferring vertical growth with clouds in visible satellite imagery. Efforts to validate wind products will also be shown which highlight the strengths and weaknesses of dense OF derivation for satellite remote sensing purposes. Examples of future applications and research will also be covered, including a look into the future of OF derivation with an example 6-sec GOES-17 dataset.
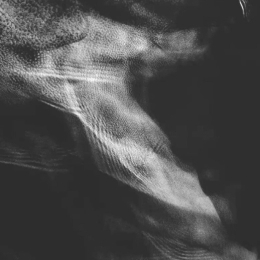
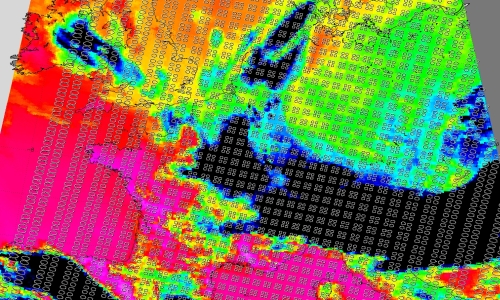
HansPeter Roesli illustrated the impact of wind on clouds by examples taken from satellite imagery.
Vertical and horizontal winds in a moist airmass may generate characteristic cloud patterns. Vice versa specific cloud patterns expose the wind fields behind the scene. The talk illustrates this interplay with imagery from data of operational sun-synchronous and geo-synchronous imaging satellites. It shows cases like gravity waves, undular bores, haboobs, ship tracks or stack plumes.
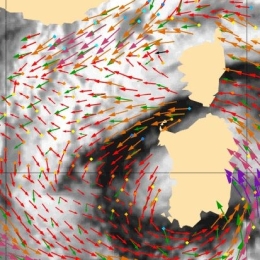
Ad Stöffelen provides an overview on current wind products and services.
Never before so many ocean wind sensing satellites were available for application in meteorology, oceanography and climate. These satellite ocean winds are continually improved in quality and service. An overview will be provided of the current products and services, with particular focus on their earth coverage, timeliness, quality and on coastal and extreme winds. Furthermore, relevant aspects for application in nowcasting, ocean forcing, climate and NWP data assimilation will be highlighted.