
Identify and interpret fields and derived products
Izidor Pelajic gives a presentation on the evaluation of precipitation products from the NWC-SAF.
Length: 30 min
Author: Izidor Pelajić (DHMZ)
Croatian Adriatic coast is one of the rainiest areas in Europe. Large parts of the coast are not covered by the Croatian Radar network. The Croatian Weather Service (DHMZ) uses data from the NWC-SAF precipitation products to complement Radar data. Results from a validation campaign, using Radar and rain gauge data, will be shown in this presentation.
Jean-Marc Moisselin gives a presentation on the RDT product of the NowCasting SAF.
Length: 30 min
Author: Jean-Marc Moisselin (Meteo France)
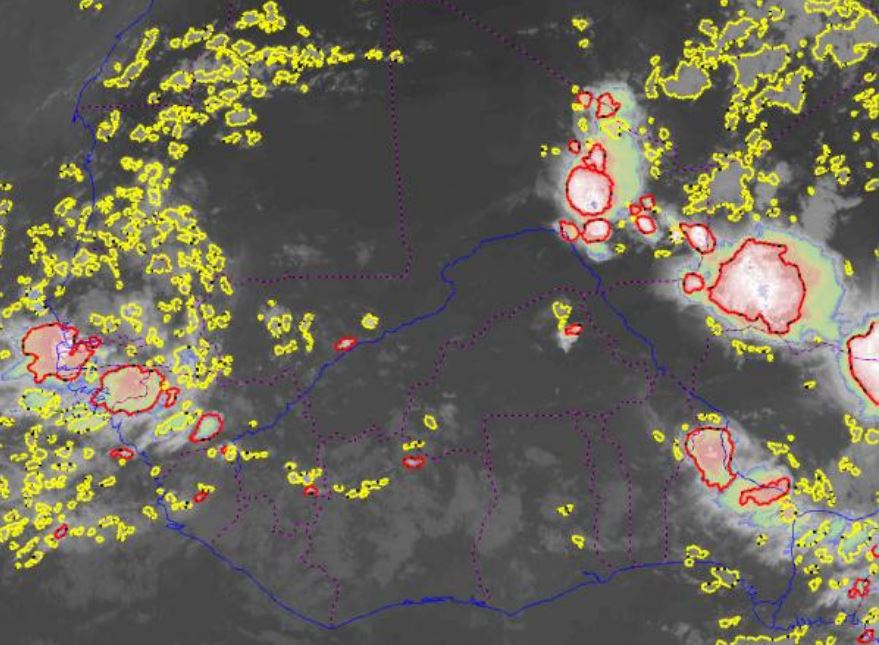
The Rapidly Developing Thunderstorm product provides in object-mode information about significant convective systems. Various attributes describe the convective system: cloud-top temperature and height, overshooting tops, morphological attributes. The product uses the satellite brightness temperature of various channels and optional data like NWP data, lightning data and other NWCSAF products. A nowcast of convective systems is developed for 2016.
A new NWCSAF product (Convection Initiation – the probability of a cloudy pixel to become a thunderstorm) will be developed for 2016.
Cecilia Marcos gives a presentation on the Convective Rainfall Rate product of the NowCasting SAF.
Length: 30 min
Author: Cecilia Marcos (AEMet)
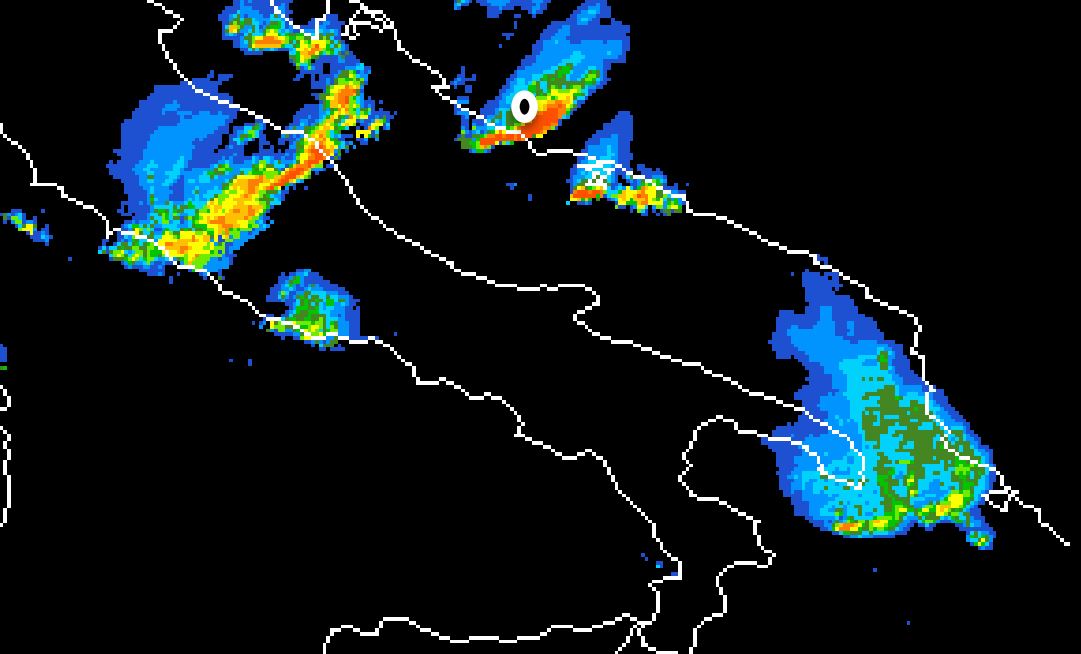
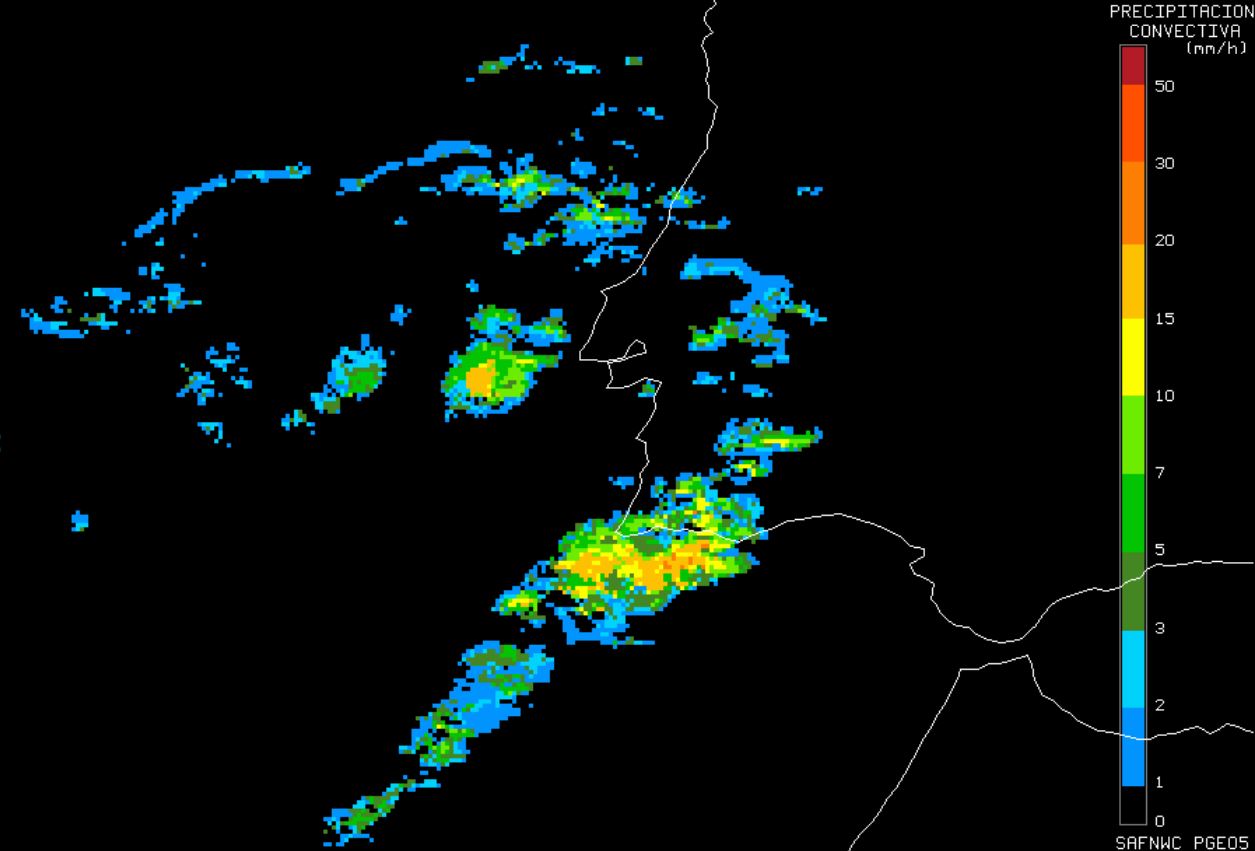
The Convective Rainfall Rate (CRR) product, included in the NWCSAF/MSG software package, estimates rain rates on convective and to convection associated stratiform events. The current version of the package includes estimations of rain intensities through two different approaches. A detailed explanation of them will be presented. Also a comparison, focusing on the weakness and strength of the results provided by both algorithms, will be shown.
Eunha Sohn gives a presentation on NWC-SAF products adapted to the Korean COMS satellite.
Length: 30 min
Author: Eunha Son (KMA)
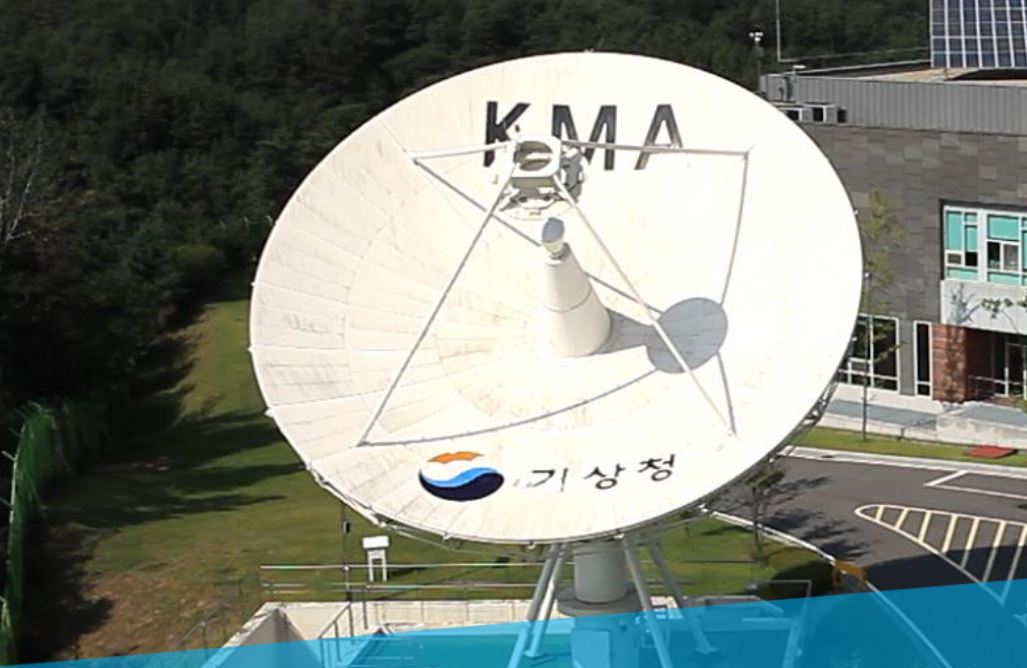
Firstly, the characteristics of synoptic weather which convective cloud occurs over eastern Asian region will be mentioned and the thunderstorm monitoring system with radar data which KMA forecasters use will be also introduced. And then I will present our convective cases and explain them with satellite, radar and other NWP data.
Ralph Petersen discusses a new forecast tool.
Length: 30 min
Author: Ralph Petersen (University of Wisconsin)
Delineating areas where convection is most/least likely to develop can be difficult, especially in the next 3-9 hours. Knowing how forecasts can extend the usefulness of SEVIRI products from observations to forecasts can be equally challenging. This talk discusses a new forecast tool that addresses a number of questions: How can SEVIRI products be used to monitor and predict areas that are becoming more/less supportive for development of convection? Will the details in the SEVIRI observations be retained by short-range forecast tool? How do the derived SEVIRI forecast products relate to standard satellite forecasting conventions? Can IR satellite observations still be useful after convection has begun and clouds have formed? Are the SEVIRI projections useful for monitoring NWP performance?
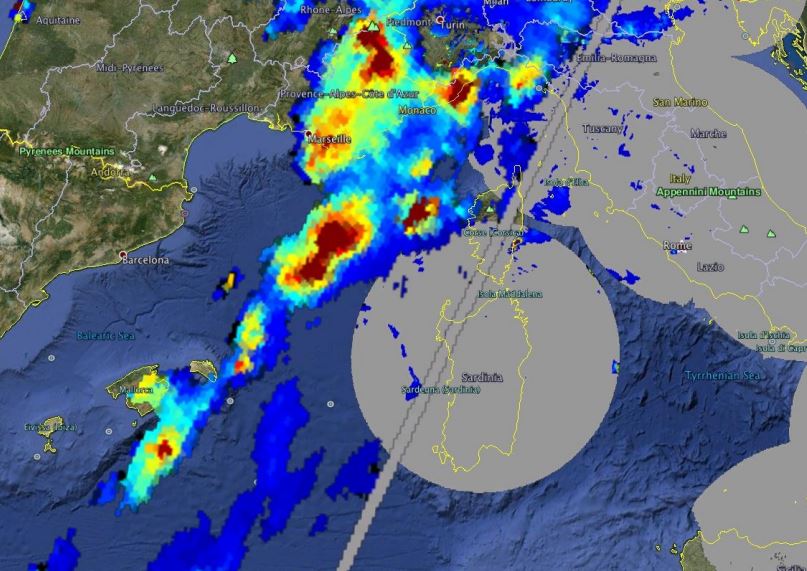
Marie Doutriaux-Boucher presents the Multi-Sensor Precipitation Estimate (MPE) product from EUMETSAT.
Length: 30 min
Author: Marie Doutriaux-Boucher (EUMETSAT)
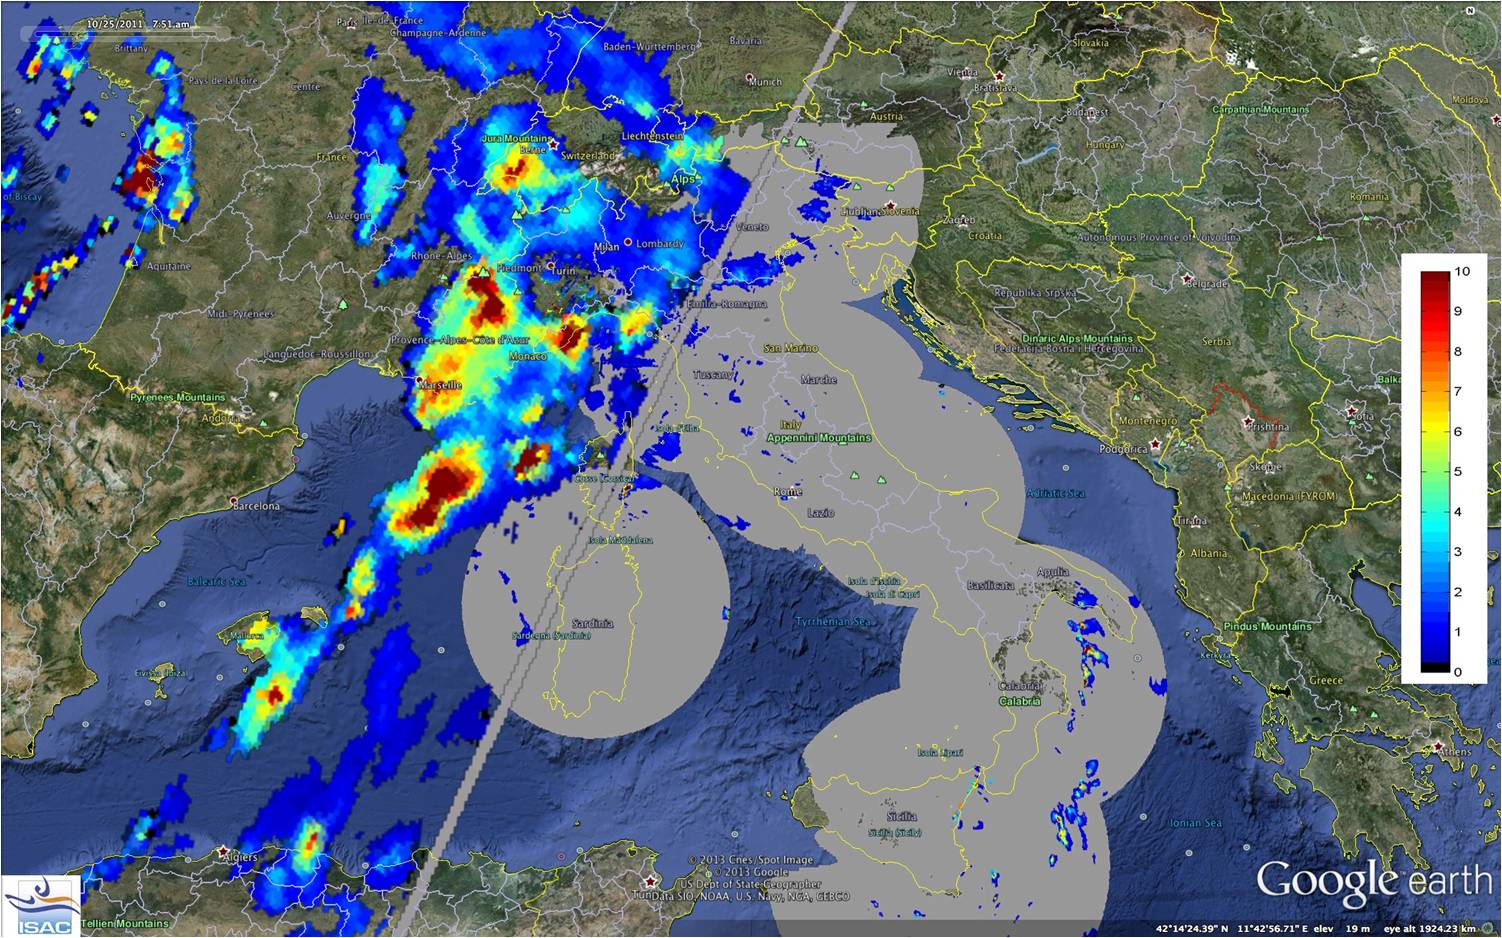
Since 2004, EUMETSAT is deriving the Multi-Sensor Precipitation Estimate (MPE) product operationally. The MPE product retrieval is based on a blending technique that uses microwave information from SSMI-S instrument onboard DMSP-F16 polar satellite and infrared information from the Spinning Enhanced Visible and Infra Red Imager (SEVIRI) instrument onboard MSG geostationary satellites. It consists of a rain rate given every 15 minutes at MSG pixel resolution (3x3km2). Although the retrieval is not a state-of-the-art technique, the product has proven to be quite robust and valuable for deep convective precipitation detection. This presentation will present the MPE product and show some example of potential improvements for future SEVIRI precipitation product.
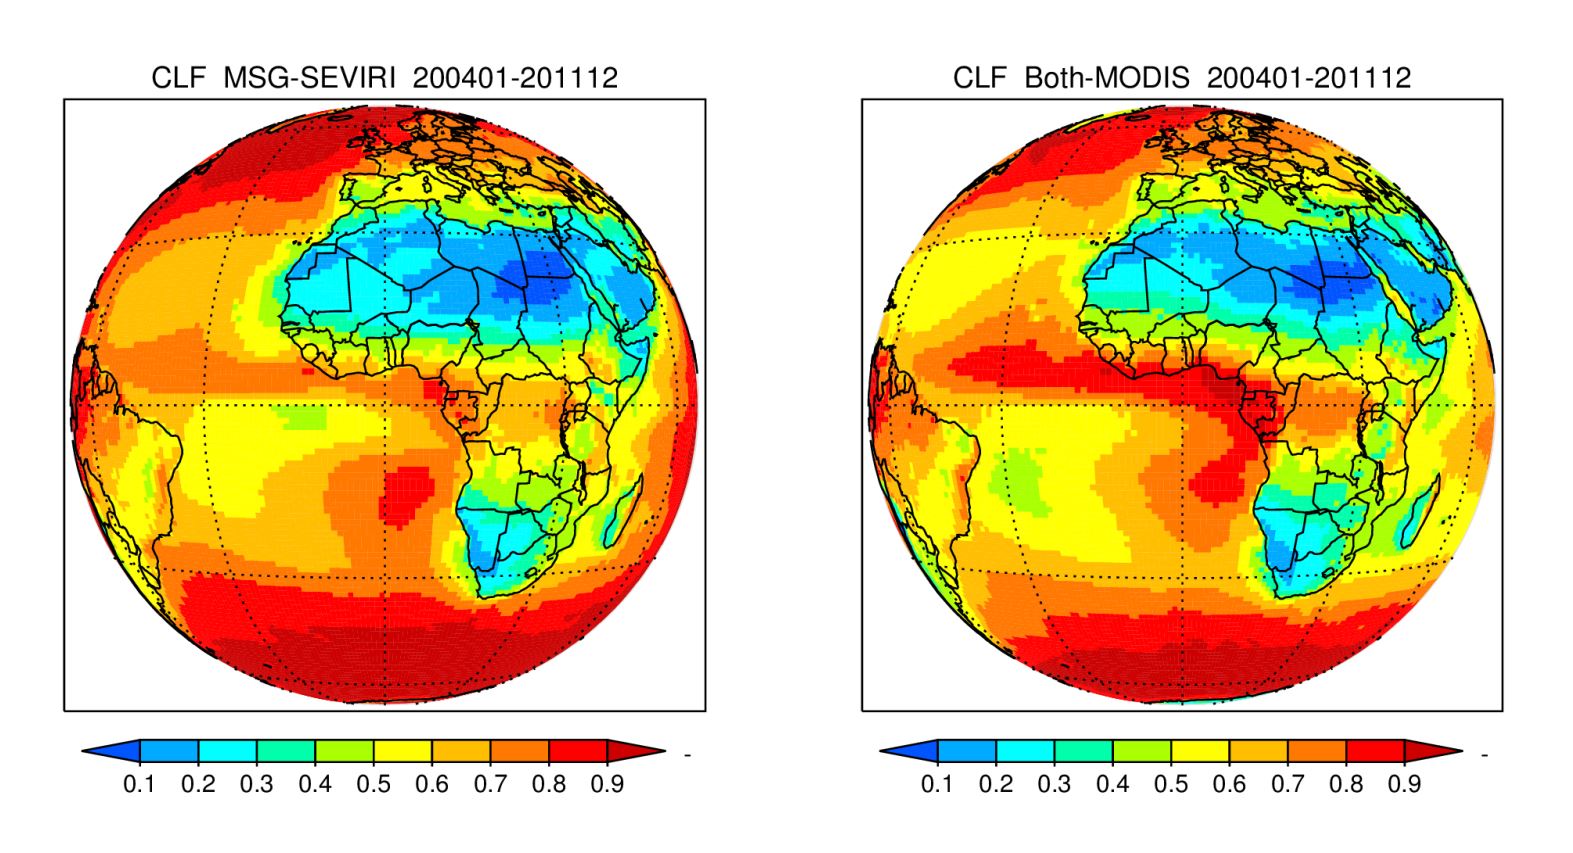
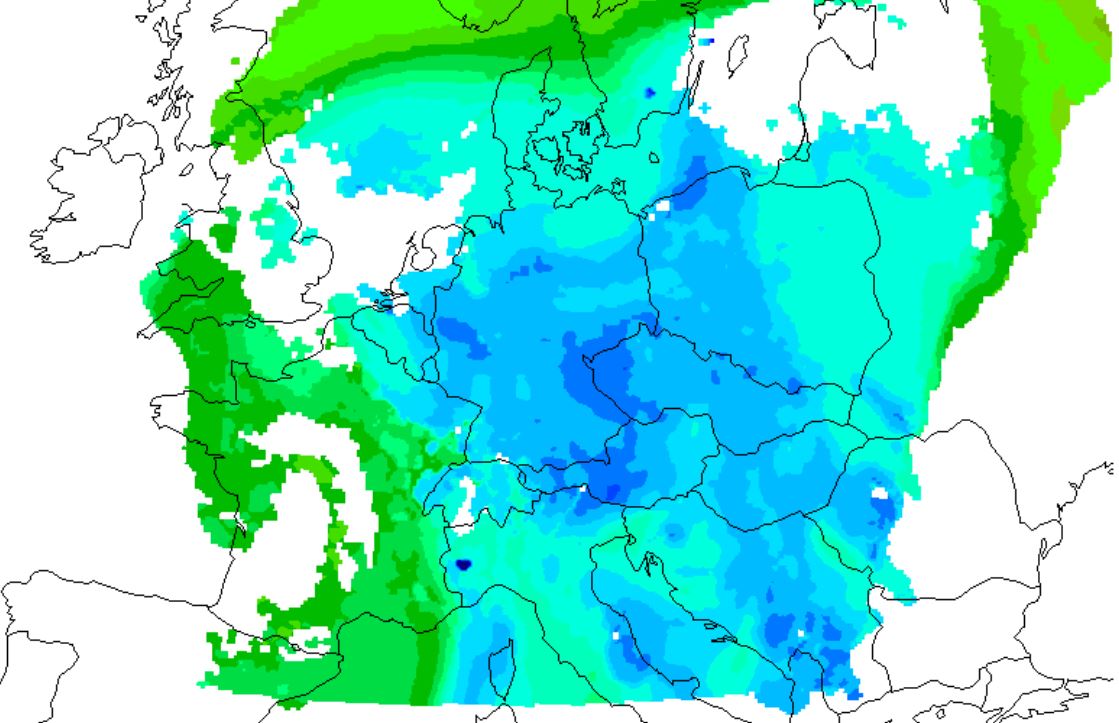
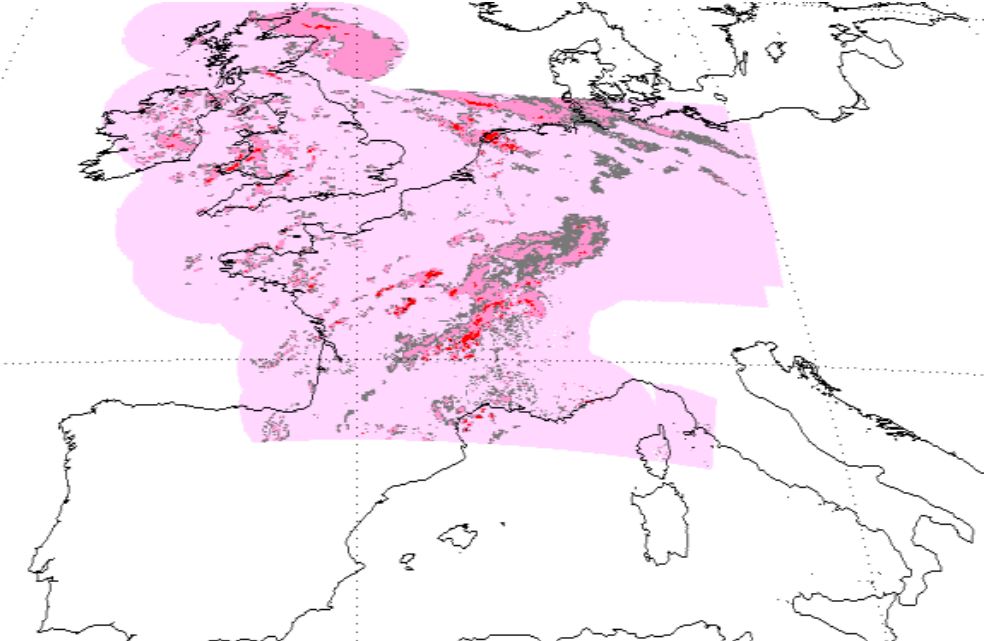
Jan Fokke Meirink speaks about the algorithms developed for the retrieval of daytime cloud physical properties from MSG-SEVIRI.
Length:
Author: Jan Fokke Meirink (KNMI)
Within the CM SAF we have developed an algorithm for the retrieval of daytime cloud physical properties from MSG-SEVIRI. This algorithm and the retrieval products will be described. Furthermore applications will be discussed with a focus on convection.
Matteo Picciani presents the recent upgrades and future developments of the H-SAF products for the monitoring of convective precipitation.
Length: 30 min
Author: Matteo Picchiani (CNMCA)
In the presentation the recent upgrades and future developments of the H-SAF products for the monitoring of convective precipitation will be highlighted. The application of a new version of NEFODINA, a tool developed by CNMCA for the detection of convective systems, will be introduced and different improvements such as the application of a calibration formula and the release of new products versions, developed for monitoring the MSG SEVIRI full disk area, will be shown.
In this module the basics and advantages of Nowcasting are explained.
In this module the basics of Nowcasting in the forecast room are explained. Its practical use in the weather room is explained with a series of examples.
The second part deals with explanation and testing of Nowcasting for various situations such as convective events, frontal situations or Fog. By adding more source-material a student is taught how to improve his Nowcasting skills.
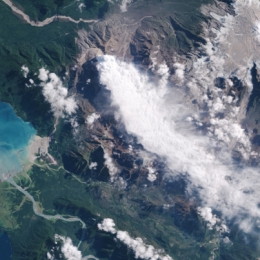
The training module aims at giving an overall view on the use of satellite data, particularly that provided by Meteorological satellites, for monitoring vegetation cover and properties.
The distribution of vegetation, its properties and state, is of major importance for a wide range of applications, namely; environmental management, natural Hazards monitoring, agriculture and forestry, climate change studies and numerical weather forecast models.
Changes in the landcover either caused by changes in land use, climate change or natural hazards (like forest fires or droughts, for instance) may have a huge social and economic impact. An example of this was the severe drought that stroke Eastern Africa in 2009, causing crops to shrink and threatening millions of people with starvation.
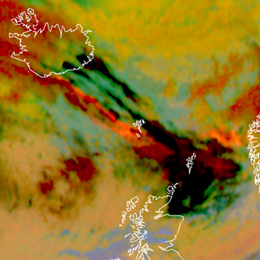
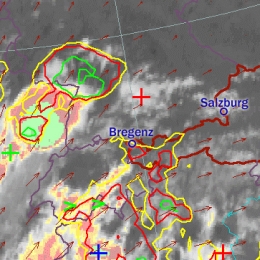
This module provides a guideline on how to assess the threat of volcanic ash. Therefore several tools based on satellite data can be consulted. Prominent examples are the Ash RGB or the use of IASI data.
Extreme weather conditions such the presence of volcanic ash can put aircraft navigation into major difficulties. If an aircraft encounters volcanic ash the navigation gets extremely challenging. Between 1975 and 1994 more than 80 jet airplanes were damaged due to unplanned encounters with clouds of volcanic ash. Seven of these encounters caused in-flight loss of jet engine power, putting the passengers lives at severe risk. Therefore the correct assessment of the weather conditions is essential to ensure save flight conditions. This training module is dedicated to forecasters/aviation forecasters. The main intention is to provide a guideline on how to assess the potential of hazardous weather events such as volcanic ash. For this purpose several tools based on satellite data can be consulted.
Davide Melfi presents the H-SAF precipitation products.
Length: 24 minutes.
The EUMETSAT Satellite Application Facility in Support to Operational Hydrology and Water Management (HSAF) generates and archives high quality products for operational hydrological applications. HSAF focuses on geophysical products of precipitation, soil moisture and snow parameters and the exploitation of these datasets to mitigate hazards and natural disasters such as flash floods, forest fires and landslides, and to monitor drought conditions, improving water resources management.
HSAF promotes the systematic and periodic products review with the continuous refinement of algorithms, validating results during calibration campaign, implementing operational driven procedures and services monitoring accordingly user requirement.
The current status of the Precipitation Cluster and the challenges for the future, looking at MTG and EPS-SG in particular, are presented.