
Identify and interpret atmospheric phenomena
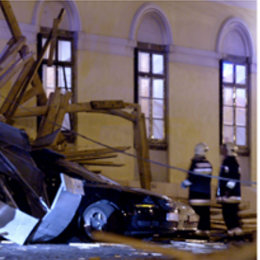
Presentation on some of the typical convective scenarios with the focus on the usage of the background NWP fields and convective parameters in combination with satellite imagery.
Zoltan Polyanszky from the Hungarian Meteorological Institute, presents some of the typical convective scenarios with the focus on the usage of the background NWP fields and convective parameters. The role of the operational work of the forecaster who is responsible for issuing warnings is highlighted and concluding a reflection is discussed on what has been learned from the situations over the recent years.
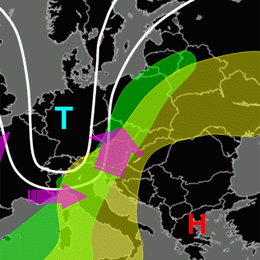
Presentation during the event week on Convection in June 2011 by Helge Tuschy on the European Forecasting Experiment (ESTOFEX).
Presentation by Helge Tuschy from Deutscher Wetterdienst (DWD). He is one of the forecasters producing the valuable ESTOFEX forecasts and this lecture is on the basics of convection and how the convective outlooks in ESTOFEX are prepared.
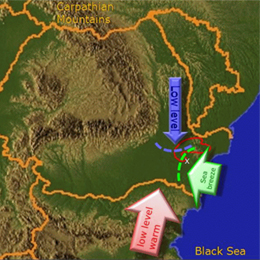
Webcast on the influence of the the Black Sea on the initiation of convective storms in South Eastern Romania.
Presentation by Aurora Bell on the influence of the the Black Sea on the initiation of convective storms in South Eastern Romania. Several cases with Doppler radar and satellite images were presented in combination with other integrated data. The presentation was oriented towards forecasters and Aurora explained the role of the sea breeze in bringing together the right ingredients.
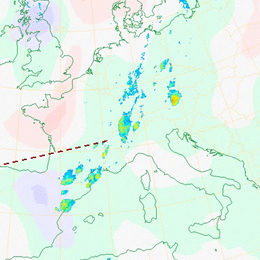
Presentation on the use of the MPEF Divergence Product for diagnosing the divergence associated with upper-level wind field disturbances that produces forcing for ascent and favours the development of deep moist convection.
Presentation by Christo Georgiev during the Event Week on Convection in June 2011. The presentation concentrates on the use of the MPEF Divergence Product for diagnosing the divergence associated with upper-level wind field disturbances that produces forcing for ascent and favours the development of deep moist convection.
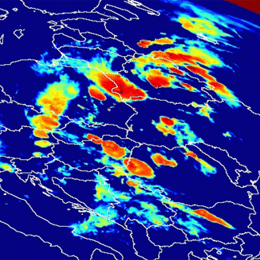
Webcast on the detection and monitoring of convective storms by using MSG imagea and products.
Aydin Erturk (TSMS) present on the "Detection and Monitoring Convective Storms by Using MSG Image and Products". The MSG SEVIRI is crucial data source for the nowcasting applications. Storm top features with IR imagery were well defined and published. MSGView software being operationally used for detection and monitoring convective storms at Turkish State Meteorological Service. Two case studies (a cold U/V and a cold ring shape) were demonstrated and discussed in this presentation.
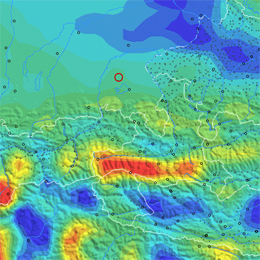
Webcast on the use of IR8.7 for the detection of deep moisture convection.
Presentation given by Thomas Krennert (ZAMG) on the use of the IR8.7 channel for the detection of deep moisture convection (DMC) on marked WV boundaries.
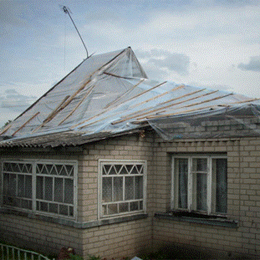
The EUMETCAL High Impact Weather group addressed a series of convective events over Europe during the summer 2010.
The EUMETCAL High Impact Weather group addressed a series of convective events over Europe between 5 and 9 August 2010. This events affected many countries from southern areas - Mediterranean/Balkans - to northern areas - Baltic/Scandinavia. In the 30 minute presentation the group analyzed the events, combining the analysis of convection, namely by satellite, with the impacts perspective.
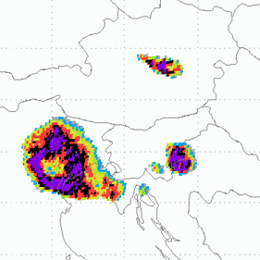
Presentation with results on the occurences of overshooting tops in convective clouds in relation to severe weather.
Presentation given during the Convection Week 2011 by Petra Mikus, a young researcher from the Croatian Meteorological and Hydrological Service DHMZ. The presentation presents results on the occurrences of overshooting tops in convective clouds in relation to severe weather in Austria, Slovenia and Croatia.
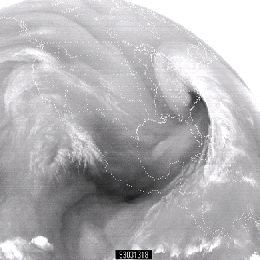
For knowing which processes are present in the atmosphere good interpretation of WV satellite images is needed. For gathering information about water vapor, SEVIRI instrument on board MSG satellite is scanning atmosphere in two channels in water vapor absorption band; 6.2 and 7.3 µm.
WV images are like a footprint of absorption of radiation by a water vapor, which is the main absorber in the atmosphere. Therefore it is clear that understanding of these images can tell us a lot about footprint of atmosphere itself and about processes in it. For knowing which processes are present in the atmosphere good interpretation of WV satellite images is needed.
For gathering information about water vapor, SEVIRI instrument on board MSG satellite is scanning atmosphere in two channels in water vapor absorption band; 6.2 and 7.3 µm. Among these two WV channels, the radiation in channel 6.2 µm is more easily absorbed by water vapor and has a larger information content. Thus is called primary WV channel and is broadly used in image format for weather analysis and forecasting based on synoptic scale interpretation. 7.3 µm channel can also be used in operational forecasting environment for detecting mid-level moisture features associated with low-level thermodynamic conditions. Presenter for this one hour lesson is Christo Georgiev, from Bulgarian National Institute of Meteorology and Hydrology.
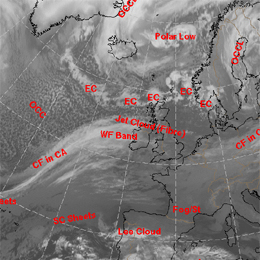
Conceptual models are everywhere around us, even in our heads. Human brain as it is, can store lot of impressions but processing these informations can be a big problem.
Conceptual models are everywhere around us, even in our heads. Human brain as it is, can store lot of impressions but processing these informations can be a big problem. That is why we need conceptual models in everyday communication to know what do others even talking about. All the model data, satellite data, observations, radar data, etc. require good processing of one forecaster so he can cope with all this informations - that is where conceptual model fits in. Very chaotic processes in the atmosphere are today reduced to a smaller number of conceptual models, for the aim of better understanding of whole atmosphere. In this one hour presentation Ab Maas , is introducing manual of conceptual models called Manual of synoptic satellite meteorology (Satmanu). This project started in 1995 and until now there were more than 50 conceptual models described in it, still now maintenance and updating of new models is present. Some of the features and examples of conceptual models are brought in this lecture.
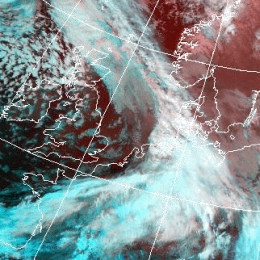
Presentation on the substructures in fronts and initial stages of cyclogenesis.
This one hour presentation on Frontal Structures, brought by Andreas Wirth from ZAMG, is following content of chapter called "Substructures in fronts and initial stages of cyclogenesis", from Satmanu manual. But not all features under this chapter will be discussed. Lecture starts with Front Decay and Front Intensification by Jet Crossing. These are two very similar conceptual models but they show the opposite effect. This is followed by Upper Wave and Wave. Presenter will show these two conceptual models together to see the differences or the common features between them. Finally, presentation finishes with Secondary Low Centres in Occlusion Cloud Bands, which is feature easy to detect and not very complicated conceptual model.
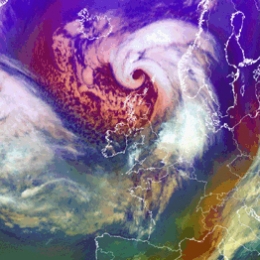
Presentation on Rapid Cyclogenesis and Instant Occlusion.
Two conceptual models from Satmanu manual are introduced by Barbara Zeiner from ZAMG; Rapid Cyclogenesis and Instant Occlusion. These are two kinds of cyclogenesis, but not the classical forms of an occlusion. In normal or classical occlusion there would be a broken wave in a polar front, but in this case we have somewhat different situation. In short, Rapid Cyclogenesis describes a very fast and intensive development of an Occlusion cloud spiral from a low level cloud head. Upper air processes are driving factors in such a development. On the other hand, Front intensification by jet crossing is development of thicker and mostly more convective cloud within a frontal cloud band in the left exit region of a jet streak during frontal crossing. All these processes in this lecture are supported by satellite images and lot of schematics from Satmanu Manual.