
Satellite skills and knowledge for operational meteorologist
Listed here are other resources related to Satellite skills and knowledge for operational meteorologist tag:
Note: click on an image to open the Resource
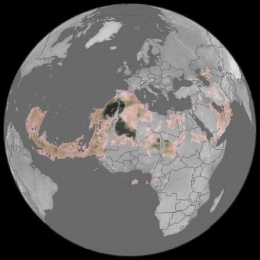
Anu-Maija Sundström gives an overview presentation on AC SAF products and on long-range transport events.
AC SAF provides various satellite observations on atmospheric composition, that are relevant for assessing air quality and climate. In this talk an overview of the AC SAF products is given by introducing practical examples of recent major air quality episodes. The focus will be on long range transport events that are highly affected by prevailing wind conditions.

Valerie-Marie Kumer tals about the challenges of flying in complex terrain.
Flying in complex terrain is challenging as orographic induced turbulence can lead to unexpected loss of aircraft controls. In order to keep aircraft operations as long as possible actable and safe a skilled turbulence forecast is of vital importance. Since turbulence forecasts are highly dependent on model resolution and parameterization schemes, they do not always hit the scores. With the knowledge of general fluid dynamics and observations regions and onset of hazardous conditions can be specified. Let us explore what we can look at to improve our turbulence forecasting skill.
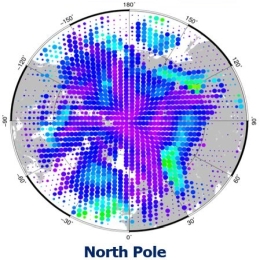
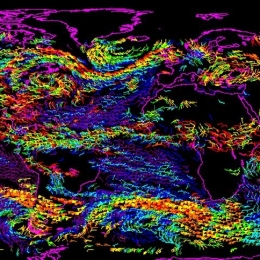
Régis Borde gives an overview on the actual wind products extracted from polar satellites over the world.
Derivation of wind products from polar orbiting satellites has been developed in the 2000’s to populate the high latitude regions where no observation could be obtained from geostationary satellites. Taking advantage of a wider variety of instruments available at Low Earth Orbit, several types of wind information are now produced operationally, and not limited to Polar Regions anymore.
This presentation will give an overview of the actual wind products extracted from polar satellites over the world, and then focus on the EUMETSAT activities which includes the operational production from imagers, the recent development of 3D winds from Hyperspectral instruments, and the preparation of the future Doppler Wind Lidar mission.
Polly Schmederer presents an evaluation of the EXIM product.
With the latest version of EXIM, new NWCSAF products were added to the list of sub-products and a new extrapolation feature, the so-called CTTH filter, was introduced. The CTTH filter allows extrapolating pixels using atmospheric motion vectors (AMVs) stemming from the same userdefined layer. This talk presents the value gained by extrapolating the new sub-products with EXIM and the impact CTTH-filter has on the extrapolation of the various sub-products.
Alexander Jann presents the NWC SAF product EXIM, its functionalities and the algorithm.
Extrapolated Imagery (EXIM) is one of EUMETSAT's NWCSAF/GEO products. EXIM kinematically extrapolates satellite imagery and selected NWCSAF products by up to a lead time of 1 hour.
The software developer gives an overview over EXIM's functionalities, the algorithm, challenges faced, and recent developments introduced in the latest version, which is currently under review for being released.
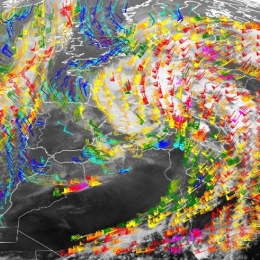
Javier Garcia Pereida presents the NWC SAF product High Resolution Winds and shows application examples.
The NWCSAF/HRW-High Resolution Winds product provides a detailed calculation of Atmospheric Motion Vectors and Trajectories locally and in real time by its users. In this moment, it is able to do this in all regions of the Earth with 5 MSG/Himawari/GOES-R geostationary satellites and 12 NOAA/SNPP/Metop/EOS polar satellites (inside NWC/GEO v2021 and NWC/PPS v2021 software packages).
It is useful in Nowcasting applications, for watch and warning of dangerous wind situations, and monitoring of the general atmospheric flow, small scale circulation and wind singularities. It can also be assimilated in NWP Models and Climate applications, with special interest in its global applicability. In this session, examples will be provided considering all these possibilities.
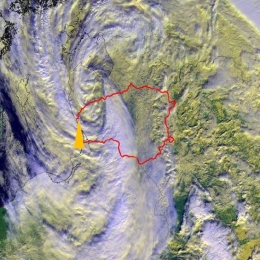
Izolda Marcinoniene gives a talk on the synoptic background for strong winds in Lithuania.
In Lithuania, very strong winds (≥28m/s) are usually caused by Atlantic cyclones. Fifty-five cases in 173 sites have been registered during the period 1961–2021. Even a few cases with very powerful winds (>40 m/s) were observed. According to statistics, most events occur during the cold season and bring significant damage. Thus, a short summary will be presented. Additionally, the typical cyclone track and synoptic situation will be shown in this presentation.
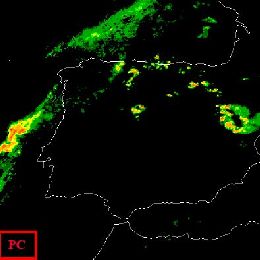
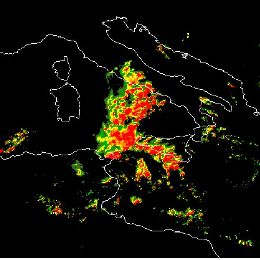
Cecilia Marcos and Natasa Strelec Mahovic give an overview on the NWC-SAF precipitation products and their applications.
To provide the forecasters with tools for severe weather events monitoring with a suitable spatial and temporal resolution is very important. The NWCSAF project develops several products to make easier forecasters their nowcasting tasks.
The NWCSAF/MSG software package contains two products devoted to precipitation. Precipitating Clouds (PC) product assigns a probability of precipitation occurrence on each SEVIRI pixel. Convective Rainfall Rate (CRR) product estimates rain rates on convective, and stratiform associated to convection, events. The algorithms, on which those products are based, have currently two different approaches.
PC product takes advantage of surface temperatures and of those SEVIRI spectral features which have the highest correlation with precipitation, to construct a Precipitation Index (PI). According to this PI, which has been calibrated against rain gauges, a likelihood of precipitation occurrence is assigned to each SEVIRI pixel. CRR algorithm assigns rain rates to each pixel according to some SEVIRI channel information and some calibration functions, which have been calibrated using radar data. The influences of environmental and orographic effects on the precipitation distribution are taken into account through some corrections that use NWP data. Besides, two new products are included in the NWCSAF/MSG v2013 software package. These products also estimate the probability of precipitation and convective rainfall rates using a common approach, which takes advantage of cloud microphysical properties.
In a second talk, Natasa Strelec-Mahovic will present applications of the NWCSAF Precipitation Products.
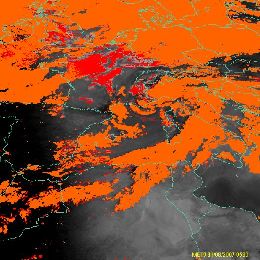
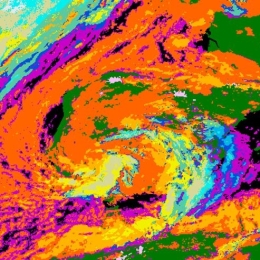
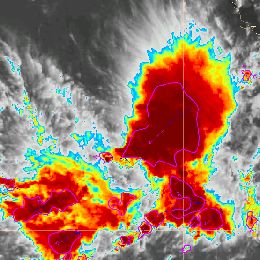
Hervé Le Gléau and Thomas Krennert give an overview on the NWC-SAF cloud products and their applications.
In this 30 minutes presentation, Hervé Le Gléau (MFL) gives an overview of the cloud products that can be retrieved from the MSG/NWCSAF software. These products are the cloud mask (including dust and volcanic ash flag), the cloud type (including the cloud thermodynamical phase), and the cloud top temperature and height. The algorithms will be outlined and some validation results presented. Finally short information will be given on the new cloud microphysics product planned in the NWC/GEO software version 2015.
In a second talk, Thomas Krennert from ZAMG will present case studies using the NWCSAF Cloud Products.
Pilar Fernandez and Ana Sanchez Pique give an overview on the NWC-SAF operational services and products.
In the first presentation, Pilar Fernández gives an introduction to the NWCSAF. The general objective of the NWC SAF is to provide operational services to ensure optimum use of meteorological satellite data in Nowcasting and Very Short Range Forecasting. To achieve this goal, the NWC-SAF is responsible for the development and maintenance of both satellite derived products and of appropriate SW Packages, as well as user support and related tasks. This lecture intends to provide an overview of the NWC SAF project including objectives, consortium composition, phases, organization, services and products.
In the second part, Ana Sánchez Piqué gives a detailed overview of the NWCSAF User Services provided through the Helpdesk tool. The attendants will be shown the different services available for users and also the information available for non-users. Some statistics about the Helpdesk use made by the users (Mail Box, SPR, etc..) will also be shown.
Jean-Marc Moisselin and Frederic Autones give an overview on the NWC-SAF RDT product and its application.
RDT-CW (Rapid Development Thunderstorm Convection Warning) product is an object-oriented diagnostic for convective clouds or cells. RDT-CW is mainly based on satellite data. RDT-CW software tracks clouds, identifies those that are convective (discrimination), and provides some descriptive attributes for their dynamics. Year after year many attributes have been added to the convection object. These improvements offer end-users the possibility to focus on specific parameters according to their center of interest: dynamic of the system (cooling rate, motion vector) lightning activity, rainfall, main cloud phase of the cell, etc. These attributes may come from various sources such as NWP data, other PGEs (Product Generation Element), lightning network. In the v2013 release, an overshooting top detection inside RDT cell is proposed to users. This new attribute allows to focus on potentially hazardous areas.
In the future releases the description of convective cells will be enriched, giving a high priority to the use of other SAFNWC products. A nowcast of RDT up to one hour will be implemented.
Several SAFNWC processing chains are implemented at Meteo-France over various geographical areas: those covered by MSG of course, but also those covered by other geostationary satellites, like overseas territory where Meteo-France centers are still implemented. Forecasters in these centers are the main users to benefit from RDT as an additional product. Productions over Europe and Africa benefit to Aeronautical forecasters from Meteo-France’s National Forecast center, to French Army, and also to ACMAD, Niamey.
A target visualization tool with nowcasting capabilities will be presented, which allows taking advantage from RDT end-product. Presentation of RDT for various situations and over various areas will also be undertaken, and the latest development implemented in v2013 release will be highlighted.
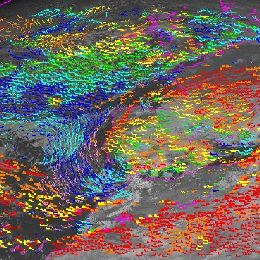
Javier Garcia-Pereda and Mate Mile give an overview on the NWC-SAF high resolution wind product and its application.
The “NWC SAF/HRW High Resolution Winds” provides a detailed calculation of Atmospheric Motion Vectors locally and in near real time. It calculates the AMVs considering cloud and humidity patterns in up to seven different MSG/SEVIRI channels (HRVIS, VIS06, VIS08, WV062, WV073, IR108, IR120), together with NWP data and the “NWC SAF Cloud products (Cloud type, Cloud top temperature and height)”.
It considers up to two tracer scales (Basic and detailed), two tracer determination methods (Gradient and tracer characteristics), two tracking methods (Euclidean distance or cross correlation), and two Height level assignment methods (Brightness temperature interpolation method and Cross correlation contribution method). As other AMV products worldwide it also includes a quality control flagging based on the Quality Indicator Method developed at EUMETSAT.
NWC SAF/HRW product can be useful in Nowcasting applications in synergy with other data available to the forecaster: monitoring of low level convergence, divergence at the top of developed systems, or other cases of small scale circulation or wind singularities. It can also be used as an input in analysis and forecasting applications like NWP models. The development and main characteristics of the product are explained with examples, useful for the potential users to know what the product can offer. The validation results related to the latest version on the product (HRW v4.0) are also explained.
The role of the Atmospheric Motion Vectors (AMV) in the modern data assimilation systems is evident nowadays. The AMVs – along with satellite observations – have an important key for our operational ALADIN data assimilation system as well. In the framework of the EUMETSAT SAF High Resolution Winds (HRW) products had been developed by AEMET for Nowcasting and Very Short Range Forecasting purposes. The HRW products provide quasi real time data of AMVs from MSG HRVIS and IR10.8 channels every hour in a day. A collaboration between AEMET and OMSZ have been focused to compare the benefit of the operationally used AMVs (received through the EumetCAST) with the newly processed HRW winds. Recent work was an extensive evaluation and monitoring of the assimilation and forecast system. The impact of the AMV winds was examined using different diagnostic techniques, verifications tools and case studies. The first results are promising regarding the use of the HRW AMV. The statistical scores on the full domain showed neutral or slightly positive impact in most of the parameters and the experiment based on HRW AMV data provided better estimate of extreme precipitation events.