
Weather
Minna Haikonen explains how FMI collaborates with customers in delivering important warnings.
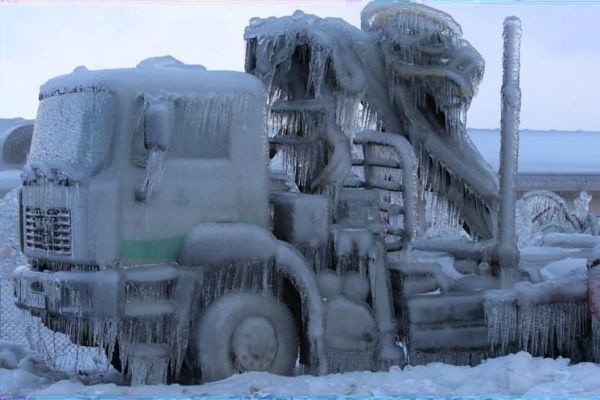
Finnish Meteorological Institute produces weather services for land traffic and shipping to ensure safety and cost effective planning on everyday decision making for customers and stakeholders. FMI produces wide range of weather services including weather and road weather forecasts, observation services and warnings that can be tailored according to customer needs. One example of these a tailored weather services is a so called pre warning service for rail traffic operation and maintenance which is based on meteorological consultation via email or video conference system all around the year. FMI`s meteorologists monitor weather 24/7 basis and issue pre warnings according to the customer needs. There are several parameters that need to be monitored and the pre warning is issued whenever it seems likely that a predefined threshold will be met. During wintertime these pre warnings are proven to be very important especially before heavy snowfall cases not to mention if there is also low temperatures and hard winds appearing at the same time.
Becky Hemingway present ECMWF's Precipitation Type and Extreme Forecast Index products.
ECMWF produces a vast array of global forecast data on a daily basis. In order to make this data useable a large number of products are created and made available to ECMWF Member and Cooperating States and the wider meteorological community via OpenCharts and ecCharts. This presentation will focus on two products which help forecasters in forecasting extreme precipitation, Precipitation Type and the Extreme Forecast Index (EFI). Both products are generally well liked by forecasters and are seen to verify well. The talk will detail how the products are created using the ECMWF Ensemble Forecast System, discuss how to use the products and provide case studies of cold weather events including from the high-latitude regions.
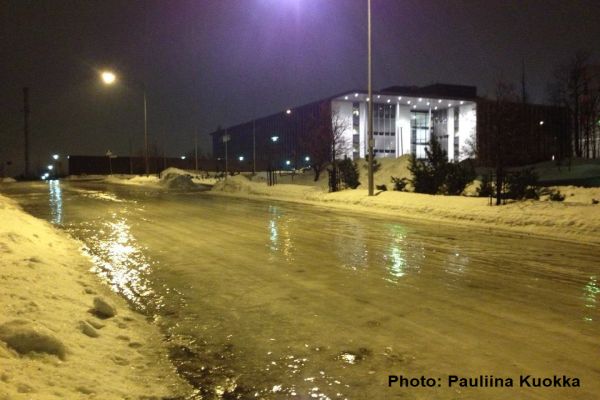
Marjo Hippi explains how FMI deals with slipperiness during winter.
Icy and snowy sidewalks are very typical phenomena in Finland during winter. Near zero temperatures and slipperiness due to ice and snow on sidewalks increases the pedestrians' slip risk. Almost every second person slips annually in Finland and around 50 000 persons (1 % of Finnish population) are injured needing medical attention. Slip injuries cause huge economic losses, long sick leaves, and human suffering. The Finnish Meteorological Institute (FMI) has developed a numerical weather model that predicts the sidewalk slipperiness from pedestrians' point of view. The model classifies the sidewalk slipperiness into three classes: normal, slippery, and very slippery. Very slippery sidewalk condition mean that the slip risk is increased. Typical situations for very difficult sidewalk situations are packed snow, freezing or ice layer covered by water or snow. The model is a tool for duty meteorologists when issuing warning about slippery sidewalk condition.
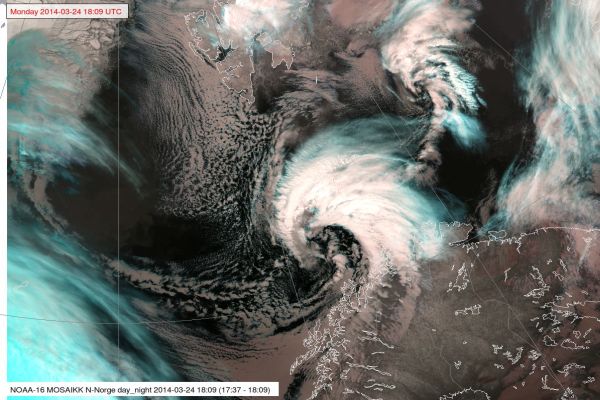
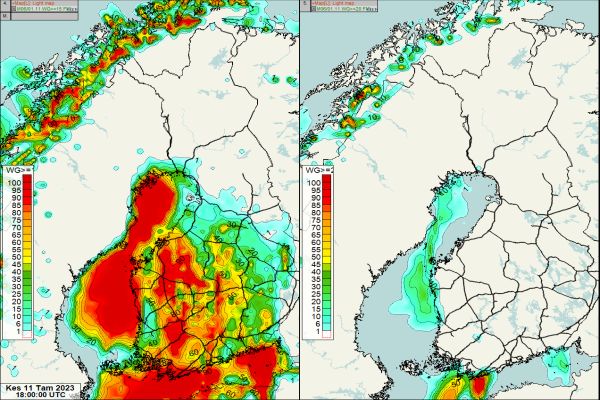
Gunnar Noer explains and showcases the nature of polar lows.
Polar lows are small but fairly intense low pressure systems that form in the Arctic marine regions during the winter season. They form in unstable air masses associated with cold air outbreaks from the Arctic ice cap. Polar Lows give rise to gale or storm force winds which, in combination with heavy snowfall, cause widespread traffic disruptions. In recent years, polar lows have caused several fatal incidents with snow avalanches. This lecture focuses on the key processes and the methodology for forecasting polar lows.
Thomas Krennert (ZAMG) talks about the importance of moisture gradients in analysing the possibility of development of deep moist convection.
The exact predictability of convection in the Alpine region in the absence of fronts in weak-surface-pressure-gradient-situations during the warm season remains challenging for forecasters. The development into single-cell deep moist convection SC-DMC under these conditions depends on the availability of well-known ingredients like low level moisture, steep tropospheric lapse rates and sufficient lift. Satellite studies have shown that favourable locations for the first onset of SC-DMC resulting from widespread shallow convection over mountainous terrain are water vapour gradients in the middle or upper troposphere UTMG (upper tropospheric moisture gradients, Krennert, et al., 2003, https://doi.org/10.1016/S0169-8095(03)00067-X). The contributions of the respective ingredients related to UTMG supporting the initiation of DMC are discussed. A focus is set on moist symmetric instability MSI as a possible mechanism for favouring the transition from shallow to deep moist convection.
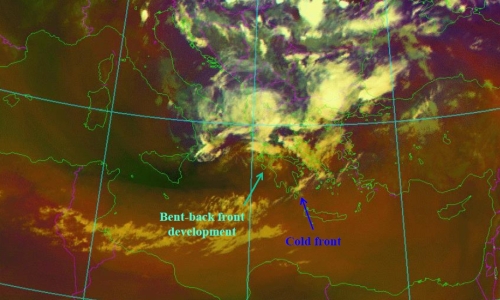
Wilfried Jacobs (DWD) explains the power of Airmass RGB in estimating the possibility of cold front transforming into a convective line.
Especially, the airmass RGB is a powerful tool for estimating the cold front’s tendency to transform to a convective line. Convective lines are connected with strong gusts, heavy precipitation sometimes with graupel or even hail. During this presentation the indications of convective lines will be outlined by considering the airmass RGB together with other means, e.g., radiosounding. Examples of two succeeding days will be discussed in detail whereas the first case did not lead to a convective line whereas the second example did. Typical differences of patterns in the corresponding airmass RGB and additional data sources will be related to a convective line’s probability.
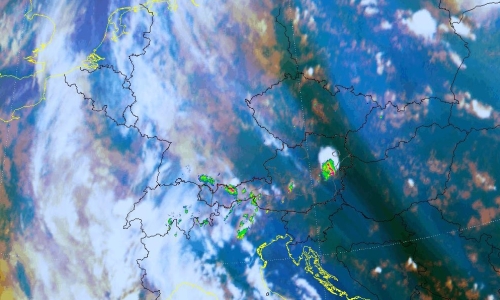
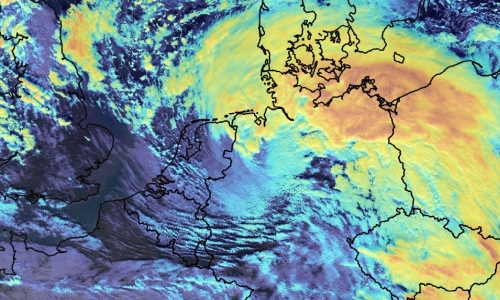
Andreas Wirth (ZAMG) presents the benefits of analysing the water vapour imagery to diagnose synoptic structures and weather patterns.
Water vapor (WV) imagery is very useful when it comes to visualize zonal and meridional transport of air masses, but it is also suited to get a rapid overview on vertical transport processes. This characteristic makes WV-imagery extremely helpful when it comes to diagnose fronts and cyclogenesis.
The presentation will focus on the dynamics of cyclogenesis and fronts and how they are reflected in WV-imagery. The concept of relative streams will be introduced in the context of cyclogenesis, ana- and kata fronts.
Meteorological products based on WV absorption bands such as the Total Precipitable Water product will be introduced and their usefulness will be demonstrated on case examples.
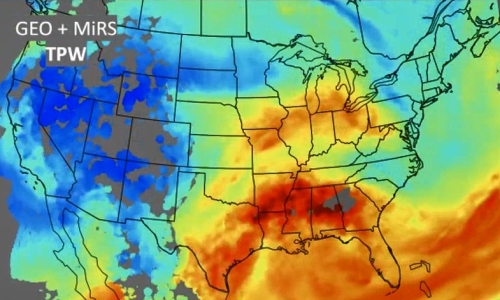
Ralph Petersen (University of Wisconsin) talks about forecasting satellite-derived moisture using all available observation data on moisture and Lagrangian methods to give forecasters more information on the possibility of storm formation.
The CIMSS Lagrangian NearCasts system 1) expands the utility of clear-air sounding and products related to the pre-convective environment (from MTG-IRS Sounder and MTG-Imager) into the 1-9 hours period before storm formation and 2) now combines Geostationary Infrared Products with less frequent microwave products from multiple Polar Orbiting systems to fill information gaps in cloudy areas. For a heavy precipitation event, quantitative measures of both retrieval and short-range forecast accuracy are provided, including a new, non-uniform bias correction approach, and explorations of predictive clear-sky RGBs.
Including “all-weather”, real-time MiRS retrievals not only provide a more visually pleasing product (improving coverage by 30-40%), but also exposes forecasters to here-to-fore underutilized POES observations over land.
Validation against hourly surface-based GPS-TPW observations testify to the ability of the Satellite-based products to capture observed small-scale moisture features properly. Results show error growth rates < 1%/hour (without initial shocks) and support applying non-uniform bias corrections derived over 5mm bands to assure realistic TPW distributions.
Because RGB presentations are more popular than quantitative retrieval product displays the parcel-based Lagrangian NearCast approach was also used to “predict” clear-air RGBs based on the projection of radiance, with quantitative values overlaid. Examples of initial tests will be shown.
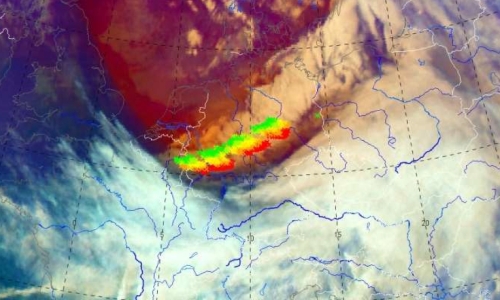
Christo Georgiev (NIMH) presents influence of synoptic and mesoscale dynamical process, through water vapour imagery, on the intensification of wildfires.
Studies of large fires in Australia, Tasmania, USA and Southeastern Europe have shown a link between fire activity and dry stratospheric intrusions with downward transport of energy and momentum down to the lower troposphere. In such cases the rapid increase of fire activity was accompanied by a dry band in satellite Water Vapour (WV) imagery, which is indicative of pronounced descent of upper-tropospheric or stratospheric air which is normally much dryer than the lower tropospheric one and has much higher potential vorticity. When these descending air masses, reach the Earth’s surface they affect the wind speed, moisture and ozone concentration, which could generate a spike in fire activity.
Case-study examples of such severe events over areas of Central and Eastern Mediterranean are considered in the presentation. Combination of WV imagery, satellite soundings and satellite estimations of fire radiative energy contribute to better understanding of dry stratospheric intrusion depth and related dynamical processes, which govern the intensification of wildfire occurrence and spread.
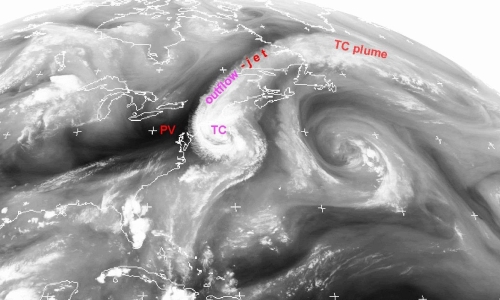
Christo Georgiev (NIMH) discusses the effect of vorticity on tropical cyclones and development of severe thunderstorms, through the scope of water vapour imagery.
Water vapour (WV) images provide useful information to anticipate the effects of upper-level dynamic environment on the intensity of a tropical cyclone (TC) as well as on its extratropical transition (ET), a gradual process in which a TC loses tropical characteristics and becomes more extratropical in nature. Analyses of WV imagery shows that during ET stage over subtropical areas, advection of potential vorticty anomaly can influence the ET and control the process.
Large amounts of water vapour, originated by TCs may be involved in transfer of moisture by planetary waves, associated with ET developments and give rise to a narrow regions of strong meridional water vapour flux. The presentation shows WV imagery synoptic-scale analysis, which shows supply with additional large amount of moisture of an existing already favourable convective environment. The
combination lead into an environment with very high CAPE and potential to accelerate upward, acquiring kinetic energy and forming strong vertical motions in a deep tropospheric layer. The process is illustrated by a case of catastrophic hailstorm over Bulgaria, Eastern Mediterranean.
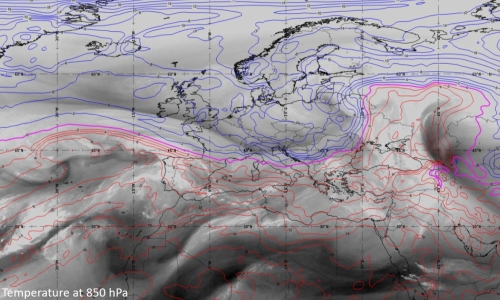
Nataša Strelec-Mahović (EUMETSAT) shows and analyses several cases of water vapour structures in the atmosphere using satellite imagery.
Features occurring in the WV6.2μm images indicate the processes going on in the atmosphere, since these dark (dry) and white (moist) structures result from a combination of vertical motion, moisture advection and horizontal deformation within the mid and upper troposphere. Frequently, water vapour images reveal structures such as dark stripes, mountain wave signatures, or circular or spiral formations known as water vapour eyes, eddies or vortices. We will look at how these features can be used as tracers of three-dimensional atmospheric motions on the meso- and synoptic scale and how they relate to e.g. jet-streams, upper-level lows or turbulence.
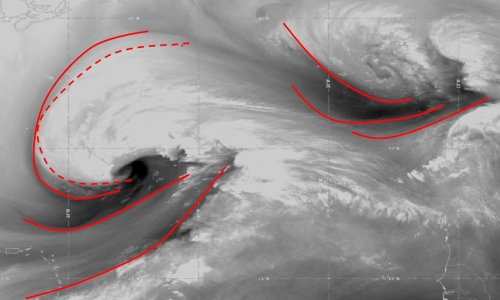
Christian Herold (DWD) investigates the usefulness of IASI L2 products in nowcasting, detecting and analyzing sting jets in rapid cyclogenesis.
Strong winds southwest of the center of a Shapiro-Keyser-Cyclone are often associated with a cold conveyor jet or a sting jet. The sting jet is a strong mesoscale flow with a very high damage potential. It is a massive challenge for NWP and forecasters to correctly predict a sting jet. The question is, can IASI profiles help forecasters for a better prediction of such mesoscale severe wind events connected with sting jets? In this specific context, some case studies will be presented.