
Weather
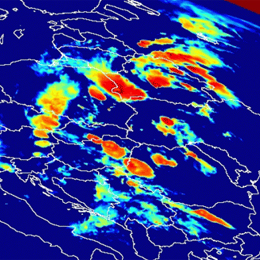
Webcast on the detection and monitoring of convective storms by using MSG imagea and products.
Aydin Erturk (TSMS) present on the "Detection and Monitoring Convective Storms by Using MSG Image and Products". The MSG SEVIRI is crucial data source for the nowcasting applications. Storm top features with IR imagery were well defined and published. MSGView software being operationally used for detection and monitoring convective storms at Turkish State Meteorological Service. Two case studies (a cold U/V and a cold ring shape) were demonstrated and discussed in this presentation.
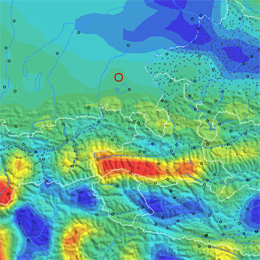
Webcast on the use of IR8.7 for the detection of deep moisture convection.
Presentation given by Thomas Krennert (ZAMG) on the use of the IR8.7 channel for the detection of deep moisture convection (DMC) on marked WV boundaries.
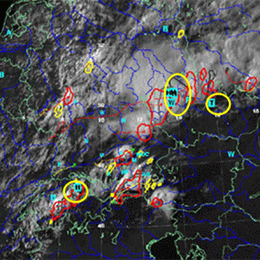
Presentation by Pieter Groenemeijer, director of ESSL, the European Severe Storms Laboratory about the activities.
Presentation by Pieter Groenemeijer, Director of ESSL, the European Severe Storms Laboratory. Pieter explained about the activities of ESSL and what the organization does for the meteorological community, such as supporting research in convective weather, offering a platform to discuss convective weather via the ECSS conferences and the operation of a European Severe Weather Database.
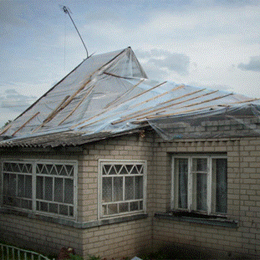
The EUMETCAL High Impact Weather group addressed a series of convective events over Europe during the summer 2010.
The EUMETCAL High Impact Weather group addressed a series of convective events over Europe between 5 and 9 August 2010. This events affected many countries from southern areas - Mediterranean/Balkans - to northern areas - Baltic/Scandinavia. In the 30 minute presentation the group analyzed the events, combining the analysis of convection, namely by satellite, with the impacts perspective.
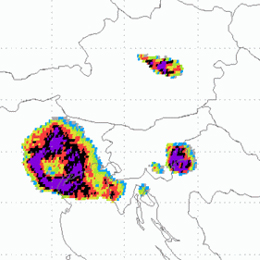
Presentation with results on the occurences of overshooting tops in convective clouds in relation to severe weather.
Presentation given during the Convection Week 2011 by Petra Mikus, a young researcher from the Croatian Meteorological and Hydrological Service DHMZ. The presentation presents results on the occurrences of overshooting tops in convective clouds in relation to severe weather in Austria, Slovenia and Croatia.
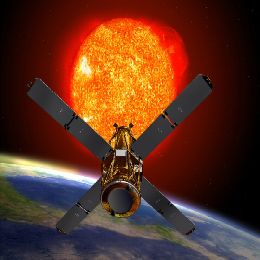
This one hour lecture, held by Jose Prieto, is covering topic of solar satellite channels, mostly from SEVIRI instrument on board MSG.
This one hour lecture, held by Jose Prieto, is covering topic of solar satellite channels, mostly from SEVIRI instrument on board MSG. Of all twelve channels form SEVIRI these are the first four, with central wavelengths of 0.3-1.1; 0.6; 0.8 and 1.6 µm, respectively. First one is a high resolution broad band, second two are narrow band and the fourth one is a microphysics channel. There is significant correlation between channels 0.6 and 0.8 µm, where channel 1.6 µm is somewhat different from them. Also small correlation between solar and other thermal channels is discussed.
Some of the topics that are covered in this lecture are; Solar channels characteristics, Vegetation monitoring, Cloud phase and particle size, Sun glint occurrence and Aerosols. Questions like How to discern clouds from forest, how to find ice on planet Earth, how to avoid squinting on satellite images or escape the smoke of a fire are discussed and answered within all this topics.
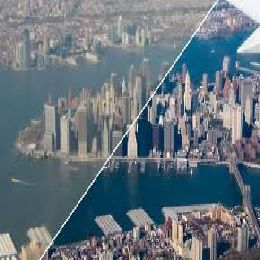
Image enhancement is a process of image modification or improvement of its quality, the aim of which is to achieve a more pleasing appearance of the final image.
This short, but interesting and to all satellite community very useful lecture is brought by Martin Setvak.
Image enhancement is a process of image modification or improvement of its quality, the aim of which is to achieve a more pleasing appearance of the final image. However, in science, the main goal for image enhancement is to increase the interpretability of the image to a human eye and brain, typically focusing on a certain feature carried by the image.
Example of this kind of enhancement you can see in everyday use of digital cameras, which have some kind of built-in image enhancement (software based). So the \'raw\' images captured by the EM sensor can be further improved by simple computer post-processing (in other words - enhancement).
Processes of enhancement can be done with various methods, such as; histogram-based methods, curves adjustment, gamma function adjustment, noise reduction, utilization of advanced filters, etc. Also a few nice examples you can see here and taste the abilities of this kind of image improvement.
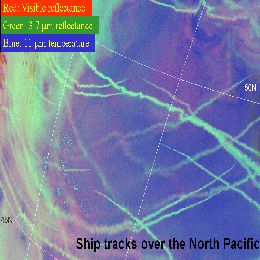
Convective clouds can be characterized by three cloud top properties that can be detected by satellites and represented by respective tree RGB components which are discussed in the presentation.
Convective clouds can be characterized by three cloud top properties that can be detected by satellites and represented by respective tree RGB components;
1. Visible brightness, reflecting more solar radiation for thicker clouds with more water and ice (associated with RED color on RGB composites),
2. Cloud particle size and phase (water or ice), having larger drops with greater depth (associated with GREEN color on RGB composites).
3. Temperature, lover for higher tops (associated with BLUE color in RGB composites).
Microphysical processes within the clouds are specially discussed in this lecture, because they present great importance to the net reflectance of the clouds. Various combinations can be made of all the satellite channels to produce desired RGB combination (e.g. Airmass RGB and Dust RGB product) in order to track properties of interest like formation of fog, drizzle, rain clouds, intensive convective storms, etc. This presentation is given by Daniel Rosenfeld from Hebrew University of Jerusalem, Institute of Earth Sciences.
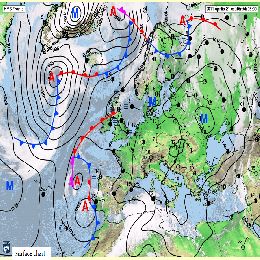
Two software packages for producing products for nowcasting purposes are SAFNWC/MSG (for geostationary satellites) and SAFNWC/PPS (for polar satellites) and the overview of these are given here.
This lesson, given by Maria Putsay from Hungarian Meteorological Service, is about derived products for nowcasting applications. Objectives of the Nowcasting SAF are development of Nowcasting products derived from MSG and Polar satellite systems, delivering of the SW Packages to users and User\'s support task through Help Desk. Two software packages for producing products for nowcasting purposes are SAFNWC/MSG (for geostationary satellites) and SAFNWC/PPS (for polar satellites) and the overview of these are given here. Products may be used in two ways; as an input to a program (e.g. to an objective meso-scale analysis or as intermediate product input to other products) and as an final image product for display at a forecaster\'s desk, or case studied. But the main aim is firs one mentioned. Also in this lecture applications of the NWC SAF products at the Hungarian Meteorological Service are discussed.
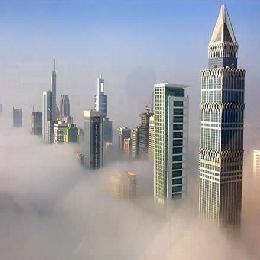
Because we don't know if the cloud observed from satellite is reaching ground or not, it is unrealistic to clam that we can identify fog only using satellite data.
Because we don't know if the cloud observed from satellite is reaching ground or not, it is unrealistic to clam that we can identify fog only using satellite data. Therefore presenter of this lecture is not presenting fog mapping derived only from satellite. Instead he is revealing cloud products extracted from MSG SEVIRI satellite imagery using NWCSAF software, concentrating on the fog or low level clouds category. Lecture is starting with some basic information about SAF nowcasting. After that main features of SAFNWC/MSG cloud algorithms, CM a (cloud mask), CT (cloud type) and CTTH (cloud top temperature and height) are given, step by step with validation results. Also there are examples with fog or low-level clouds situations, including example of automatic use for fog risk mapping.
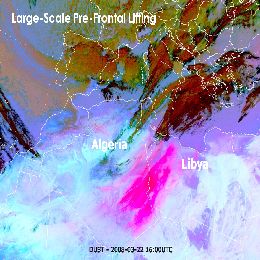
Presentation on how to discriminate levels of dust and what are the global impacts of dust outbreaks.
Dust is a global issue with it\'s good and also less good sides. There are hundreds or even thousands of places on Earth where the dust can be lifted, nevertheless you need to have a dust source to create a dust outbreak. And these are indeed two needed ingredients for lifting dust in the air that must come together; strong surface winds (requires about 15 knots) and dust source (or hotspots). MSG satellite helps a lot to do much better hot spot climatology, and for that, product called Dust Microphisics RGB is widely used. It is derived from three MSG spectral channels. Red color corresponds to difference of channels IR12.0 and IR10.8, green color to the difference of channels IR10.8 and IR8.7 and blue color to the sole IR10.8 channel. In addition to this product Natural Color RGB is also used, but mostly for detection of dust outbreak over the ocean. In this lecture Jochen Kerkmann, from EUMETSAT, will try to describe dust source regions and dust climatology, how to detect better dust on satellite images, how to discriminate levels of dust and what are the global impacts of dust outbreaks. Also he will mention topics like synoptic patterns and diurnal cycles of dust outbrakes, cloud-dust interaction, forecasting of dust movement and will give a list of typical mesoscale phenomena that can cause dust outbreaks.
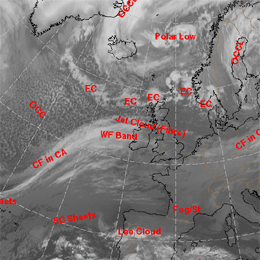
Conceptual models are everywhere around us, even in our heads. Human brain as it is, can store lot of impressions but processing these informations can be a big problem.
Conceptual models are everywhere around us, even in our heads. Human brain as it is, can store lot of impressions but processing these informations can be a big problem. That is why we need conceptual models in everyday communication to know what do others even talking about. All the model data, satellite data, observations, radar data, etc. require good processing of one forecaster so he can cope with all this informations - that is where conceptual model fits in. Very chaotic processes in the atmosphere are today reduced to a smaller number of conceptual models, for the aim of better understanding of whole atmosphere. In this one hour presentation Ab Maas , is introducing manual of conceptual models called Manual of synoptic satellite meteorology (Satmanu). This project started in 1995 and until now there were more than 50 conceptual models described in it, still now maintenance and updating of new models is present. Some of the features and examples of conceptual models are brought in this lecture.