
Weather
Ivan Guettler discusses climate extremes in the context of observed climate change.
Length: 30 minutes
Climate extremes were discussed in the context of the observed climate change and associated trends. The issue of attributing specific weather extreme to climate change was stressed. Several impacts on human activities was presented and estimated economical and human losses due to the weather and climate extremes were compared over different regions.
Overview on the H SAF satellite derived precipitation products.
The EUMETSAT Satellite Application Facility for Operational Hydrology and Water Management (H SAF) provides satellite products and user services in support to Operational Hydrology, Meteorology, Risk Management and Water Management. Since 2005, H SAF science and research bridge into operations through the development and dissemination of soil moisture, precipitation and snow products based on the exploitation of primary EUMETSAT missions. During the fourth Continuous Development and Operations Phase (CDOP-4, from 2022 to 2027), H SAF products will be primarily based on the Meteosat Third Generation (MTG) and the EUMETSAT Polar System -Second Generation (EPS-SG) missions. Current products are based on the use of the full constellation of microwave (MW) radiometers for Level 2 passive microwave (MW) precipitation products and for MW/IR combined products for near-real time applications over the Meteosat Second Generation (MSG) full disk area. The presentation will provide a full overview of the current status and future development of the operational precipitation product portfolio as well as the product quality assessment strategy and results. Examples of applications for specific case studies will be also presented.
Lecture slides (Panegrossi)...
Overview on the H SAF satellite derived soil moisture products.
The EUMETSAT Satellite Application Facility on Support to Operational Hydrology and Water Management (H SAF) develops and provides operational satellite products for precipitation, snow and soil moisture. These satellite products have a wide range of applications, but especially play a key role in numerical weather prediction.
The H SAF soil moisture product suite is composed of surface and root zone soil moisture products available at various spatial resolution, ranging from 1 km to 50 km. Surface Soil Moisture (SSM) products are based on backscatter observations provided by the Advanced Scatterometer (ASCAT) onboard the series of Metop satellites using the EUMETSAT H SAF TU Wien soil moisture retrieval algorithm, whereas Root Zone Soil Moisture (RZSM) products assimilate H SAF SSM products within the ECMWF/H SAF land data assimilation system. At the moment, two ASCAT instruments are currently operational on-board Metop-B and Metop-C.
Introduction of the H SAF project, the history of the SAFs, the introduction of the HSAF Workshop and its agenda from the main organizers.
An introduction of the HSAF project, the history of the SAFs, the introduction of the HSAF Workshop and its agenda from the main organizers.
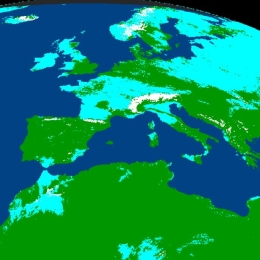
Christine Träger-Chatterjee presents the prototype Data Cube for Drought and Vegetation Monitoring, and tools to manipulate the data in the cube.
EUMETSAT provides a prototype Data Cube for Drought and Vegetation Monitoring, and tools to manipulate the data in the cube. This prototype consists of long-term data records on a regular latitude / longitude grid and in CF-compliant NetCDF via THREDDS.
The prototype seeks to explore how well EUMETSAT and partners can bring together data from multiple sources and from multiple grids to ease barriers to use of the data for thematic applications.
This presentation reports on the lessons learnt as regards the creation, provision and use of the data cube.
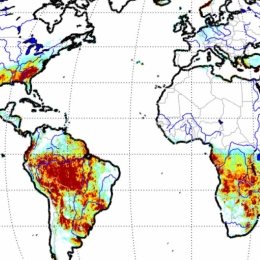
Mariette Vreugdenhil demonstrates the use of the EUMETSAT H SAF soil moisture (H116, SM) and SM2RAIN (H64) products to predict yields for Morocco and Senegal.
We demonstrate the use of the EUMETSAT HSAF soil moisture (H116, SM) and SM2RAIN (H64) products to predict yields for Morocco and Senegal. Root-zone SM was calculated from SM, and NDVI was used as a vegetation indicator. Data on yields was obtained from the Food and Agriculture Organization of the United Nations.
Yield prediction was done for main crops using multiple linear regression and a time for space approach. SM improved yield prediction, especially early in the growing season, improving early warning capabilities. NDVI showed better predictions later in the growing season. SM2RAIN outperformed other benchmark rainfall datasets.
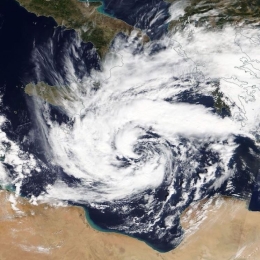
Antonio Parodi presents a critical review of the forecasting performances of each model involved in the CIMA hydrometeorological chain on the example of Medicane Apollo.
During the last week of October 2021 an intense Mediterranean hurricane (medicane), named Apollo, affected many countries on the Mediterranean coasts. The deaths toll peaked up to 7 people, due to flooding from the cyclone in the countries of Tunisia, Algeria, Malta, and Italy.
The Apollo medicane persisted over such areas for about one week (24 October – 1 November 2021) and produced very intense rainfall phenomena and widespread flash flood and flood episodes especially over eastern Sicily on 25-26 October 2021.
CIMA Foundation hydro-meteorological forecasting chain, including the cloud-resolving WRF model assimilating radar data and in situ weather stations (WRF-3DVAR), the fully distributed hydrological model Continuum, the automatic system for water detection (AUTOWADE), and the hydraulic model TELEMAC-2D, has been operated in real-time to predict the weather evolution and the corresponding hydrological and hydraulic impacts of the medicane Apollo, in support of the Italian Civil Protection Department early warning activities and in the framework of the H2020 LEXIS and E-SHAPE projects.
This work critically reviews the forecasting performances of each model involved in the CIMA hydrometeorological chain, with special focus on temporal scales ranging from very short-range (up to 6 hours ahead) to short-range forecasts (up to 48 hours ahead).
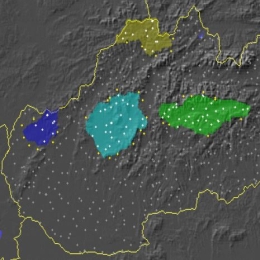
Ján Kanák presents the operational satellite products for precipitation detection, the procedure for their validation and a case study showing the use of these products in evaluating the long-term accumulated precipitation.
Primary satellite data processed into higher-level products are still used less frequently, especially in the context of processing by NWC SAF software, or directly by SAF products received by the EUMETCast Satellite receiving system. Such products include the hydrology support products of the EUMETSAT H SAF (Hydrological Satellite Application Facility). SHMÚ, as a member of the consortium, has long been involved in the task of validation of products for precipitation detection and hydrological applications of these products. In this article we present the operational satellite products for precipitation detection, the procedure for their validation and a case study presenting the use of these products in evaluating the long-term accumulated precipitation. Accumulated precipitation can be used to monitor periods of droughts with precipitation deficits and surpluses. The ambition of this work is to show future users of satellite data that satellite products of a higher level of processing have the potential for climatological studies. A significant increase in this potential is expected in the near future with the launch of the new generation of MTG (third generation Meteosat) and EPS-SG (second generation European Polar System) satellites.
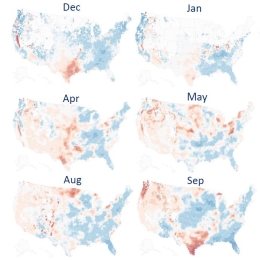
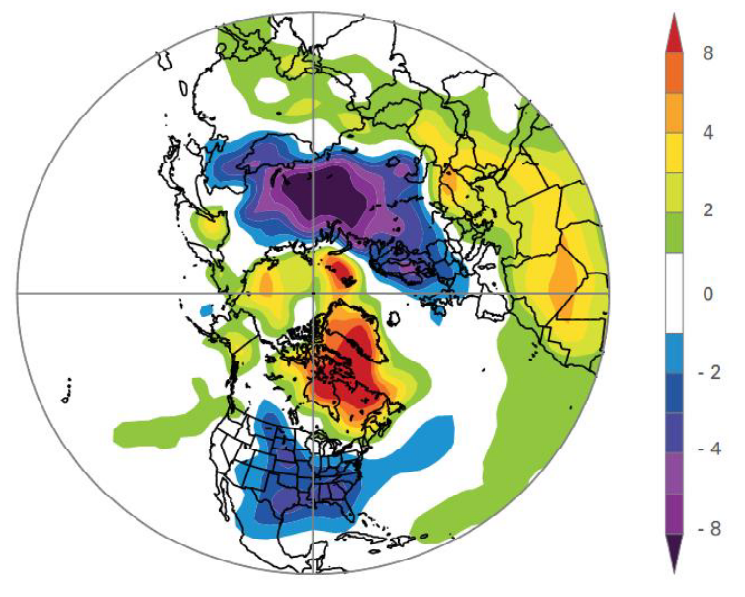
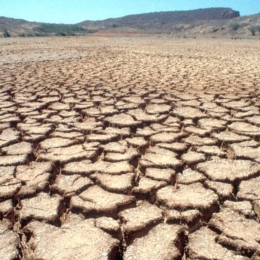
Hamidreza Mosaffa presents a study that aims 1) to develop the long-term climatological SM2RAIN datasets for the period of 1998–2020 by merging two rainfall SM2RAIN products including SM2RAIN-CCI and SM2RAIN-ASCAT, and 2) to the analysis of drought based on standardized precipitation index over the USA.
Investigation of drought variability requires long term rainfall dataset with high spatial and temporal resolution. The goal of this study are as follow: 1) to develop the long-term climatological SM2RAIN datasets for the period of 1998–2020 at 0.25° spatial and monthly temporal resolution by merging two rainfall SM2RAIN products including SM2RAIN-CCI and SM2RAIN-ASCAT, and 2) to the analysis of drought based on standardized precipitation index over the USA. Results indicated that the most significant decreases in the monthly rainfall trends appear in November. In addition, drought occurred during 2003, 2007, and 2012 over most parts of the USA.
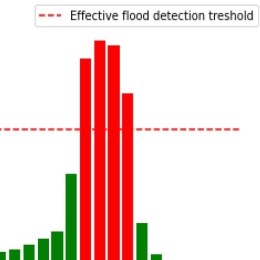
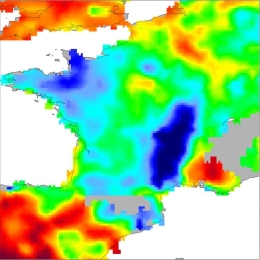
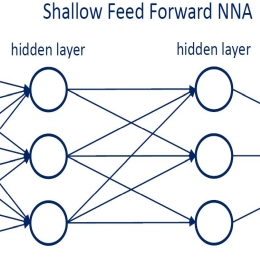
Boris Gratadoux presents an automatic flood forecast tool that combines two kinds of information used as input of a Machine Learning algorithm.
Thales has developed an automatic flood forecast tool combining two kinds of information used as input of a Machine Learning algorithm:
- - Forecasted flows at the outlet of the watershed of interest, obtained with an ensemble data assimilation using a particle filter;
- - Current soil state information from space-based observations;
The prototype allows forecasting time series of flood occurrence associated with a confidence index for a 6-day flood forecast with a 6-hour time-step. It has been tested and validated on a French watershed with good results.
Yves Tramblay presents the results of a study that evaluates satellite rainfall products for hydrological modelling over 12 basins in Morocco using four different hydrological models.
Morocco, as many African countries, has limited observed precipitation data that is a major obstacle for water management, flood monitoring and climate change adaptation planning using hydrological models. The objective of this study is to evaluate satellite rainfall products for hydrological modelling over 12 basins in Morocco using four hydrological models: IHACRES, MISDc, GR4J and CREST. Six satellite products are used in this analysis: the H03, H05, H64 and H67 HSAF products, in addition to SM2RAINASCAT product and GPM IMERG-E. The results showed that the best results to reproduce river runoff are achieved with the SM2RAINASCAT and H64 products, using the CREST and MISDc hydrological models. However, there are strong interplays between the different precipitation products and hydrological model structures in different basins, highlighting the need to carefully select hydrological models according to the intended application. This first evaluation over 12 Moroccan basins suggests that the use of satellite rainfall products for hydrological modelling could a viable alternative to observed rainfall in basins where precipitation is not monitored.
Daniele Casella presents a new algorithm for the Micro-Wave Sounder (MWS) radiometer on board the EPS Second Generation satellites.
The development of precipitation retrieval techniques can now benefit from the availability of unique cloud and precipitation observations by the two space borne radars currently available: the Dualfrequency Precipitation Radar (DPR) on board the NASA/JAXA GPM Core Observatory, and the NASA CloudSat Cloud Profiling Radar (CPR). These two radars have demonstrated their complementarity in the monitoring of precipitation. While DPR has shown a high accuracy in the estimate of medium and intense precipitation regimes, CPR has proven to be very suitable for the retrieval of light rain and snowfall. Within the H SAF a new algorithm for the Micro-Wave Sounder (MWS) radiometer on board the EPS Second Generation satellites (MetOp-SG) has been developed. Different machine learning approaches were tested in order to select the most suitable for optimizing the performance of the algorithm for the detection (a classification problem) and estimate (a regression problem) of rainfall and snowfall.
The details concerning the coincidence datasets creation, the design of the ML modules and the algorithm input selection procedure will be presented, together with results of the algorithm's performance.