
Satellite skills and knowledge for operational meteorologist
Listed here are other resources related to Satellite skills and knowledge for operational meteorologist tag:
Note: click on an image to open the Resource
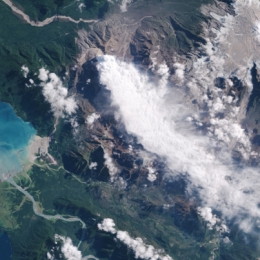
The training module aims at giving an overall view on the use of satellite data, particularly that provided by Meteorological satellites, for monitoring vegetation cover and properties.
The distribution of vegetation, its properties and state, is of major importance for a wide range of applications, namely; environmental management, natural Hazards monitoring, agriculture and forestry, climate change studies and numerical weather forecast models.
Changes in the landcover either caused by changes in land use, climate change or natural hazards (like forest fires or droughts, for instance) may have a huge social and economic impact. An example of this was the severe drought that stroke Eastern Africa in 2009, causing crops to shrink and threatening millions of people with starvation.
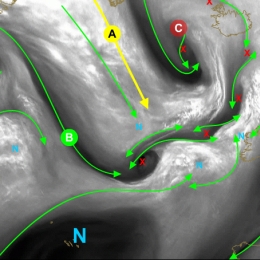
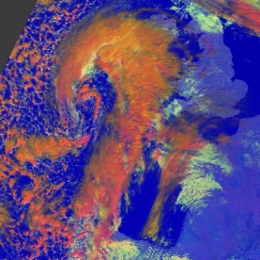
This module takes a closer look at vorticity maxima and minima signatures in satellite imagery.
Vorticity patterns control the circulation of air masses in their vicinity. By doing this they control the location of important meteorological quantities that are essential for an accurate diagnosis and forecast of the atmosphere.
The scale of vorticity patterns in the atmosphere ranges from large-scale synoptic system circulations (low and high pressure centres) to smaller meso-scale circulations (water vapour vortices (sometimes referred as WV eddies or WV eyes). The (anti-)cyclonic rotation in the atmosphere caused by a vorticity maxima is easily seen in satellite imagery. And quite naturally, satellite imagery is the key tool to correctly locate the maximum of cyclonic and anticyclonic vorticity in the atmosphere. Moreover, satellite images are able to show the small-scale vorticity patterns that are easily overlooked and smoothed out by a NWP model.
This training module has been developed to teach you to identify these vorticity centres in Meteosat Second Generation (MSG) satellite imagery. In addition the module will provide you with a firm physical background to help you understand why it is important to do a good diagnosis of satellite images and also provide you with a range of examples and exercises to demonstrate the impact a vorticity centre may have on your weather forecast.

An intensive training module on the operational use of RGBs in the forecasting room.
Technological advances and the increasing sophistication of weather forecasting have created a demand for more frequent and more accurate and higher resolution observations from space. To meet this demand on 28th August 2002 the first of four satellites known as Meteosat Second Generation (MSG) was launched.
MSG transmits more than 20 times the information of its predecessor. The improved resolution of frequency of data significantly contributes to the accuracy of both short-term and medium range weather forecasts. Since 2004, the MSG satellites have been providing full Earth disc images every 15 minutes, in 12 spectral bands.
Twenty times more information is also a challenge for the user to cope with. To present all of this extra data in a understandable way to the user, so-called RGB (red, green and blue) images were developed that allow you to easily make a qualitative analysis. In RGB images the different properties of the twelve spectral bands of MSG are combined in one powerful coloured image.
Fog, snow, atmospheric dust, SO2 clouds from erupting volcanoes, severe updrafts in convective systems, Potential Vorticity (PV) anomalies are just a few keywords and applications that we will teach you to recognise in satellite imagery. On several occasions questions and exercises will help you to test your gained knowledge.
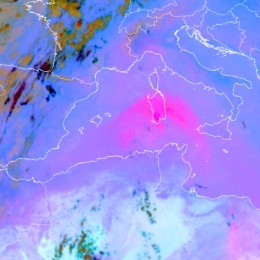
Training module on the detection of dust storms over Europe with various RGB images and products.
Atmospheric dust storms are common in many of the world's semi-arid and arid regions and can impact local, regional, and even global weather, agriculture, public health, transportation, industry, and ocean health. This globally-relevant three-hour module takes a multifaceted approach to studying atmospheric dust storms. The first chapter examines the impacts of dust storms, the physical processes involved in their life cycle, their source regions, and their climatology. The second chapter explores satellite products (notably dust RGBs) and dust models that are used for dust detection and monitoring. It also presents a process for forecasting dust storms. The third and final chapter of the module examines the major types of dust storms: those that are synoptically forced, such as pre- and post-frontal dust storms and those induced by large-scale trade winds; and those caused by mesoscale systems, such as downslope winds, gap flow, convection, and inversion downburst storms.
This training module was produced by COMET with the sponsorship and contribution of EUMETSAT and EUMeTrain.
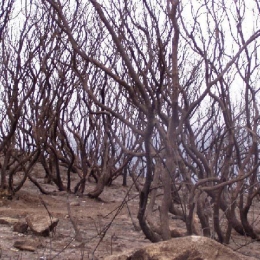
Every summer forest fires make it to the headlines. This training module will explain all the meteorlogical aspects associated to forest fires give you a wide range of products.
The past decade forest fires have received much media attention due to the impact it has in environmental terms. This CAL is mainly for forecasters that deal with forest fires. However, the module may be used by others dealing with forest fires like, civil protection agents, fireman or forecasters.
In this CAL module you will learn to detect areas with the risk for Clear Air Turbulence (CAT). This will be done with the help of satellite images, soundings, flight reports and analyses of the airflow.
Clear Air Turbulence is one of the most frequent hazards for civil aviation. It is also one of the biggest challenges for forecasters to detect and warn for possible Clear Air Turbulence occurrence.
In this CAL module you will learn to detect areas with a high risk for Clear Air Turbulence (CAT). This will be done with the help of satellite images, soundings, flight reports and analyses of the airflow. Practical examples will show you how to apply your knowledge.
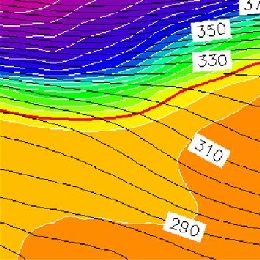
This CAL module deals with applications of MSG water vapour images in operational forecast departments. It focusses on the analysis of WV imagery in view of turbulence, cyclogenesis, convection and deformation zones.
This training module gives an overview on applications of MSG water vapour channels for operational weather forecasting. It handles the concept of potential vorticity which is a key feature to understand the dynamic processes in the higher Troposphere such as cyclogenesis. The CAL module also shows practical applications of the WV images from the geostationary satellites for locating tropopause foldings, clear air turbulence and deformation zones. It handles the effects of WV boundaries on the initiation of convective processes and finally presents some meteorological products heavily based on WV imagery.
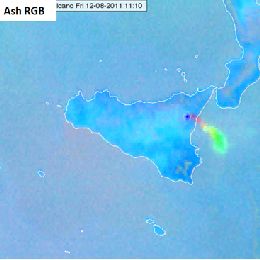
An intensive training module on the operational use of RGBs in the forecasting room.
The new generation satellite data contains more and more information offering increased insight into cloud and air mass characteristics. This poses a challenge: figuring out how to extract, distill and package the data into products that are easy for forecasters to interpret and use.
One might create numerous different kinds of RGB images. Satellite experts developed some optimally tuned RGB types for highlighting specific features. These are the so called standard RGBs recommended by EUMETSAT. The advantage of using standard RGBs is their easy comparability.
The aim of creating RGBs is to provide fast, easily understandable VISUAL information. A 'good' RGB should convey information that would be difficult or time consuming to assess visually from one or more individual single channel images. RGB image should be unambiguous and use intuitive colours to help highlighting important meteorological and surface features. RGBs provide useful information to forecasters, in particular when looking at animated image sequences. They preserve the "natural" look-and-feel of "traditional" satellite images, e.g. they preserve texture, and the patterns are continuous in time.
In this module you will learn more about the EUMETSAT standard RGBs: HRV Fog RGB, Snow RGB, Night Microphysics RGB and the Ash RGB.
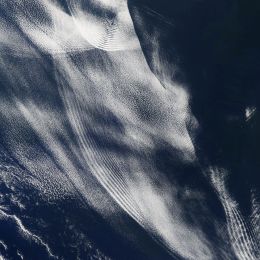
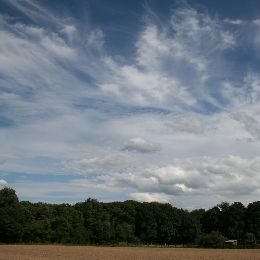
This module treats all kinds of atmospheric gravity waves over land and over the oceans.
This module treats all kinds of atmospheric wave phenomena, starting with Lee Waves and ending with Vortex Streets. The physical background of Gravity Waves in general and Lee Waves in special will be highlighted and special cases, such as Foehn clouds, treated in more details. Gravity waves over the oceans build another focal point of this module. At the end of each chapter, exercises will help you to check the acquired knowledge.
The purpose of this training module is to give an overview on the different RGB types created from the AVHRR instrument.
This training module describes MetOp AVHRR (Advanced Very High Resolution Radiometer) RGB schemes that are based on EUMETSAT recommendations. The 'recipes' were tuned to create high quality MetOp/AVHRR RGB images as similar as possible to the SEVIRI RGB schemes recommended by EUMETSAT.
The main aim of the training module is to help the users (weather forecasters and/or other experts) understand and use these RGB types by giving them background information, examples and exercises.
The module takes the following structure:
- The aim of the RGB type
- Physical background
- How to create the given RGB type
- Typical colors
- Examples of interpretation
- Benefits and limitations
- Comparisons with other RGB types and/or single channel images
- Exercise
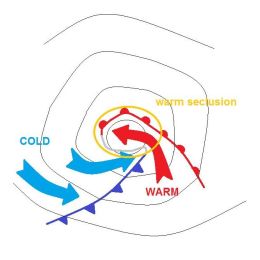
In this Training Module, the two major mid-latitude cyclone models, the Norwegian cyclone model and the Shapiro-Keyser cyclone model will be explained in detail.
In this module, the two major mid-latitude cyclone models, the Norwegian cyclone model and the Shapiro-Keyser cyclone model, will be explained in detail. The intention of the module is to point out the main differences in the life cycles of cyclones of the Norwegian type and the Shapiro-Keyser (S-K) type. Special focus will be placed on the synoptic preconditions that lead to the formation of cyclones.
Finally, sting jets, which often appear in the context of Shapiro-Keyser cyclones, will be briefly introduced.
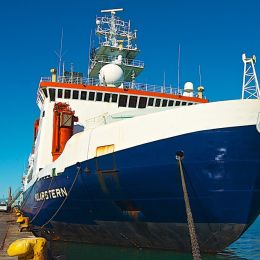
In this Training Module you can follow the voyage of the research vessel Polarstern across the Atlantic and observe various atmospheric phenomena.
Follow the voyages of the research vessel Polarstern through different climate zones and weather situations in three oceans - Arctic, Atlantic and Antarctic. Learn more about fog, winds and convection, the globel circulation and climate zones. See how satellite images help you observe the atmospheric phenomena.