
Marine forecasting
Listed here are other resources related to Marine forecasting tag:
Note: click on an image to open the Resource
Christine Träger-Chatterjee presents the prototype Data Cube for Drought and Vegetation Monitoring, and tools to manipulate the data in the cube.
EUMETSAT provides a prototype Data Cube for Drought and Vegetation Monitoring, and tools to manipulate the data in the cube. This prototype consists of long-term data records on a regular latitude / longitude grid and in CF-compliant NetCDF via THREDDS.
The prototype seeks to explore how well EUMETSAT and partners can bring together data from multiple sources and from multiple grids to ease barriers to use of the data for thematic applications.
This presentation reports on the lessons learnt as regards the creation, provision and use of the data cube.
Jose Candido from WavEC talks in his presentation about the use of satellite derived altimetry data for wave energy applications.
Altimeter estimates of the significant wave height Hs are quite accurate. The assessment of the wave energy resource in deep water locations requires not only the knowledge of Hs but also of the wave period, in particular the energy period Te. Several models have been proposed in order to derive the mean zero-crossing period from the altimeter backscatter coefficient with reasonable accuracy. The attempts to establish a relation between Tz and Te revealed significant constraints. As a consequence, the exclusive use of altimeter data may be suitable only for preliminary wave energy resource assessment purposes. Additionally, given their wide geographic availability, altimeter Hs estimates are typically applied in the validation of wave model data used in wave energy resource assessment studies.
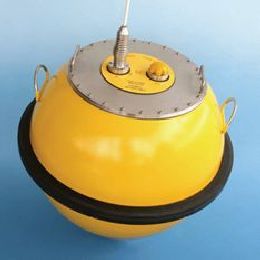
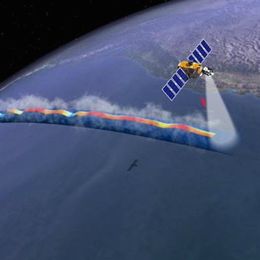
Sergio Muacho from IPMA gives a presentation on Jason-2 altimetry data. He explains the measuring principle and applies the data to track an Atlantic wave storm.
This presentation reports on the use of significant wave height (SWH) altimetry product, derived from OSTM/Jason-2 data, during a recent wave storm in the Northeast region of the Atlantic Ocean at mid-April 2012. Altimetric measurements provide data for wave model assimilation and also support ocean forecasts. Sérgio Muacho will focus on remote-sensed observations that cover a period of one week, and track the wave storm over the Atlantic between south of Iceland and the Portuguese Continental West coast, and the Gulf of Biscay. This study provides a summary of this wave storm and highlights the importance of having altimetry data in ocean areas, where there is a lack of observations, especially in off-shore regions.
Nuno Moreira from IPMA guides you through the web sites mentioned in the presentations during the Polar Satellites Week.
In this session you will be taken on a website tour, visiting pages where polar satellite products referred during the whole EUMETRAIN Polar Satellite Week can be visualized. “Web-Visits” will naturally include EUMETSAT or NOAA pages and it will be an opportunity to make a wrap-up on the contents previously discussed...
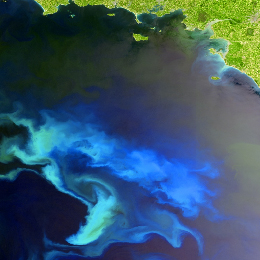
Webcast on the study of ocean color which helps scientists to gain a better understanding of phytoplankton and their impact on the Earth system.
Webcast on the study of ocean color which helps scientists to gain a better understanding of phytoplankton and their impact on the Earth system.
These small organisms can affect a system on a very large scale such as climate change. Phytoplankton use carbon dioxide for photosynthesis and in turn provide almost half the oxygen we breathe. The larger the world\'s phytoplankton population, the more carbon dioxide gets pulled from the atmosphere, hence, the lower the average temperature due to lower volumes of this greenhouse gas. Scientists have found that a given population of phytoplankton can double its numbers about once per day. In other words, phytoplankton respond very rapidly to changes in their environment. Large populations of these organisms, sustained over long periods of time, could significantly lower atmospheric carbon dioxide levels and, in turn, lower average temperatures. Carbon can be "stored" in oceanic sediments when organic matter sinks and is buried in the ocean floor.
Understanding and monitoring phytoplankton can help scientists study and predict environmental change. Since phytoplankton depend upon sunlight, water, and nutrients to survive, physical or chemical variance in any of these ingredients over time for a given region will affect the phytoplankton concentrations. Phytoplankton populations grow or diminish rapidly in response to changes in its environment. Changes in the trends for a given phytoplankton population, such as its density, distribution, and rate of population growth or diminishment, will alert Earth scientists that environmental conditions are changing there. Then, by comparing these phytoplankton trends to other measurements - such as temperature - scientists can learn more about how phytoplankton may be contributing to, and affected by, climatic and environmental change.
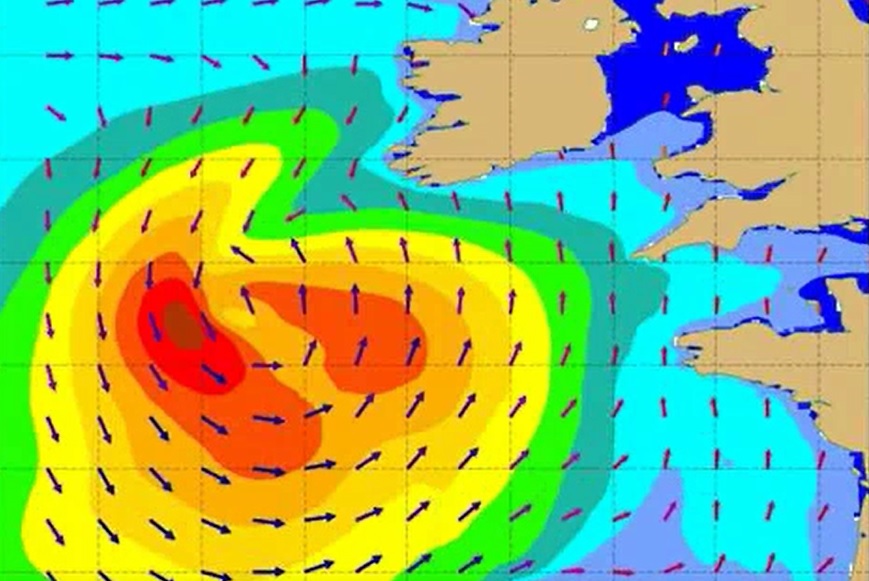
This case study demonstrates the usability of wave height altimetry data from Jason-2.
This case study treats a storm over the Atlantic which started its development on 14 April 2012 and lasted until 17 April. The deepening depression and associated strong surface winds gave birth to high waves and sea swell affecting the northern Spanish coasts. The case study focuses on sea level altimetry data provided by Jason-2. A comparison with ECMWF wave model (WAM) is undertaken.
The aim of the case study is to show the quality of Jason-2 data in comparison with model data and in situ measurements.
The purpose of this tutorial is to give an introduction into the topic wind measurement from satellite.
Knowledge of atmospheric motion is essential for many applications. Information on high-level atmospheric winds is of great importance for forecast models as the current state of the atmosphere has to be specified before the future state can be predicted. Winds in the upper levels can be observed using radiosondes or aircraft measurements, but those observations are limited in time and space. As satellites provide worldwide and continuous data, they are the ideal data source for regular upper atmospheric wind information.
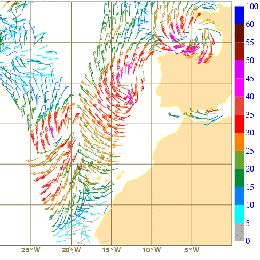
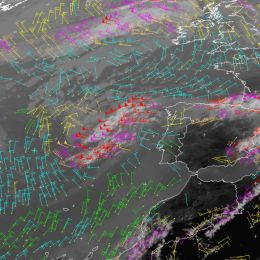
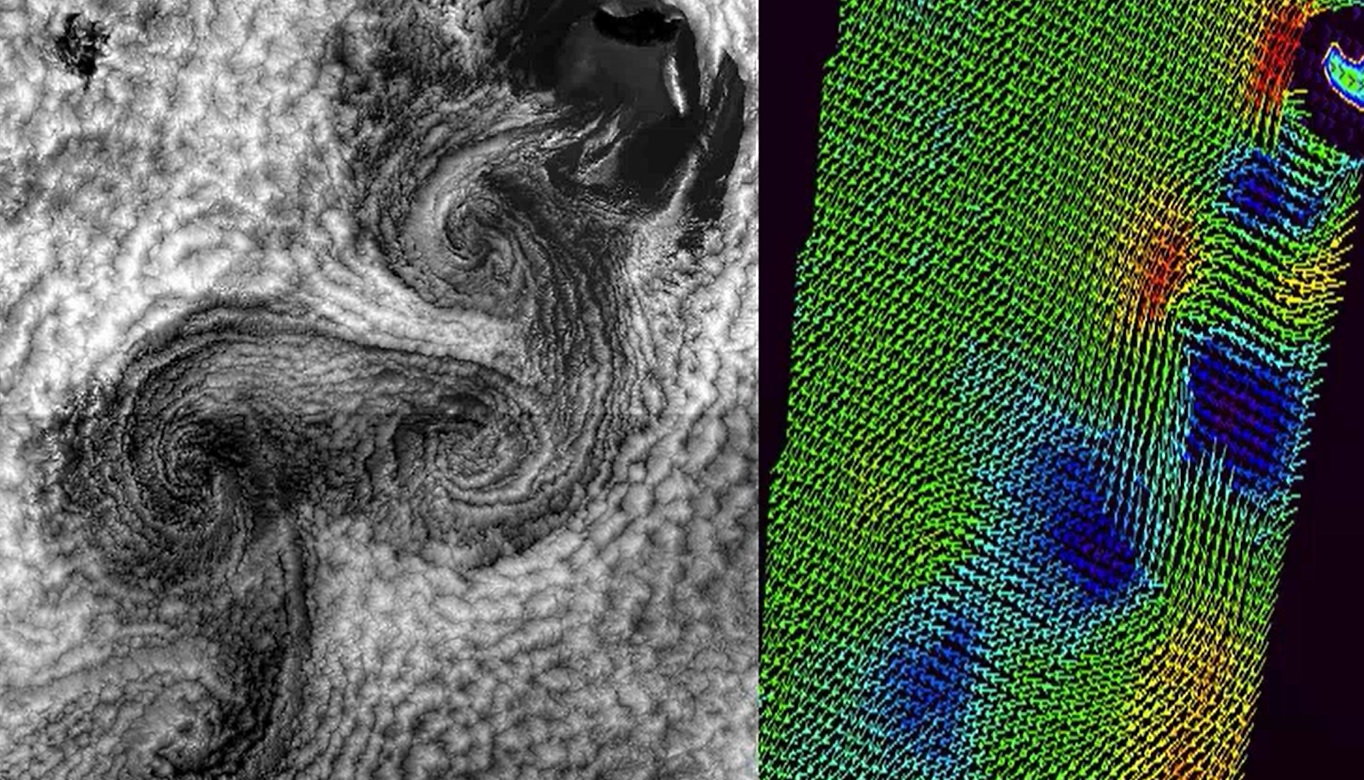
Storm Xynthia developed over the North Atlantic in late February 2010. The ASCAT sensor of EUMETSAT MetOp-A satellite tracked its evolution and provided insight into the life cycle of the storm.
This case study covers the development of storm Xynthia. Xynthia evolved out of a low pressure system which formed east of the Bermuda and lasted for 8 days. The storm was well depicted in satellite imagery and showed strong convective activity over the Atlantic. When approaching Western Europe and crossing Northern Europe, Xynthia was mainly a windstorm with gusts exceeding 150 km/h. The module briefly describes the functional principle of the ASCAT sensor and illustrates how measurement is performed and wind speed is retrieved. A comparison of ASCAT winds with NWP and surface winds is given, showing the benefits and drawbacks of each data source. Chapter 2 of the case study investigates the storms life cycle. In combination with satellite images, ASCAT wind data are plotted revealing deeper insight into the wind circulation close to ocean surface. The detailed analysis of the wind fields shows additional information on the position of the surface fronts and the location of pressure minima. Ongoing measurements of wind speed and direction from ASCAT is compared with NWP data and surface observations. The life cycle of storm Xynthia, from its real beginning over the Atlantic until its filling over the North Sea, is followed. During this time, Xynthia was covered 8 times by overpasses of the ASCAT sensor.
In this Training Module you will learn more about how the sea surface temperature is measured from satellite instruments.
Sea surface temperatures have been measured for over one hundred years, first using in situ instruments, which provide limited spatial and temporal coverage, and since the 70's from satellite. Depending on the satellite operating wavelength range, the temperature estimations correspond to distinct ocean depths. This tutorial is focused in the temperature of the surface emitting layer of ~ 10-20 μm depth, estimated from infrared measurements, the so-called Skin Sea Surface Temperature (SST). There are several SST providers and the choice of the most suitable product depends on the user application. In this tutorial several examples of SST datasets are shown, as well as some applications of this product.
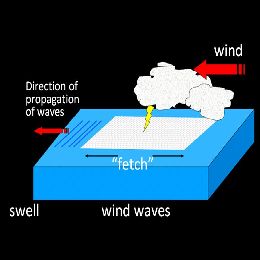
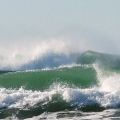
This lecture introduces the wave model products, eg. wave height and mean propagation direction, wave spectrum analysis, long swell forecasts, etc.
Length: 55 min
Author: Jean Bidlot (ECMWF)
Starting from the basics, this lecture introduces the students to wave model products (eg. wave height and mean propagation direction), wave spectrum analysis, long swell forecasts, extreme forecast index etc. Since these outputs (alongside data from the bouys) are the basic material marine forecasters have for forecasting and nowcasting waves in seas and especially in oceans, explaining the positive and negative sides of model outputs is very important for understanding and thus correctly using the products marine forecasters use.
The lecture dels with the characteristics of satellites carrying instruments for measuring winds and with the logic behind the calculations of winds using satellites.
Length: 51 min
Author: Ad Stoffelen (KNMI)
The lecture deals with modelled winds and winds derived from instruments onboard satellites like Metop-A and Metop-B in low orbits around the Earth (polar orbits). Today's models are evolving at a rate that is faster than the increase of density of observations and that presents a problem for forecasts. Here stands the question 'Will meteorology continue to develop and improve?'. The lack of observed data is thus filled with the data from satellites, although this data also has its own constraints due to the way it is derived. In the lecture the characteristics of the satellites carrying instruments for measuring winds and waves will be explained and the logic behind the calculations of winds using satellites will be discussed.
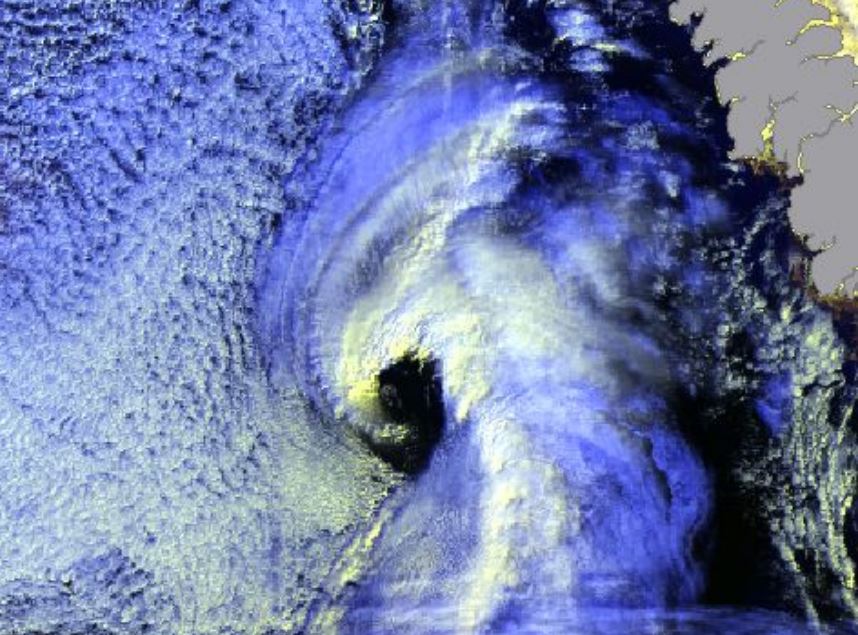
Gunnar Noer presents facts on Polar Lows, how they are forecasted, and gives examples of interpretation of satellite imagery.
Length: 55 min
Author: Gunnar Noer (MetNo)
Polar Lows can be seen as small Arctic hurricanes, and they have a severe impact on shipping and coastal communities in Scandinavia. They are most common in the Barents Sea and the Norwegian Sea, but are also known to occur in the central North Sea and surrounding coastal areas. Polar lows are the most intense type of wintery convection weather phenomenon in this area. Thus, a familiarity with Polar Lows will also increase our ability to forecast the more common snow shower events in the winter season. This talk will present some facts on Polar Lows, how they are forecasted, and give examples of interpretation of satellite imagery.