
Weather
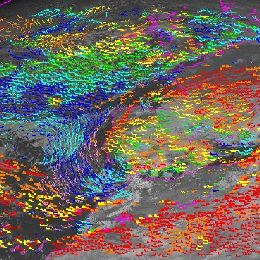
Javier Garcia-Pereda and Mate Mile give an overview on the NWC-SAF high resolution wind product and its application.
The “NWC SAF/HRW High Resolution Winds” provides a detailed calculation of Atmospheric Motion Vectors locally and in near real time. It calculates the AMVs considering cloud and humidity patterns in up to seven different MSG/SEVIRI channels (HRVIS, VIS06, VIS08, WV062, WV073, IR108, IR120), together with NWP data and the “NWC SAF Cloud products (Cloud type, Cloud top temperature and height)”.
It considers up to two tracer scales (Basic and detailed), two tracer determination methods (Gradient and tracer characteristics), two tracking methods (Euclidean distance or cross correlation), and two Height level assignment methods (Brightness temperature interpolation method and Cross correlation contribution method). As other AMV products worldwide it also includes a quality control flagging based on the Quality Indicator Method developed at EUMETSAT.
NWC SAF/HRW product can be useful in Nowcasting applications in synergy with other data available to the forecaster: monitoring of low level convergence, divergence at the top of developed systems, or other cases of small scale circulation or wind singularities. It can also be used as an input in analysis and forecasting applications like NWP models. The development and main characteristics of the product are explained with examples, useful for the potential users to know what the product can offer. The validation results related to the latest version on the product (HRW v4.0) are also explained.
The role of the Atmospheric Motion Vectors (AMV) in the modern data assimilation systems is evident nowadays. The AMVs – along with satellite observations – have an important key for our operational ALADIN data assimilation system as well. In the framework of the EUMETSAT SAF High Resolution Winds (HRW) products had been developed by AEMET for Nowcasting and Very Short Range Forecasting purposes. The HRW products provide quasi real time data of AMVs from MSG HRVIS and IR10.8 channels every hour in a day. A collaboration between AEMET and OMSZ have been focused to compare the benefit of the operationally used AMVs (received through the EumetCAST) with the newly processed HRW winds. Recent work was an extensive evaluation and monitoring of the assimilation and forecast system. The impact of the AMV winds was examined using different diagnostic techniques, verifications tools and case studies. The first results are promising regarding the use of the HRW AMV. The statistical scores on the full domain showed neutral or slightly positive impact in most of the parameters and the experiment based on HRW AMV data provided better estimate of extreme precipitation events.
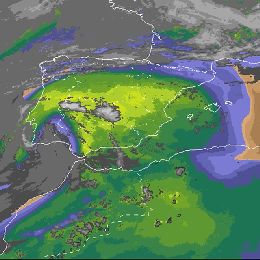
Miguel A. Martinez and Maria Putsay give an overview on the NWC-SAF clear air products and their applications.
Since 2010, the PGE13 SEVIRI Physical Retrieval (SPhR) is available as an operational product of the NWCSAF/MSG software package. The algorithm is based on the physical retrieval algorithm for GOES developed by Dr. Jun Li (CIMSS at Wisconsin University) but using RTTOV as the radiative transfer model and the coefficients adapted for SEVIRI. The PGE13 has been optimized for the purpose of operational implementation; near real time images could be seen on the NWC SAF reference system (http://www.nwcsaf.org).
The improvements on version 2013 of PGE13 are presented first. The main improvement on the 2013 version is that it allows the use as the background NWP input of ECMWF GRIB files on hybrid levels; the 2012 version only allows the use as NWP input of GRIB files on fixed pressure levels.
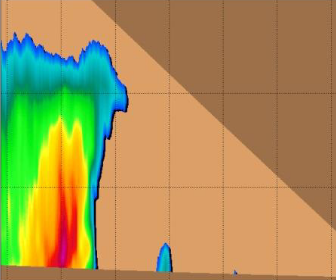
This step is a small milestone in the exploitation of this kind of MSG L2 products. Now, the spatial and temporal resolution could be used together with vertical resolution provided by the hybrid levels GRIB files to get information of 3D structures. The reason it that the use of hybrid GRIB files as input to the algorithm avoids the stepwise aspect on the vertical cross sections created by the linear interpolation between too separated levels in the fixed pressure levels PGE13 version. Other point is that the local execution of PGE13 allows the generation of optional files with fields like 3D equivalent potential temperature arrays. Thus, forecasters can fully exploit the 3D structure allowing the detection of instability vertical gradients on medium levels.
All these changes allow forecasters the use of the PGE13 for a better monitoring of key ingredients in regions where likely triggering of convective storm could develop and also advise of the regions where the NWP disagree with the PGE13 physical retrieved profiles. The use of PGE13 in several case studies will be presented.
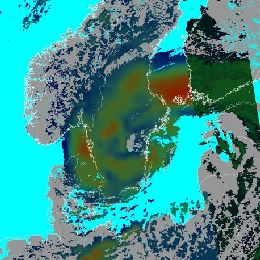
The NWCSAF Clear Air product consists of total and layer water vapour contents and instability indices. This product is retrieved from SEVIRI data for cloud-free pixels. As it can be calculated in 15-minute time step, even in 5-minute time step it is usable to monitor convection ability. Case studies will be presentation and analyzed: cases, when the NWP forecasted and the satellite retrieved convective environmental parameters are close to each other and when not. We will show selected cases when the NWCSAF Clear Air product has added value compared to the NWP forecast. The effect of the undetected clouds is also analysed.
As optional output the whole retrieved temperature and humidity profiles can be study. We show a case when the retrieved profiles were also analyzed. Statistical results will be presented on using the satellite retrieved Clear Air environmental parameters to separate stable from unstable environments and the environment where forming severe storm is not likely from the environment where it is possible.
David M. Schultz gives a presentation on the different conceptual models approaches concerning occlusion processes in frontal systems.
This talk presents new conceptual models in cyclone structures and evolutions. How does the large-scale flow in which the cyclone is embedded determine the type of frontal evolution that occurs? How does the air flow through cyclones, and what can this tell us about the possibility for damaging winds at the surface? This talk concludes with general principles for how forecasters can improve their skill through the use of conceptual models in operational forecasting.
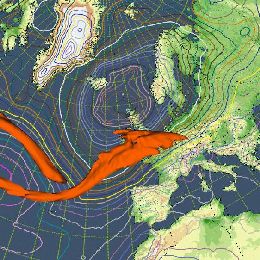
Fernando Prates gives a presentation on forecasting the tracks of tropical cyclones (TC). He gives presents the TC products delivered by ECMWF.
In this module the importance of forecasting tropical cyclones (TC) is briefly discussed. An overview is given of the recent developments in the forecast systems at ECMWF with impact on the forecast of TCs, including the recent change in the model’s resolution and the implementation of the Ensemble Data Assimilation. At the present time, any TC formed in the forecast system can be identified using a tracker developed at ECMWF. How does it work and what kind of products that can be derived from it is discussed. Some examples are also presented to highlight the model's ability to forecast the genesis of TCs. Finally the statistics of the forecast performance for TCs is discussed.
Anna Eronn gives an overview on the NWC-SAF PPS products and their applications, Thomas Heinemann presents the Eumetcast system.
The PPS package for Polar orbiting satellites produces Cloud Products for NOAA, METOP and the NPP-Suomi satellites. Products available are Cloud mask (CM), Cloud Type (CT), Cloud Top Temperature and Height (CTTH) and Cloud Physical Properties (CPP) during day CPP validated outputs are cloud phase and cloud liquid water path, as well as the auxiliary output fields cloud optical thickness, effective droplet radius and ice water path.
While the software package was originally aimed at producing NWC products for local satellite receiving stations, a subset of cloud products (CT and CTTH) are now also available in near real time via EUMETCAST within the NWC-EARS service.
In a second talk, Thomas Heinemann will present the EARS-NWC service. Data from the SAFNWC PPS package are computed at EUMETSAT headquarter and distributed via Eumetcast service to end-users.

Andreas Wirth gives an overview on the NWC-SAF ASII product and its applications, Eunha Sohn presents the NWC-SAF products adapted to the Korean COMS satellite.
PGE10 of the SAFNWC/MSG provides an automatic satellite image interpretation in terms of conceptual models (CMs). Conceptual models are important tools for forecasters in diagnosis, nowcasting and very short range forecasting; they describe a synthesis of typical features in satellite images as well as in other synoptic material (for instance numerical model output parameters) and the physical processes causing them. A CM diagnosis cannot only be used for detection of an ongoing process but also for the determination of the stage of development within this process.
This presentation will focus on the practical applications of ASII by showing examples of analysed synoptic weather situations.
In a second talk, Eunha Sohn from the Korean Meteorological Service will talk about applications of NWC SAF modules such as RDT, CRR, HRW and ASII in KMA, ongoing works and future works related to NWC SAF.
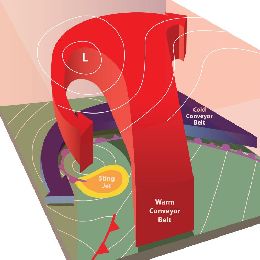
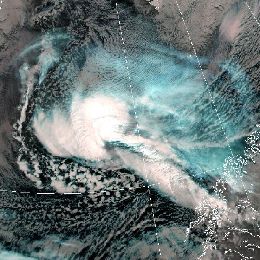
Frans Debie gives a presentation on the development of Rapid Cyclogenesis, their life cycle and the numerical parameters involved.
Extratropical cyclones, sometimes called mid-latitude cyclones or wave cyclones, are a group of cyclones defined as synoptic scale low pressure systems that occur in the middle latitudes and are associated with fronts (cold front, warm front and occlusion) and horizontal gradients in temperature and dew point , known as baroclinic zones. Extratropical cyclones are the everyday phenomena which, along with anticyclones, drive the weather over much of the Earth, producing anything from cloudiness and mild showers to heavy gales and thunderstorms. Evolution of these depressions can be recognized in the developing of the cloud systems. These cloud developments are the footprints of physical processes in the upper air. In case of explosive deepening it is called rapid cyclogenesis. Satellite imagery, especially recognition of cloud patterns and water vapour structures, can be a great help for marine forecasters to find the area where these cyclogenesis occurs. The deepening of the depression, where you can expect the strongest wind speeds at sea surface and what will be the distribution of the precipitation are issues which will be covered during the lecture. In general, the lecture will give insight in physical processes which can explain the development and life-cycle of rapid cyclogenesis by using single channel satellite images and RGB-images in combination with NWP model fields.
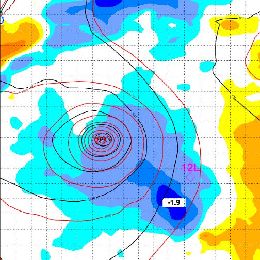
Gunnar Noer gives a detailed presentation on the formation of Polar Lows, the climatology and forecasting methods.
Polar lows are small but fairly intense lows that develop during cold air episodes during the winter season in the marine Arctic. The lecture will address some of the basic formation processes, the climatology and traditional forecasting based on deterministic short range models. Recently, Polar Lows are tracked using fine scale EPS based on the UM, and presently the Harmonie 2,5 km model. Results are represented as an estimate of probability for PL tracks, wind and precipitation.
Izolda Marcinoniene presents 2 case studies on severe thunderstorms over Poland and the Baltic States.
Length: 30 minutes.
Nowcasting of severe convective storms is still one of the most challenging tasks for operational forecasters. Satellite data are very useful in convection nowcasting because they enable a detailed monitoring of the various stages of convection; from the pre-convective environment to specific features on the tops of the mature convective clouds. Also, future MTG system will provide even better tools for convection nowcasting: satellite data with better temporal (every 2.5 min) and spatial resolution.
In this lecture, severe weather cases of 29 July 2012 and 30 July 2013 will be analysed by Izolda Marcinonienė (Lithuanian LHMS), mainly using MSG satellite images and ECMWF data. The first event includes a more expanded North-Eastern European area – from Poland (where the unstable situation started) towards the Baltic States (where the severe weather phenomena developed) to Finland (where they ended). The second event hit only Lithuania, but local very heavy rain reached even the disastrous phenomenon criteria and will be shortly presented as well.
Petra Mikus reports on nowcasting of severe weather using different satellite and NWP based products.
Length: 30 minutes.
Nowcasting of severe convective storms is still one of the most challenging tasks for operational forecasters. Satellite data are very useful in convection nowcasting because they enable a detailed monitoring of the various stages of convection; from the pre-convective environment to specific features on the tops of the mature convective clouds. Also, future MTG system will provide even better tools for convection nowcasting: satellite data with better temporal (every 2.5 min) and spatial resolution.
Various satellite products as well as their advantages and disadvantages for analysis and monitoring of the convective development over the Southern and Central Europe will be shown in the lecture presented by Petra Mikuš Jurković (DHMZ, Croatia). Also, the most interesting convective episodes detected during the 2.5 minute rapid-scan experiments with the MSG satellites will be analysed in detail.
Lothar Schueller gives an overview on the SAF structure and the generated products.
Length: 30 minutes.
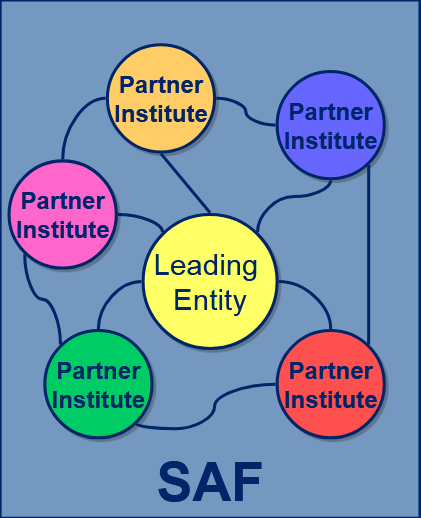
SAFs are dedicated centres of excellence for processing satellite data, achieved by utilising specialist expertise from the Member States. SAFs generate and disseminate operational EUMETSAT products and services and are an integral part of the distributed EUMETSAT Application Ground Segment.
Each SAF is led by the National Meteorological Service (NMS) of a EUMETSAT Member State, in association with a consortium of EUMETSAT Member States and Cooperating States, government bodies and research institutes. The lead NMS is responsible for the management of each complete SAF project. The research, data and services provided by the SAFs complement the standard meteorological products delivered by EUMETSAT’s central facilities in Darmstadt, Germany.
In this training module, you get an overview on the life cycle of Upper-Level-Lows and you will learn more about the impact on local weather.
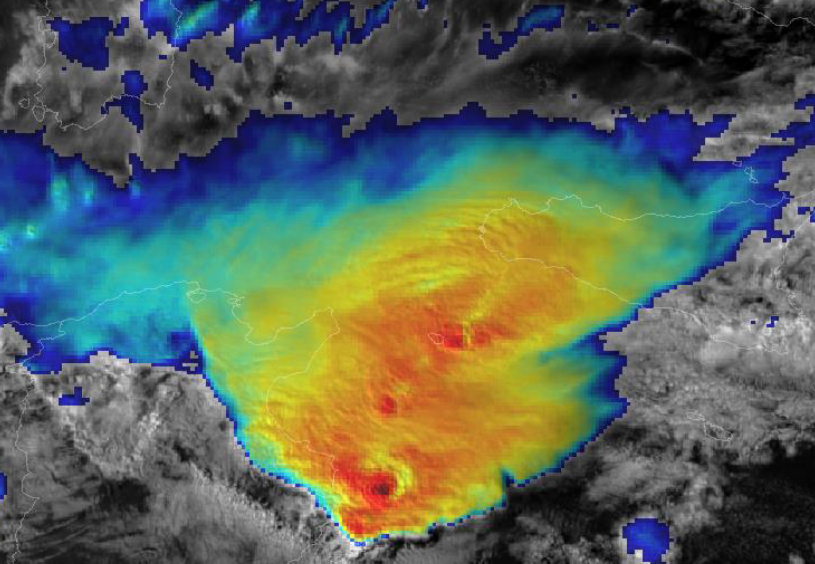
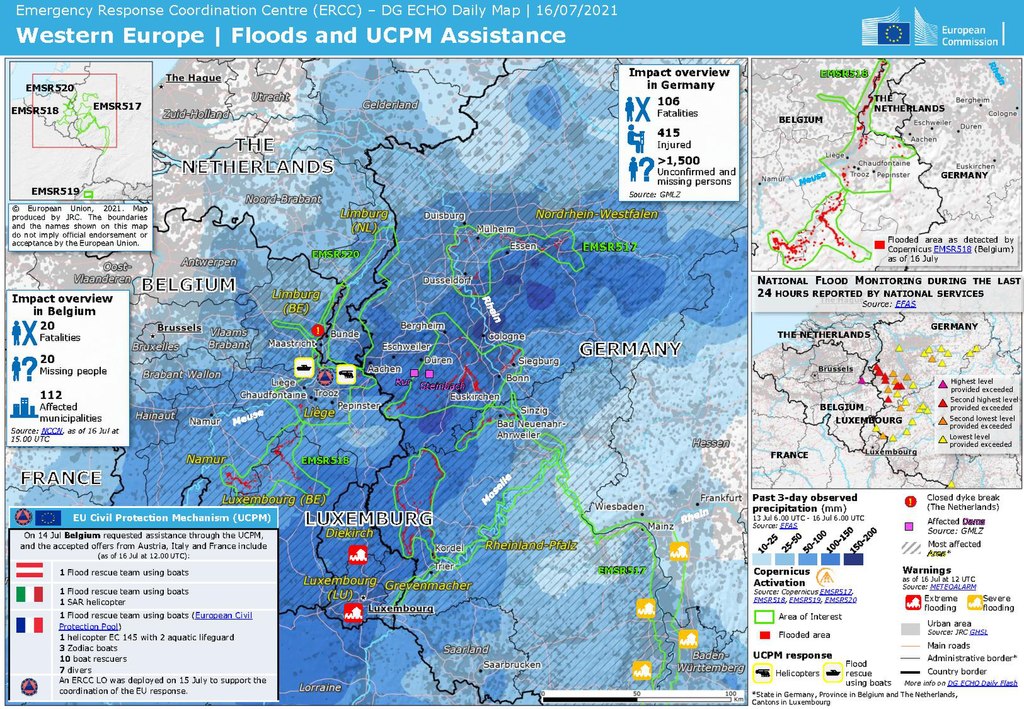
Upper-Level-Lows (ULLs) are a very common phenomenon in mid-lattitudes. They are usually associated with cold and rainy weather that can last for several days. When they remain stationary over a period of time, the can bring considerable amounts of rainfall locally. This synoptic situation has led in the past to floods and damages in infrastructure as will be show by the example of the Central European Flood in summer 2021.
This training module focusses on the meteorological aspects of ULLs, describes the life-cycle and throws a spottlight on the involved physical processes that accompany this meteorological phenomenon. Each stage of development is exemplified by satellite loops and corresponding NWP parameters. Exercises will help you to check the acquired knowledge.