
Identify surface features
Kenan Bolat reports on H SAF snow detection product H34 that is derived from the SEVIRI instrument on-board MSG H34 differs for flat and mountainous regions.
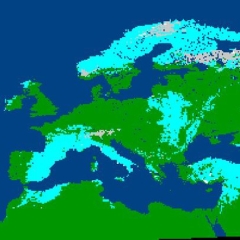
H34 is a snow mask product, which is retrieved from optical imaging radiometer Spinning Enhanced Visible and Infrared Imager (SEVIRI) mounted aboard the geostationary Meteosat Second Generation (MSG) satellite operated by EUMETSAT. MSG/SEVIRI provides continuous imaging of the earth in 12 spectral channels with a repeat cycle of 15 min. The imaging spatial resolution is 3 km at sub-satellite point and degrades to 5 km over Europe. The snow cover mapping is based on a multi-channel retrieval algorithm. It exploits the high reflectivity of snow in the visible spectrum and the low reflectivity at shorter wavelengths. The snow cover retrieval algorithm differs for flat and mountainous regions. Considering the different characteristics of snow for mountainous and flat areas, two different algorithms are used in producing the snow products for flat and mountainous areas, and then the products are merged to have a single snow product.
Niilo Siljamo reports on H SAF snow detection product H31 that is derived from the SEVIRI instrument on-board MSG.
In this session, EUMETSAT HSAF snow products H31 and H34 are explained in detail.
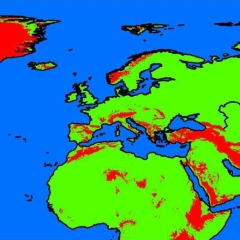
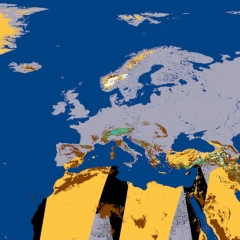
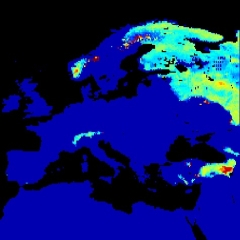
H31 is a full disk snow mask product for flatland areas, which is retrieved from optical imaging radiometer Spinning Enhanced Visible and Infrared Imager (SEVIRI) onboard the geostationary Meteosat Second Generation (MSG) satellites operated by EUMETSAT. MSG/SEVIRI provides continuous imaging of the earth in 12 spectral channels with a repeat cycle of 15 min. The imaging spatial resolution is 3 km in nadir and degrades to 5 km over Europe. The snow cover retrieval algorithm used in the product is based on empirical approach, which takes into account the highly variable nature of the snow-covered surface in satellite resolution. Validation results based on weather station observations(snow depth and the state of the ground observations) are very good.
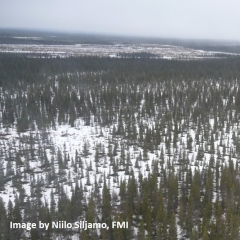
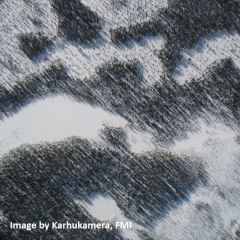
Ali Nadir Arslan gave an introduction to microwave remote sensing covering radiometry, characteristics, microwave sensors and applications.
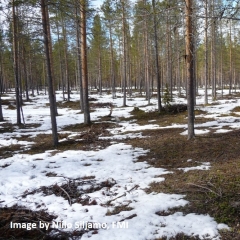
During winter season, snow covers about 40 million km2 in the Northern hemisphere. Snow is a vital water resource in many regions of the world. Climatic changes, Earth’s energy balance, water resources are strongly affected by the presence of snow. Knowledge of the amount of snow water equivalent from year to year is essential to estimate the effects of snow melt run-off. Knowing the snow characteristics helps to improve weather forecasts, to predict water supply for hydropower stations, and to anticipate flooding. Microwave sensors such asradiometers and radars are often used because of their usability under varying conditions, factors like clouds, rain and lack of light do not affect the measurement, the large penetration depth into the surface with increasing wavelength, sensitive to liquid water. Understanding of the relationship between microwave signatures and snow is very important for retrieving desired snowpack parameters such as snow density, snow water equivalent and snow wetness.
In this session, we will present a general introduction to microwave remote sensing covering radiometry, characteristics, microwave sensors and applications. We will also provide information on algorithms used to retrieve HSAF snow products from microwave sensors.
Semih Kuter and Burak Simsek introduce the H SAF snow detection products H32 and H35 derived from polar orbiter MetOp.
H35 is effective snow cover product, which is retrieved from optical imaging radiometer AVHRR mounted aboard NOAA and MetOP satellites. The third generation of AVHRR, i.e., AVHRR/3, is a multi-spectral scanning radiometer with three solar channels in the VIS/NIR region and three thermal infrared channels. It is currently onboard to NOAA-15, -18, -19 and MetOp-A, -B, -C satellites. The operational H35 is confined to the Northern Hemisphere The fractional snow cover (fSCA) value within a pixel is estimated by using the reflectance data obtained from AVHRR spectral bands. The final fSCA product has ~1 km spatial resolution and it incorporates snow cover fraction percentage from 0 to 100% as well as cloud and water classes. The product for flat/forested regions is generated by Finnish Meteorological Institute (FMI) and the product for mountainous areas is generated by Turkish State Meteorological Service (TSMS). Both products, thereafter, are merged at FMI. A full disk H35 product is an image of 8,999 rows by 35,999 columns(i.e., 324 M pixels approximately).
Niilo Siljamo reports on H SAF the daily snow mask product H32 that is derived from the AVHRR instrument on-board MetOp satellites.
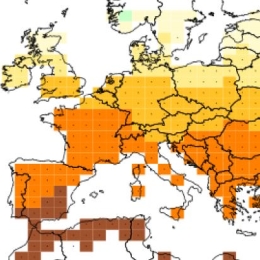
H32 is a global daily snow mask product, which is retrieved from the Advanced Very-High Resolution Radiometer (AVHRR) onboard the polar orbiting MetOp satellites operated by EUMETSAT. Metop/AVHRR provides daily global coverage on 5 channels. The spatial resolution is 1.1 km in nadir. The snow cover retrieval algorithm used in the product is based on empirical approach which takes into account the highly variable nature of the snowcovered surface in satellite resolution. Validation results based on weather station observations (snow depth and the state of the ground observations) are very good.
Simone Gabellani addresses the potential of using Sentinel-2 high-resolution imagery to validate moderate-resolution snow products.
In this part we will address the potential of using Sentinel-2 high-resolution imagery to validate moderate-resolution snow products supplied by the Hydrological Satellite Facility (HSAF) Project of EUMETSAT.
The consistency of Sentinel-2 observations has been assessed against both in-situ snow measurements and webcam digital imagery and they can be used as reference data (Piazzi et al 2019). We will show the comparison of HSAF products and Sentinel 2 dataset in different region of the world with different snow seasonality.
Alexander Toniazzo discusses the validation of H SAF snow detection products.
Information on snow properties is of critical relevance for a wide range of scientific studies and operational applications, mainly for hydrological purposes. However, ground-based monitoring of snow dynamics is a challenging task, especially over complex topography and under harsh environmental conditions. Remote sensing is a powerful resource providing snow observations at a large scale.
In this session, the validation of the products will be discussed in detail. The presentation will begin with a brief recap on the various snow product types: snow detection, Snow status (D/W), Fractional SC and SWE. Some of these products are over European areas, whereas the new products developed during CDOP3 are global products of full disk satellite products.
Following there will be a short discussion about performances and limitations of each product, based on the Operational Reviews of the last years. Validation of these products requires a great effort due to sparse availability of snow observation, especially, over extra-European areas. Therefore, new validation strategies were developed.
Matias Takala presents practical examples of how to use the H13 product (Snow Water Equivalent) will be presented using Jupyter notebook.
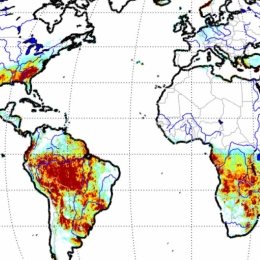
The Snow Water Equivalent (SWE) is a parameter that describes the water content of snow mass. If snow would melt in its place the SWE tells the depth of the resulting water layer. Spaceborne microwave radiometers are well suited for the detection of SWE. Even though the spatialresolution of radiometer data is rather coarse (tens of kilometres) a polar orbiting satellite can cover most of the globe in 24h period. Unlike optical instruments radiometer depends only on natural thermal radiation of objects and doesn’t require illumination from sun. In addition, radiometers are quite insensitive to weather phenomena. The EUMETSAT H SAF SWE products H13 and H65 are described in detail in this presentation. The products are merged products containing Finnish Meteorological Institute (FMI) contribution for flat lands and Turkish State Meteorological Service (TSMS) contribution for mountainous areas. Both products use Helsinki University of Technology (HUT) model as basis for the estimates. The FMI algorithm is a data assimilation algorithm combining ground-based snow depth measurements with spaceborne derived SWE estimates and the TSMS algorithm uses modified HUT model for mountains. The nominal resolution for H13 is 0.25° and for H65 25 km. Product H13 is provided for Europe in so called H-SAF area [25-75°N lat, 25°W-45°E long]. The upcoming product H65 will provided for Northern Hemisphere in EASE2 format. The products are validated against independent SWE snow course measurements.
In thissession, practical examples of how to use the H13 product will be presented using Jupyter notebook.
Francesco Avanzi talks about the evaluation of daily snow cover area (SCA) and snow water equivalent (SWE) data sets derived from SE-E-SEVIRI(H10) and SWE E(H13) respectively.
Increasing satellite technology offers new products for hydrological applications. The validation process is crucial for these products before they are used in operational applications. The validation of satellite data sets can be done through the direct comparison with ground truth data or a reference satellite data. Another, indirect approach consists in using these datasets in models with different complexities and assess the realism of modelled outputs (so called “Hydro Validation”). EUMETSAT H SAF project provides daily snow products on snow recognition, fractionalsnow cover, snow status and snow water equivalent over complex topographies changing from flat land to mountainous areas.
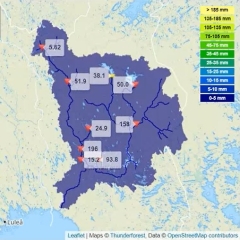
In this second part, daily snow cover area (SCA) and snow water equivalent (SWE) data sets derived from SE-E-SEVIRI(H10) and SWE E(H13), respectively, are evaluated over the mountainous terrain of the Upper Euphrates Basin. First the impact of the snow cover area product is analysed and then hydro validation of both data sets are assessed through conceptual models SRM and HBV. Moreover, since the assimilation of snow products improves snow states of the models, lead time runoff and snow state forecast performance will be presented.
Aynur Sensoy Soman discusses a blending approach to use SE-E-SEVIRI(H10) data together with Sentinel-2 and MODIS into a real-time, operational cryosphere modelling chain.
Increasing satellite technology offers new products for hydrological applications. The validation process is crucial for these products before they are used in operational applications. The validation of satellite data sets can be done through the direct comparison with ground truth data or a reference satellite data. Another, indirect approach consists in using these datasets in models with different complexities and assess the realism of modelled outputs (so called “Hydro Validation”). EUMETSAT H SAF project provides daily snow products on snow recognition, fractionalsnow cover, snow status and snow water equivalent over complex topographies changing from flat land to mountainous areas.
In this this first part, we will discuss a blending approach to use SE-E-SEVIRI(H10) data together with Sentinel 2 and MODIS into a real-time, operational cryosphere modelling chain (S3M-Italy). We will compare open-loop simulations with simulations obtained assimilating H10 data to discuss the added value of this product for real time forecasting.
Overview on the H SAF satellite derived snow products.
Reliable snow cover extent is of vital importance to have a comprehensive understanding for present and future climate, hydrological, and ecological dynamics. Development of methodologies to obtain reliable snow cover information by means of optical and microwave remote sensing (RS) has long been one of the most active research topics of the RS community. Operational snow products namely H10 (Snow detection (snow mask) by VIS/IR radiometry), H11 (dry/wet by MW radiometry), H12 (Effective snow cover by VIS/IR radiometry AVHRR), H13 (Snow Water Equivalent(SWE)by MW radiometry), H31 (Snow detection by VIS/IR radiometry), H32 (Effective snow cover by VIS/IR radiometry AVHRR) have been developed since 2008 within HSAF. Considering different characteristics of snow for mountainous and flat areas, various algorithms are used in producing the snow products for flat and mountainous areas, and then the products are merged to have a single snow product. The development of new snow products is in progress. The presentation will provide an overview of existing and future operational satellite-derived snow products of H SAF portfolio. In the last part of the presentation, there will be a short introduction of quality assessment. After a brief recap of all available operational and pre-operational products, the performances of the products and the new validation strategy using high-resolution satellite data will be discussed, with some interesting case studies of the latter.
Lecture slides (Arslan and Akyurek)...
Overview on the H SAF satellite derived precipitation products.
The EUMETSAT Satellite Application Facility for Operational Hydrology and Water Management (H SAF) provides satellite products and user services in support to Operational Hydrology, Meteorology, Risk Management and Water Management. Since 2005, H SAF science and research bridge into operations through the development and dissemination of soil moisture, precipitation and snow products based on the exploitation of primary EUMETSAT missions. During the fourth Continuous Development and Operations Phase (CDOP-4, from 2022 to 2027), H SAF products will be primarily based on the Meteosat Third Generation (MTG) and the EUMETSAT Polar System -Second Generation (EPS-SG) missions. Current products are based on the use of the full constellation of microwave (MW) radiometers for Level 2 passive microwave (MW) precipitation products and for MW/IR combined products for near-real time applications over the Meteosat Second Generation (MSG) full disk area. The presentation will provide a full overview of the current status and future development of the operational precipitation product portfolio as well as the product quality assessment strategy and results. Examples of applications for specific case studies will be also presented.
Lecture slides (Panegrossi)...