
Satellite skills and knowledge for operational meteorologist
Listed here are other resources related to Satellite skills and knowledge for operational meteorologist tag:
Note: click on an image to open the Resource
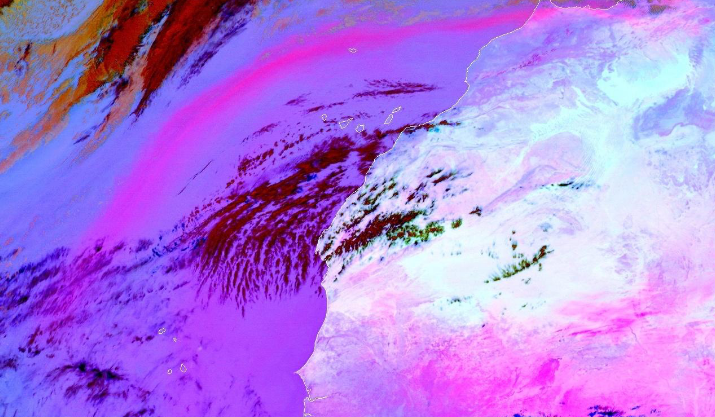
Jochen Kerkmann discusses the characteristics of the Dust RGB and presents the challenges of detecting dust clouds (like low level dust at night over water).
Length: 30 minutes.
Dust and smoke detection with SEVIRI RGB products: the lecture focuses on dust and smoke clouds and their identification in RGB products. The first part looks at the solar channels and the natural colours RGB product; the second part presents the triple window IR channels and the resulting dust RGB product. Some challenges of detecting dust clouds (like low level dust at night over water) will be discussed.
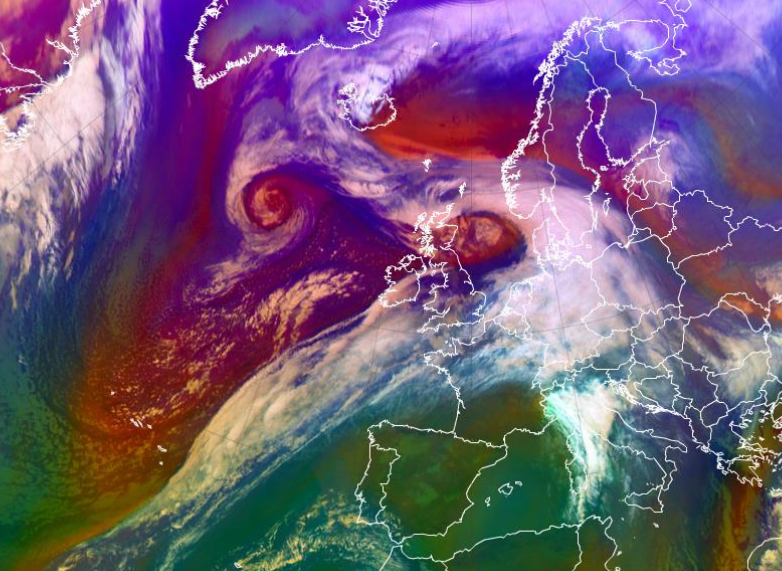
Liliane Hofer highlights the properties of the Airmass RGB.
Length: 30 minutes.
The Airmass RGB is for sure one of the more complex RGB composites as it uses brightness temperature differences and not single channels on each colour beam. But - as this presentation will show - it is nevertheless a very powerful tool for discriminating between different air masses and highlighting dynamic properties of the atmosphere.
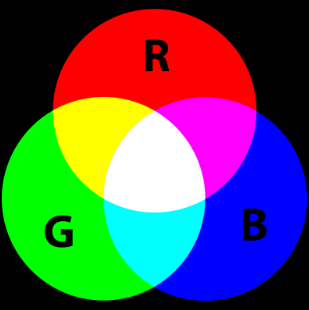
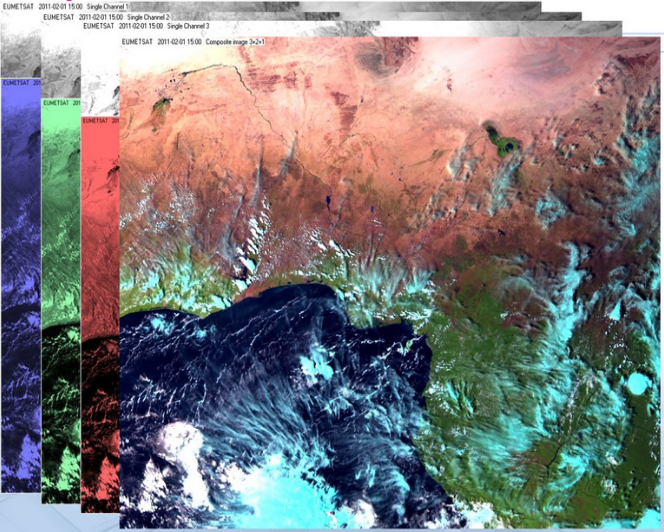
Maria Putsay talks about how to create an RGB image, how to extract, distill, and package the data into products that are easy to interpret and use for forecasters.
Length: 60 minutes.
What is the benefit to work with RGBs not only with single channel images? How to create an RGB image from raw data? How to create a good RGB image? How to enhance features and which features to enhance? Why use standard RGBs? How to extract, distill, and package the data into products that are easy to interpret and use for forecasters?
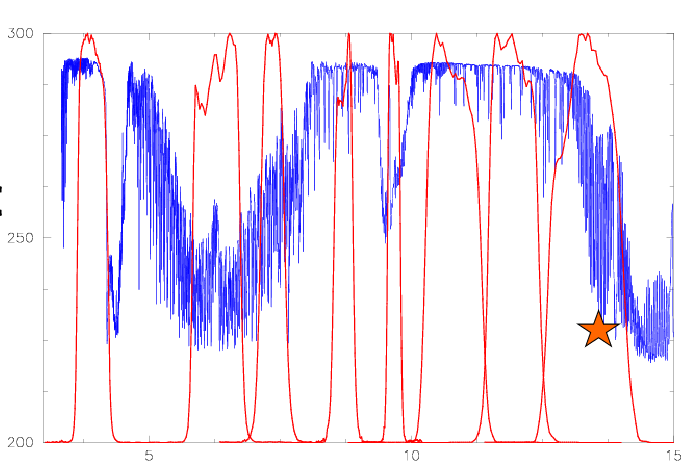
Xavier Calbet gives a presentation on MSG absorption channels.
Length: 60 minutes.
CO2 and Ozone channels are difficult to interpret directly because they are not "clean" channels that behave in a simple way. To understand them better, the basic concepts of atmospheric radiative transfer are introduced. In this way, it will be easier to understand how to interpret the meaning of these channels, and by extension, of all the other channels.
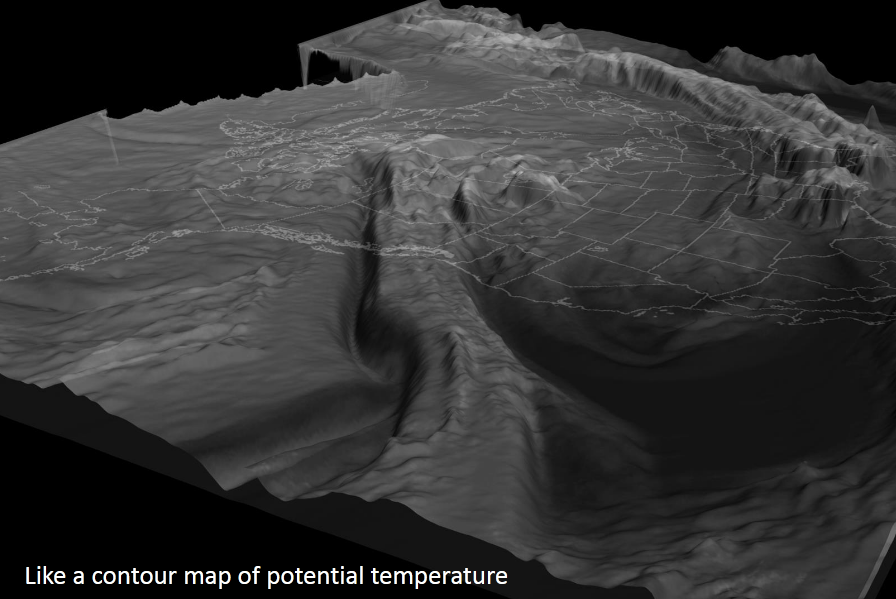
Phil Chadwick gives a presentation on the use of WV imagery to analyze and diagnose the 3-D structure and evolution of the atmosphere and meteorological processes.
Length: 60 minutes.
The use of WV imagery to analyze and diagnose the 3-D structure and evolution of the atmosphere and meteorological processes. Real time WV data can provide a high resolution understanding of the atmosphere in time and space that is independent of NWP.
Jan Kanak gives an introduction on the properties of the infra red channels on board of MSG.
Length: 60 minutes.
This presentation deals with the origins of infrared (IR) radiance, with description of different IR spectral regions and selection of spectral bands for meteorological satellites.
In next part practical aspects of utilization of IR satellite data will be presented, from processing fundamentals through image mapping, visualization, practical usage up to recognition and interpretation of various meteorological features. Presentation will explain also how can measured IR radiation provide physical information from different atmospheric layers and how this information can be associated with model outputs. Finally some notes on anisotropy of Earth-Atmosphere system in IR window will be demonstrated on real comparison of simultaneous measurements of the same scene but from different satellite positions in space.
Jose Prieto gives an introduction on the properties of the solar channels on board of MSG.
Length: 60 minutes.
Meteosat solar channels are fantastic, and after 11 years of operation still largely untamed. Additional four solar channels are recruited for the next generation, from 2018, for an eight-a-side match against the infrared team. Have you ever seen midnight sunglints, fire traffic lights or fog dips? Google will not help you. This presentation might cast solar light on those concepts.
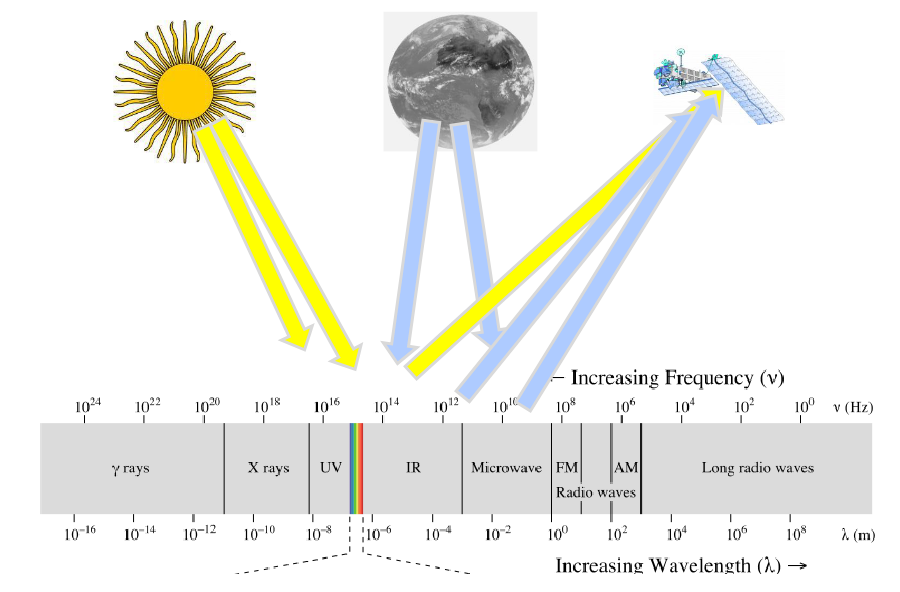
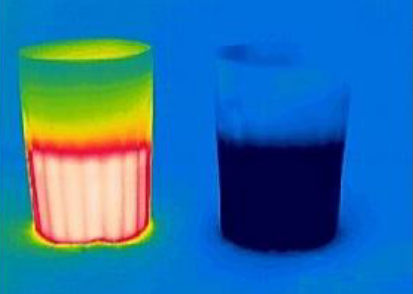
Marianne Koenig gives an introduction to radiation and remote sensing principles. The focus here is on radiation in the infrared and solar spectral range.
Length: 60 minutes.
The course gives an introduction to radiation and remote sensing principles: Questions like “what is remote sensing?”, “what is the electromagnetic spectrum?” and “which physical radiation laws describe all this?” are addressed. We then go into the specific application of all this to the earth-atmosphere system. The focus here is on radiation in the infrared and solar spectral range, as this is used in imaging instruments. Processes like absorption, emission, scattering and reflection will be described. In the end, a short outlook to (infrared) hyperspectral data will be provided.
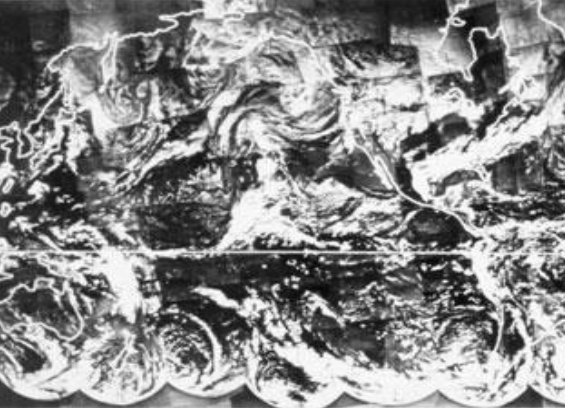
Andreas Wirth gives an overview on the historical development of satellites, instruments and remote sensing scanning techniques.
Length: 30 minutes.
This lecture presents an overview on the most commonly used instruments on board geostationary and polar orbiting satellites. The focus is laid on similarities and differences of instrument characteristics between these two types of satellites. Different types of instruments, covering the meteorological relevant spectrum, are shown. Active and passive instruments are explained as well as the presently used scanning principles.
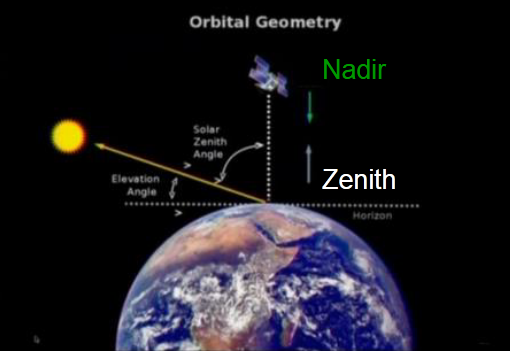
Jochen Kerkmann gives an overview on the historical development of satellites, orbits and instruments.
Length: 30 minutes.
The invention of weather satellites has opened a new area in weather forecasting. Satellite observations enable to continuously monitor the weather regimes on the whole globe. Therefore they provide a powerful tool in weather forecasting. This lecture leads from the invention of weather satellites to the current operational satellites.
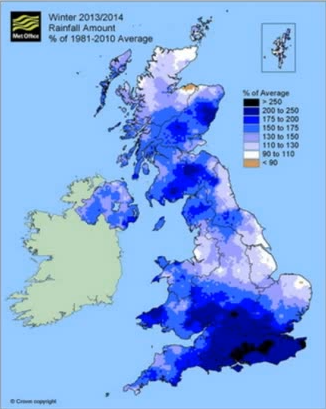
Gavin Robbins presents the meteorological conditions that led to the largest coastal surge down the East Coast of England since 1953.
Length: 30 minutes.
The winter of 2013-14 was the wettest for 250 years across England and Wales, with a succession of storms bringing sustained flooding from all natural sources, coastal, fluvial, surface water and groundwater. The presentation will start with an overview of the meteorological conditions that led to the largest coastal surge down the East Coast of England since 1953. The hydrometeorological conditions and flooding through late December 2013 to March 2014 will then be considered, along with examples and mechanisms of communicating the high impact conditions to emergency responders and Central Government. This included two briefings directly to our Prime Minister. Meteorological drivers and the possible teleconnections behind the exceptional conditions will also be considered.
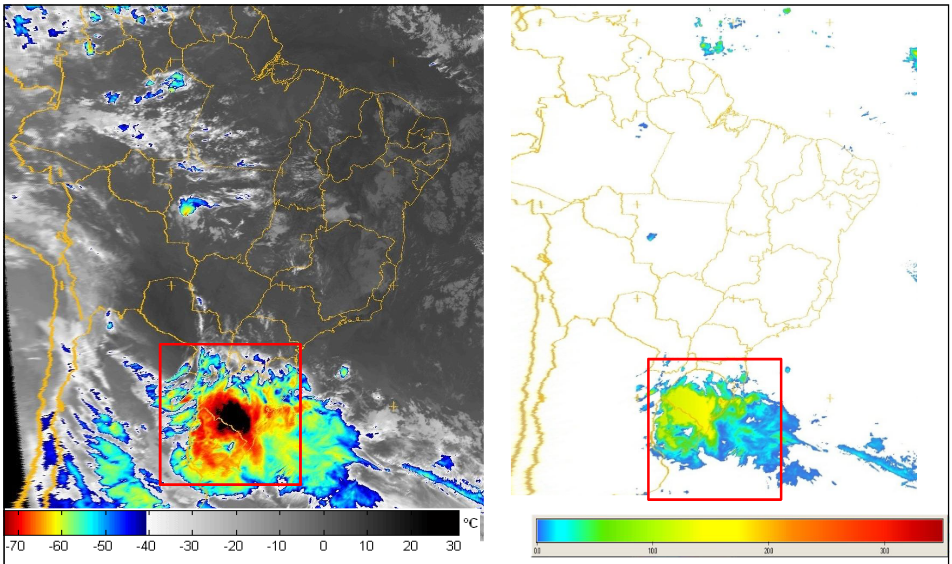
Humberto Barbosa talks on the use of satellite precipitation products for mapping land slides in Brazil.
Length: 50 minutes.
Research during the past decade has documented the importance of satellite precipitation products to the overall workings of the tropical landslide susceptibility. Several types of satellite precipitation products are used for landslide assessment but the area they see, and the frequency of observations, varies. Two complementary types are particularly relevant to landslide management. Polar-orbiting satellites fly in a relatively low orbit (often at around 1000km above the ground), providing relatively high spatial resolution. But they only collect data over the same point once every few days. Geostationary satellites are positioned at a much higher altitude (about 36,000km). They orbit the Earth at the same speed as the Earth rotates on its axis, in effect remaining stationary above the ground and viewing the whole earth disk below. Their spatial data is much coarser, but is collected at the same point every 15 minutes. Moreover, rainfall-triggered landslides tend to be local-scale features, but ground conditions are also very important. When they destroy people's lives and livelihoods, they become natural disasters. Thus, Understanding the nature of spatial and temporal variability of rainfall events in developing countries is important to improve the landslide-prediction science. This seminar will present an overview of recent landslide examples in Brazil and applications of satellite precipitation products. A key satellite input dataset for the integrated applications is the EUMETSAT’s Satellite Application Facility on Support to Operational Hydrology and Water Management.